

Keith Vodden Dr. Douglas Smith - Transports Canada
Keith Vodden Dr. Douglas Smith - Transports Canada
Keith Vodden Dr. Douglas Smith - Transports Canada

Create successful ePaper yourself
Turn your PDF publications into a flip-book with our unique Google optimized e-Paper software.
Social Cost of Motor Vehicle Collisions in Ontario<br />
D. COMPARISON OF SOCIAL COSTS ESTIMATES FOR 2004 AND 1990<br />
Estimates of the social cost of motor vehicle collisions in Ontario for 2004 use a<br />
similar methodology to that employed by the estimates for 1990. We compare the results<br />
of the two studies in this section.<br />
The comparison we make uses the willingness to pay approach and low estimate<br />
scenario (this results in the same modelling approach to the value of human consequences<br />
in the two studies) and excludes cost items for court costs and traffic delays not estimated<br />
in the earlier study. This comparison allows us to focus on relative changes in the cost<br />
items between the two estimates.<br />
IV-4.<br />
The distribution of total costs by comparable cost component is noted in Exhibit<br />
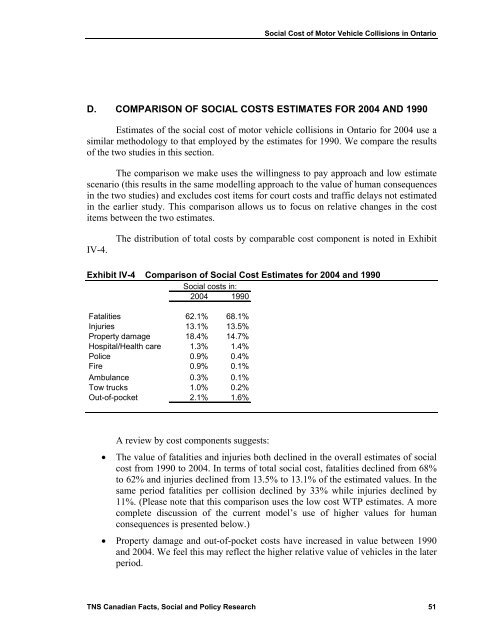
Exhibit IV-4 Comparison of Social Cost Estimates for 2004 and 1990<br />
Social costs in:<br />
2004 1990<br />
Fatalities 62.1% 68.1%<br />
Injuries 13.1% 13.5%<br />
Property damage 18.4% 14.7%<br />
Hospital/Health care 1.3% 1.4%<br />
Police 0.9% 0.4%<br />
Fire 0.9% 0.1%<br />
Ambulance 0.3% 0.1%<br />
Tow trucks 1.0% 0.2%<br />
Out-of-pocket 2.1% 1.6%<br />
A review by cost components suggests:<br />
• The value of fatalities and injuries both declined in the overall estimates of social<br />
cost from 1990 to 2004. In terms of total social cost, fatalities declined from 68%<br />
to 62% and injuries declined from 13.5% to 13.1% of the estimated values. In the<br />
same period fatalities per collision declined by 33% while injuries declined by<br />
11%. (Please note that this comparison uses the low cost WTP estimates. A more<br />
complete discussion of the current model’s use of higher values for human<br />
consequences is presented below.)<br />
• Property damage and out-of-pocket costs have increased in value between 1990<br />
and 2004. We feel this may reflect the higher relative value of vehicles in the later<br />
period.<br />
TNS Canadian Facts, Social and Policy Research 51


