

Keith Vodden Dr. Douglas Smith - Transports Canada
Keith Vodden Dr. Douglas Smith - Transports Canada
Keith Vodden Dr. Douglas Smith - Transports Canada

You also want an ePaper? Increase the reach of your titles
YUMPU automatically turns print PDFs into web optimized ePapers that Google loves.
Appendix A—Detail on Calculations of the Ontario Model<br />
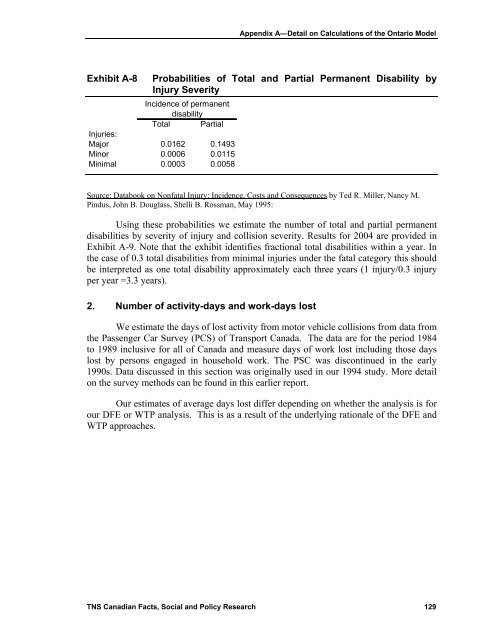
Exhibit A-8<br />
Probabilities of Total and Partial Permanent Disability by<br />
Injury Severity<br />
Incidence of permanent<br />
disability<br />
Total Partial<br />
Injuries:<br />
Major 0.0162 0.1493<br />
Minor 0.0006 0.0115<br />
Minimal 0.0003 0.0058<br />
Source: Databook on Nonfatal Injury: Incidence, Costs and Consequences by Ted R. Miller, Nancy M.<br />
Pindus, John B. <strong>Douglas</strong>s, Shelli B. Rossman, May 1995:<br />
Using these probabilities we estimate the number of total and partial permanent<br />
disabilities by severity of injury and collision severity. Results for 2004 are provided in<br />
Exhibit A-9. Note that the exhibit identifies fractional total disabilities within a year. In<br />
the case of 0.3 total disabilities from minimal injuries under the fatal category this should<br />
be interpreted as one total disability approximately each three years (1 injury/0.3 injury<br />
per year =3.3 years).<br />
2. Number of activity-days and work-days lost<br />
We estimate the days of lost activity from motor vehicle collisions from data from<br />
the Passenger Car Survey (PCS) of Transport <strong>Canada</strong>. The data are for the period 1984<br />
to 1989 inclusive for all of <strong>Canada</strong> and measure days of work lost including those days<br />
lost by persons engaged in household work. The PSC was discontinued in the early<br />
1990s. Data discussed in this section was originally used in our 1994 study. More detail<br />
on the survey methods can be found in this earlier report.<br />
Our estimates of average days lost differ depending on whether the analysis is for<br />
our DFE or WTP analysis. This is as a result of the underlying rationale of the DFE and<br />
WTP approaches.<br />
TNS Canadian Facts, Social and Policy Research 129


