

Keith Vodden Dr. Douglas Smith - Transports Canada
Keith Vodden Dr. Douglas Smith - Transports Canada
Keith Vodden Dr. Douglas Smith - Transports Canada

You also want an ePaper? Increase the reach of your titles
YUMPU automatically turns print PDFs into web optimized ePapers that Google loves.
Analysis and Estimation of the Social Cost of Motor Vehicle Collisions in Ontario<br />
yields 5,293 unique persons who were injured in motor vehicle collisions, admitted to<br />
hospital and survived. This definition is most in keeping with the major injury category of<br />
ORSAR.<br />
The number of emergency room visits not requiring a hospital stay is also<br />
estimated using MOH<C data. From the total number of visits to an Emergency<br />
Room (ER) we select only those going to ER for an unplanned visit for a new clinical<br />
condition. From this number we subtract those who:<br />
• Leave without being seen, treated, or having completed treatment (included in<br />
minimal injuries).<br />
• Are admitted (major injury).<br />
• Die on or after arrival (fatalities).<br />
• Transfer to another care facility (possible duplicate in data).<br />
According to the MOT<C data a total of 60,726 individuals visit an<br />
emergency room and are released after care (comparable to minor injuries) as a result of<br />
motor vehicle collisions in 2004.<br />
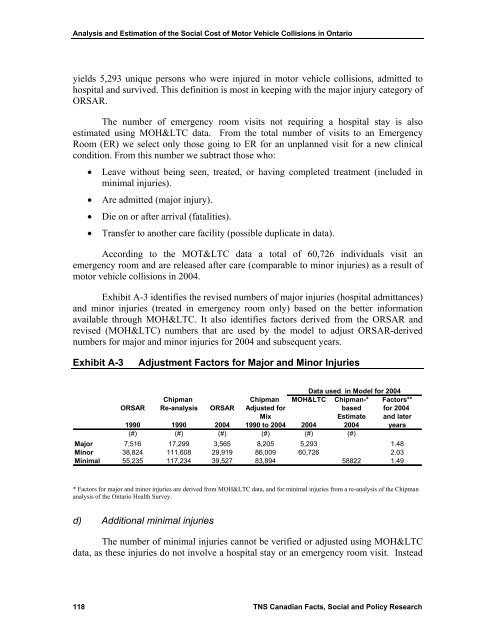
Exhibit A-3 identifies the revised numbers of major injuries (hospital admittances)<br />
and minor injuries (treated in emergency room only) based on the better information<br />
available through MOH<C. It also identifies factors derived from the ORSAR and<br />
revised (MOH<C) numbers that are used by the model to adjust ORSAR-derived<br />
numbers for major and minor injuries for 2004 and subsequent years.<br />
Exhibit A-3<br />
Adjustment Factors for Major and Minor Injuries<br />
Data used in Model for 2004<br />
Chipman Chipman MOH<C Chipman-* Factors**<br />
ORSAR Re-analysis ORSAR Adjusted for based for 2004<br />
Mix Estimate and later<br />
1990 1990 2004 1990 to 2004 2004 2004 years<br />
(#) (#) (#) (#) (#) (#)<br />
Major 7,516 17,299 3,565 8,205 5,293 1.48<br />
Minor 38,824 111,608 29,919 86,009 60,726 2.03<br />
Minimal 55,235 117,234 39,527 83,894 58822 1.49<br />
* Factors for major and minor injuries are derived from MOH<C data, and for minimal injuries from a re-analysis of the Chipman<br />
analysis of the Ontario Health Survey.<br />
d) Additional minimal injuries<br />
The number of minimal injuries cannot be verified or adjusted using MOH<C<br />
data, as these injuries do not involve a hospital stay or an emergency room visit. Instead<br />
118 TNS Canadian Facts, Social and Policy Research


