

Keith Vodden Dr. Douglas Smith - Transports Canada
Keith Vodden Dr. Douglas Smith - Transports Canada
Keith Vodden Dr. Douglas Smith - Transports Canada

Create successful ePaper yourself
Turn your PDF publications into a flip-book with our unique Google optimized e-Paper software.
Appendix A—Detail on Calculations of the Ontario Model<br />
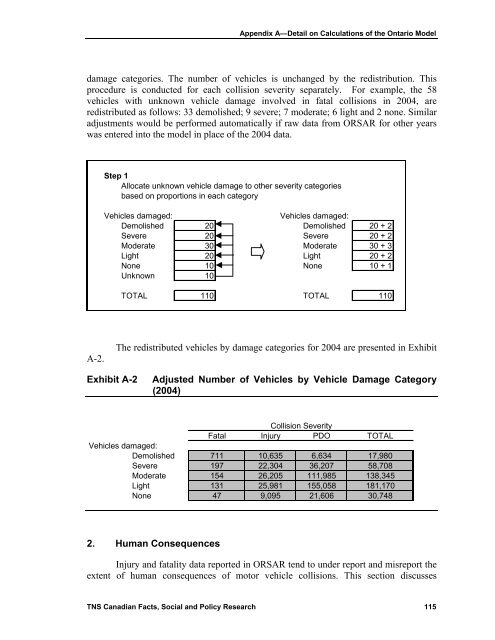
damage categories. The number of vehicles is unchanged by the redistribution. This<br />
procedure is conducted for each collision severity separately. For example, the 58<br />
vehicles with unknown vehicle damage involved in fatal collisions in 2004, are<br />
redistributed as follows: 33 demolished; 9 severe; 7 moderate; 6 light and 2 none. Similar<br />
adjustments would be performed automatically if raw data from ORSAR for other years<br />
was entered into the model in place of the 2004 data.<br />
Step 1<br />
Allocate unknown vehicle damage to other severity categories<br />
based on proportions in each category<br />
Vehicles damaged:<br />
Vehicles damaged:<br />
Demolished 20 Demolished 20 + 2<br />
Severe 20 Severe 20 + 2<br />
Moderate 30 Moderate 30 + 3<br />
Light 20 Light 20 + 2<br />
None 10 None 10 + 1<br />
Unknown 10<br />
TOTAL 110 TOTAL 110<br />
A-2.<br />
The redistributed vehicles by damage categories for 2004 are presented in Exhibit<br />
Exhibit A-2<br />
Adjusted Number of Vehicles by Vehicle Damage Category<br />
(2004)<br />
Collision Severity<br />
Fatal Injury PDO TOTAL<br />
Vehicles damaged:<br />
Demolished 711 10,635 6,634 17,980<br />
Severe 197 22,304 36,207 58,708<br />
Moderate 154 26,205 111,985 138,345<br />
Light 131 25,981 155,058 181,170<br />
None 47 9,095 21,606 30,748<br />
2. Human Consequences<br />
Injury and fatality data reported in ORSAR tend to under report and misreport the<br />
extent of human consequences of motor vehicle collisions. This section discusses<br />
TNS Canadian Facts, Social and Policy Research 115


