

On the Ecology of Mountainous Forests in a Changing Climate: A ...
On the Ecology of Mountainous Forests in a Changing Climate: A ...
On the Ecology of Mountainous Forests in a Changing Climate: A ...

You also want an ePaper? Increase the reach of your titles
YUMPU automatically turns print PDFs into web optimized ePapers that Google loves.
Behaviour <strong>of</strong> FORCLIM along a transect <strong>in</strong> <strong>the</strong> European Alps 95<br />
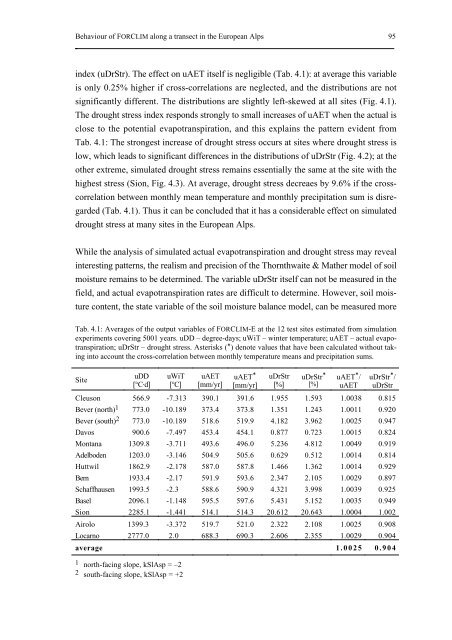
<strong>in</strong>dex (uDrStr). The effect on uAET itself is negligible (Tab. 4.1): at average this variable<br />
is only 0.25% higher if cross-correlations are neglected, and <strong>the</strong> distributions are not<br />
significantly different. The distributions are slightly left-skewed at all sites (Fig. 4.1).<br />
The drought stress <strong>in</strong>dex responds strongly to small <strong>in</strong>creases <strong>of</strong> uAET when <strong>the</strong> actual is<br />
close to <strong>the</strong> potential evapotranspiration, and this expla<strong>in</strong>s <strong>the</strong> pattern evident from<br />
Tab. 4.1: The strongest <strong>in</strong>crease <strong>of</strong> drought stress occurs at sites where drought stress is<br />
low, which leads to significant differences <strong>in</strong> <strong>the</strong> distributions <strong>of</strong> uDrStr (Fig. 4.2); at <strong>the</strong><br />
o<strong>the</strong>r extreme, simulated drought stress rema<strong>in</strong>s essentially <strong>the</strong> same at <strong>the</strong> site with <strong>the</strong><br />
highest stress (Sion, Fig. 4.3). At average, drought stress decreaes by 9.6% if <strong>the</strong> crosscorrelation<br />
between monthly mean temperature and monthly precipitation sum is disregarded<br />
(Tab. 4.1). Thus it can be concluded that it has a considerable effect on simulated<br />
drought stress at many sites <strong>in</strong> <strong>the</strong> European Alps.<br />
While <strong>the</strong> analysis <strong>of</strong> simulated actual evapotranspiration and drought stress may reveal<br />
<strong>in</strong>terest<strong>in</strong>g patterns, <strong>the</strong> realism and precision <strong>of</strong> <strong>the</strong> Thornthwaite & Ma<strong>the</strong>r model <strong>of</strong> soil<br />
moisture rema<strong>in</strong>s to be determ<strong>in</strong>ed. The variable uDrStr itself can not be measured <strong>in</strong> <strong>the</strong><br />
field, and actual evapotranspiration rates are difficult to determ<strong>in</strong>e. However, soil moisture<br />
content, <strong>the</strong> state variable <strong>of</strong> <strong>the</strong> soil moisture balance model, can be measured more<br />
Tab. 4.1: Averages <strong>of</strong> <strong>the</strong> output variables <strong>of</strong> FORCLIM-E at <strong>the</strong> 12 test sites estimated from simulation<br />
experiments cover<strong>in</strong>g 5001 years. uDD – degree-days; uWiT – w<strong>in</strong>ter temperature; uAET – actual evapotranspiration;<br />
uDrStr – drought stress. Asterisks (*) denote values that have been calculated without tak<strong>in</strong>g<br />
<strong>in</strong>to account <strong>the</strong> cross-correlation between monthly temperature means and precipitation sums.<br />
Site<br />
uDD<br />
[°C·d]<br />
uWiT<br />
[°C]<br />
uAET<br />
[mm/yr]<br />
uAET *<br />
[mm/yr]<br />
uDrStr<br />
[%]<br />
uDrStr *<br />
[%]<br />
uAET * /<br />
uAET<br />
uDrStr * /<br />
uDrStr<br />
Cleuson 566.9 -7.313 390.1 391.6 1.955 1.593 1.0038 0.815<br />
Bever (north) 1 773.0 -10.189 373.4 373.8 1.351 1.243 1.0011 0.920<br />
Bever (south) 2 773.0 -10.189 518.6 519.9 4.182 3.962 1.0025 0.947<br />
Davos 900.6 -7.497 453.4 454.1 0.877 0.723 1.0015 0.824<br />
Montana 1309.8 -3.711 493.6 496.0 5.236 4.812 1.0049 0.919<br />
Adelboden 1203.0 -3.146 504.9 505.6 0.629 0.512 1.0014 0.814<br />
Huttwil 1862.9 -2.178 587.0 587.8 1.466 1.362 1.0014 0.929<br />
Bern 1933.4 -2.17 591.9 593.6 2.347 2.105 1.0029 0.897<br />
Schaffhausen 1993.5 -2.3 588.6 590.9 4.321 3.998 1.0039 0.925<br />
Basel 2096.1 -1.148 595.5 597.6 5.431 5.152 1.0035 0.949<br />
Sion 2285.1 -1.441 514.1 514.3 20.612 20.643 1.0004 1.002<br />
Airolo 1399.3 -3.372 519.7 521.0 2.322 2.108 1.0025 0.908<br />
Locarno 2777.0 2.0 688.3 690.3 2.606 2.355 1.0029 0.904<br />
average 1.0025 0.904<br />
1 north-fac<strong>in</strong>g slope, kSlAsp = –2<br />
2 south-fac<strong>in</strong>g slope, kSlAsp = +2


