

On the Ecology of Mountainous Forests in a Changing Climate: A ...
On the Ecology of Mountainous Forests in a Changing Climate: A ...
On the Ecology of Mountainous Forests in a Changing Climate: A ...

You also want an ePaper? Increase the reach of your titles
YUMPU automatically turns print PDFs into web optimized ePapers that Google loves.
Appendix 207<br />
The m<strong>in</strong>imum w<strong>in</strong>ter temperature parameter was adapted from <strong>the</strong> values given <strong>in</strong> Kienast<br />
(1987) and Prentice & Helmisaari (1991); <strong>the</strong>se authors assume that <strong>the</strong> coldest month<br />
always is January. A comparison <strong>of</strong> <strong>the</strong> current mean January temperature with <strong>the</strong><br />
m<strong>in</strong>imum <strong>of</strong> <strong>the</strong> current mean December, January, and February temperatures conducted<br />
at <strong>the</strong> 12 sites used <strong>in</strong> <strong>the</strong> present study revealed that <strong>the</strong> latter m<strong>in</strong>imum temperature is at<br />
average 1.27 °C lower than <strong>the</strong> current mean January temperature; thus <strong>the</strong> kWiT<br />
parameters obta<strong>in</strong>ed from Kienast (1987) and Prentice & Helmisaari (1991) were lowered<br />
by 1 °C. In cases where both authors give parameters, <strong>the</strong> Prentice & Helmisaari (1991)<br />
values were adopted with higher priority (Tab. A-8; cf. discussion <strong>in</strong> Prentice &<br />
Helmisaari 1991).<br />
kNTol & kDrT parameters<br />
Nitrogen (kNTol) and drought (kDrt) tolerance values <strong>of</strong> all tree species were compiled<br />
from Landolt (1977), Ellenberg (1986), Prentice & Helmisaari (1991) and Jahn (1991).<br />
The kNTol parameters (Tab. A-9) were derived from <strong>the</strong>se sources by averag<strong>in</strong>g and<br />
round<strong>in</strong>g to <strong>the</strong> nearest <strong>in</strong>teger number.<br />
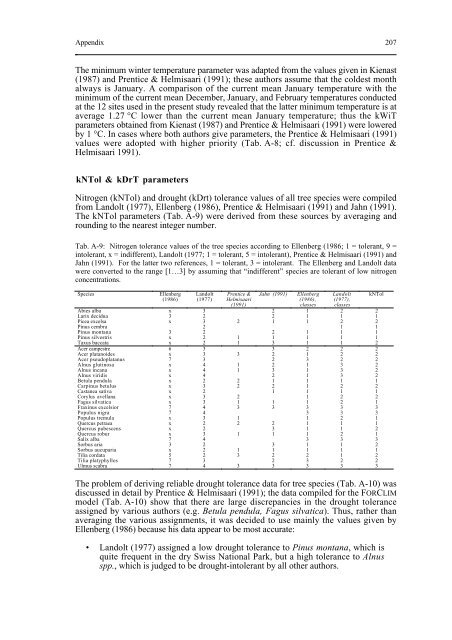
Tab. A-9: Nitrogen tolerance values <strong>of</strong> <strong>the</strong> tree species accord<strong>in</strong>g to Ellenberg (1986; 1 = tolerant, 9 =<br />
<strong>in</strong>tolerant, x = <strong>in</strong>different), Landolt (1977; 1 = tolerant, 5 = <strong>in</strong>tolerant), Prentice & Helmisaari (1991) and<br />
Jahn (1991). For <strong>the</strong> latter two references, 1 = tolerant, 3 = <strong>in</strong>tolerant. The Ellenberg and Landolt data<br />
were converted to <strong>the</strong> range [1…3] by assum<strong>in</strong>g that “<strong>in</strong>different” species are tolerant <strong>of</strong> low nitrogen<br />
concentrations.<br />
Species<br />
Ellenberg<br />
(1986)<br />
Landolt<br />
(1977)<br />
Prentice &<br />
Helmisaari<br />
(1991)<br />
Jahn (1991)<br />
Ellenberg<br />
(1986),<br />
classes<br />
Landolt<br />
(1977),<br />
classes<br />
Abies alba x 3 2 1 2 2<br />
Larix decidua 3 2 2 1 1 1<br />
Picea excelsa x 3 2 1 1 2 2<br />
P<strong>in</strong>us cembra 2 1 1<br />
P<strong>in</strong>us montana 3 2 2 1 1 1<br />
P<strong>in</strong>us silvestris x 2 1 1 1 1 1<br />
Taxus baccata x 2 1 3 1 1 2<br />
Acer campestre 6 3 3 2 2 2<br />
Acer platanoides x 3 3 2 1 2 2<br />
Acer pseudoplatanus 7 3 2 3 2 2<br />
Alnus glut<strong>in</strong>osa x 4 1 2 1 3 2<br />
Alnus <strong>in</strong>cana x 4 1 3 1 3 2<br />
Alnus viridis x 4 2 1 3 2<br />
Betula pendula x 2 2 1 1 1 1<br />
Carp<strong>in</strong>us betulus x 3 2 2 1 2 2<br />
Castanea sativa x 2 1 1 1 1<br />
Corylus avellana x 3 2 1 2 2<br />
Fagus silvatica x 3 1 1 1 2 1<br />
Frax<strong>in</strong>us excelsior 7 4 3 3 3 3 3<br />
Populus nigra 7 4 3 3 3<br />
Populus tremula x 3 1 1 2 1<br />
Quercus petraea x 2 2 2 1 1 1<br />
Quercus pubescens x 2 3 1 1 2<br />
Quercus robur x 3 1 1 1 2 1<br />
Salix alba 7 4 3 3 3<br />
Sorbus aria 3 2 3 1 1 2<br />
Sorbus aucuparia x 2 1 1 1 1 1<br />
Tilia cordata 5 2 3 2 2 1 2<br />
Tilia platyphyllos 7 3 2 3 2 2<br />
Ulmus scabra 7 4 3 3 3 3 3<br />
The problem <strong>of</strong> deriv<strong>in</strong>g reliable drought tolerance data for tree species (Tab. A-10) was<br />
discussed <strong>in</strong> detail by Prentice & Helmisaari (1991); <strong>the</strong> data compiled for <strong>the</strong> FORCLIM<br />
model (Tab. A-10) show that <strong>the</strong>re are large discrepancies <strong>in</strong> <strong>the</strong> drought tolerance<br />
assigned by various authors (e.g. Betula pendula, Fagus silvatica). Thus, ra<strong>the</strong>r than<br />
averag<strong>in</strong>g <strong>the</strong> various assignments, it was decided to use ma<strong>in</strong>ly <strong>the</strong> values given by<br />
Ellenberg (1986) because his data appear to be most accurate:<br />
• Landolt (1977) assigned a low drought tolerance to P<strong>in</strong>us montana, which is<br />
quite frequent <strong>in</strong> <strong>the</strong> dry Swiss National Park, but a high tolerance to Alnus<br />
spp., which is judged to be drought-<strong>in</strong>tolerant by all o<strong>the</strong>r authors.<br />
kNTol


