conceptual model for organic carbon in the central valley and ...
conceptual model for organic carbon in the central valley and ...
conceptual model for organic carbon in the central valley and ...

You also want an ePaper? Increase the reach of your titles
YUMPU automatically turns print PDFs into web optimized ePapers that Google loves.
CONCEPTUAL MODEL FOR<br />
ORGANIC CARBON IN THE CENTRAL VALLEY<br />
AND SACRAMENTO–SAN JOAQUIN DELTA<br />
FINAL REPORT<br />
APRIL 14, 2006<br />
Wet Years<br />
ORGANIC CARBON LOADS (Tons)<br />
Yolo Bypass<br />
39,300<br />
Export to Bay<br />
103,600<br />
5,000 14,800 7,000<br />
Tidal Ag. Pr.<br />
Marsh Prod.<br />
Sacramento River<br />
72,600<br />
Delta Watersheds<br />
13,200<br />
Water<br />
Diversions<br />
27,900<br />
San Joaqu<strong>in</strong> River<br />
30,000<br />
Prepared <strong>for</strong>:<br />
US Environmental Protection Agency,<br />
Region IX<br />
Central Valley Dr<strong>in</strong>k<strong>in</strong>g Water<br />
Policy Workgroup<br />
Prepared by:<br />
Tetra Tech, Inc.<br />
3746 Mt. Diablo Blvd., Suite 300<br />
Lafayette, CA 94549-3681
CONCEPTUAL MODEL FOR<br />
ORGANIC CARBON IN THE CENTRAL VALLEY AND<br />
SACRAMENTO-SAN JOAQUIN DELTA<br />
FINAL REPORT<br />
Prepared <strong>for</strong><br />
US Environmental Protection Agency, Region IX<br />
Central Valley Dr<strong>in</strong>k<strong>in</strong>g Water Policy Workgroup<br />
Prepared by<br />
Sujoy Roy, Ka<strong>the</strong>r<strong>in</strong>e Heidel, Clayton Creager, Chih-fang Chung, Tom Grieb<br />
Tetra Tech, Inc.<br />
3746 Mt. Diablo Blvd., Suite 300<br />
Lafayette, CA 94549-3681<br />
April 14, 2006
Conceptual Model <strong>for</strong> Organic Carbon <strong>in</strong> <strong>the</strong> Central Valley<br />
TABLE OF CONTENTS<br />
Executive Summary....................................................................................................... ES-1<br />
Chapter 1.0 Introduction..............................................................................................1-1<br />
Chapter 2.0 Organic Carbon <strong>in</strong> Aquatic Ecosystems <strong>and</strong> Pathways of Dis<strong>in</strong>fection<br />
Byproduct Formation ................................................................................2-1<br />
2.1 Organic Carbon Cycl<strong>in</strong>g <strong>and</strong> Transport .........................................................2-1<br />
2.2 Organic Carbon Chemistry <strong>and</strong> Dr<strong>in</strong>k<strong>in</strong>g Water Quality ...............................2-6<br />
2.3 Major F<strong>in</strong>d<strong>in</strong>gs ............................................................................................2-10<br />
Chapter 3.0 Overview of Data Used <strong>for</strong> Analysis.........................................................3-1<br />
3.1 Overview of Concentration Data...................................................................3-3<br />
3.2 Additional Data Used..................................................................................3-17<br />
3.2.1 Flow Data................................................................................................3-17<br />
3.2.2 Chemistry Data........................................................................................3-17<br />
3.3 Major F<strong>in</strong>d<strong>in</strong>gs ............................................................................................3-19<br />
Chapter 4.0 Loads Transported From Sacramento <strong>and</strong> San Joaqu<strong>in</strong> River Bas<strong>in</strong>s .........4-1<br />
4.1 Subwatersheds ..............................................................................................4-2<br />
4.2 Water Flows <strong>in</strong> <strong>the</strong> Central Valley .................................................................4-8<br />
4.3 Estimation of Transported Loads <strong>in</strong> Streams .................................................4-12<br />
4.4 Alternate Methods <strong>for</strong> Load Estimation ........................................................4-35<br />
4.5 Estimation of Watershed Loads....................................................................4-38<br />
4.5.1 Estimation of Organic Carbon Export Rates from Non-Po<strong>in</strong>t Sources........4-38<br />
4.5.2 Po<strong>in</strong>t Sources...........................................................................................4-47<br />
4.5.3 Comparison of Watershed <strong>and</strong> Outflow Loads.........................................4-51<br />
4.6 Major F<strong>in</strong>d<strong>in</strong>gs ............................................................................................4-60<br />
Chapter 5.0 Organic Carbon Concentrations <strong>and</strong> Loads <strong>in</strong> <strong>the</strong> Delta...........................5-1<br />
5.1 Delta Inflows <strong>and</strong> Outflows...........................................................................5-2<br />
5.2 Patterns <strong>in</strong> Organic Carbon Concentrations...................................................5-4<br />
5.3 Organic Carbon Loads.................................................................................5-11<br />
5.3.1 Export <strong>in</strong> Water Supply Diversions ..........................................................5-11<br />
April 14, 2006<br />
iii
Conceptual Model <strong>for</strong> Organic Carbon <strong>in</strong> <strong>the</strong> Central Valley<br />
5.3.2 Organic Carbon Sources In <strong>the</strong> Delta.......................................................5-13<br />
5.3.3 Summary of Organic Carbon Loads <strong>in</strong> <strong>the</strong> Delta ......................................5-16<br />
5.4 Relat<strong>in</strong>g Organic Carbon Sources <strong>and</strong> Concentrations at Intakes .................5-18<br />
5.5 Major F<strong>in</strong>d<strong>in</strong>gs ............................................................................................5-22<br />
Chapter 6.0 Major F<strong>in</strong>d<strong>in</strong>gs <strong>and</strong> Recommendations <strong>for</strong> Future Work...........................6-1<br />
6.1 Major F<strong>in</strong>d<strong>in</strong>gs ..............................................................................................6-1<br />
6.2 Uncerta<strong>in</strong>ties <strong>in</strong> Exist<strong>in</strong>g Data <strong>and</strong> Recommendations <strong>for</strong> Future Work .........6-3<br />
6.2.1 Organic Carbon Chemistry <strong>and</strong> Dis<strong>in</strong>fection Byproduct Formation............6-3<br />
6.2.2 TRIBUTARY LOADS..................................................................................6-5<br />
6.2.3 In-Delta Sources ........................................................................................6-5<br />
6.2.4 Export Rates...............................................................................................6-7<br />
6.2.5 Wastewater Treatment Plants.....................................................................6-8<br />
6.2.6 Fish Hatcheries ..........................................................................................6-9<br />
6.2.7 Urban Runoff.............................................................................................6-9<br />
6.3 Future Concerns ............................................................................................6-9<br />
References ..................................................................................................................R-1<br />
Appendix A Summary of Organic Carbon Data<br />
Appendix B Summary of Flow Data<br />
iv April 14, 2006
Conceptual Model <strong>for</strong> Organic Carbon <strong>in</strong> <strong>the</strong> Central Valley<br />
LIST OF TABLES<br />
Table 1-1.<br />
Table 2-1.<br />
Dis<strong>in</strong>fection by-products of human health concern......................................1-2<br />
DOC-related measurements.........................................................................2-8<br />
Table 4-1. Percentage of l<strong>and</strong> use <strong>in</strong> different categories <strong>for</strong> each subwatershed. .........4-6<br />
Table 4-2. Subdivision of watersheds <strong>in</strong> <strong>the</strong> Central Valley, nearby stations with<br />
concentration data <strong>in</strong> <strong>the</strong> Central Valley Dr<strong>in</strong>k<strong>in</strong>g Water Policy<br />
Workgroup database, <strong>and</strong> USGS stations with cont<strong>in</strong>uous flow data ...........4-9<br />
Table 4-3. Loads transported at locations correspond<strong>in</strong>g to <strong>the</strong> outflow po<strong>in</strong>ts of <strong>the</strong><br />
subwatersheds <strong>in</strong> Table 4-1. ......................................................................4-33<br />
Table 4-4. Estimated Loads from this study compared with o<strong>the</strong>r published studies....4-35<br />
Table 4-5. Regression equations from <strong>the</strong> LOADEST program. ...................................4-36<br />
Table 4-6. Calculated loads at Sacramento River at Hood/Greene’s L<strong>and</strong><strong>in</strong>g ..............4-37<br />
Table 4-7. Export rates of <strong>organic</strong> <strong>carbon</strong> from major l<strong>and</strong> uses <strong>in</strong> <strong>the</strong> Central<br />
Valley........................................................................................................4-47<br />
Table 4-8. Wastewater treatment plants <strong>in</strong> <strong>the</strong> Central Valley <strong>and</strong> Delta.....................4-48<br />
Table 4-9. Comparison of upstream load, watershed loads, <strong>and</strong> downstream exports<br />
<strong>for</strong> dry years. .............................................................................................4-55<br />
Table 4-10. Comparison of upstream load, watershed loads, <strong>and</strong> downstream exports<br />
<strong>for</strong> wet years..............................................................................................4-56<br />
Table 6-1. Relative levels of uncerta<strong>in</strong>ty <strong>and</strong> importance of <strong>organic</strong> <strong>carbon</strong> sources<br />
identified <strong>in</strong> <strong>the</strong> Conceptual Model. ............................................................6-4<br />
April 14, 2006<br />
v
Conceptual Model <strong>for</strong> Organic Carbon <strong>in</strong> <strong>the</strong> Central Valley<br />
LIST OF FIGURES<br />
Figure ES-1. Average concentrations of <strong>organic</strong> <strong>carbon</strong> <strong>in</strong> <strong>the</strong> Central Valley <strong>and</strong><br />
Delta. ........................................................................................................ ES-3<br />
Figure ES-2. Watershed <strong>and</strong> outflow loads <strong>for</strong> <strong>the</strong> Central Valley <strong>and</strong> Delta <strong>for</strong> average<br />
dry <strong>and</strong> wet years.. .................................................................................... ES-4<br />
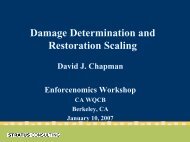
Figure ES-3. The major tributary loads shown <strong>in</strong> Figure ES-2, along with <strong>the</strong> <strong>in</strong>ternal<br />
loads from <strong>in</strong>-Delta sources <strong>and</strong> exports from <strong>the</strong> Delta <strong>in</strong>to San Francisco<br />
Bay <strong>and</strong> <strong>in</strong>to <strong>the</strong> water diversions. ............................................................. ES-5<br />
Figure 2-1. Schematic of <strong>organic</strong> <strong>carbon</strong> cycl<strong>in</strong>g <strong>in</strong> <strong>the</strong> terrestrial environment .............2-2<br />
Figure 2-2. Schematic of <strong>organic</strong> <strong>carbon</strong> cycl<strong>in</strong>g <strong>in</strong> <strong>the</strong> aquatic environment.................2-3<br />
Figure 2-3. Schematic representation of <strong>organic</strong> <strong>carbon</strong> transport <strong>in</strong> <strong>the</strong> Central Valley-<br />
Delta system................................................................................................2-5<br />
Figure 3-1. Stream reaches <strong>and</strong> o<strong>the</strong>r key locations <strong>in</strong> <strong>the</strong> Central Valley <strong>and</strong> Delta. .....3-2<br />
Figure 3-2. Number of TOC data po<strong>in</strong>ts at each station <strong>in</strong> <strong>the</strong> Central Valley Dr<strong>in</strong>k<strong>in</strong>g<br />
Water Policy Workgroup database...............................................................3-4<br />
Figure 3-3. Number of DOC data po<strong>in</strong>ts at each station <strong>in</strong> <strong>the</strong> Central Valley Dr<strong>in</strong>k<strong>in</strong>g<br />
Water Policy Workgroup database...............................................................3-5<br />
Figure 3-4. Number of UVA 254 data po<strong>in</strong>ts at each station <strong>in</strong> <strong>the</strong> Central Valley<br />
Dr<strong>in</strong>k<strong>in</strong>g Water Policy Workgroup database................................................3-6<br />
Figure 3-5. The range of TOC concentrations observed at different stations <strong>in</strong> <strong>the</strong><br />
Central Valley <strong>and</strong> Delta..............................................................................3-7<br />
Figure 3-6. The range of DOC concentrations observed at different stations <strong>in</strong> <strong>the</strong><br />
Central Valley <strong>and</strong> Delta..............................................................................3-8<br />
Figure 3-7. TOC concentrations <strong>in</strong> <strong>the</strong> Central Valley <strong>and</strong> Delta....................................3-9<br />
Figure 3-8. DOC concentrations <strong>in</strong> <strong>the</strong> Central Valley <strong>and</strong> Delta.................................3-10<br />
Figure 3-9. DOC <strong>and</strong> UVA254 at all stations <strong>in</strong> <strong>the</strong> database where<br />
contemporaneous measurements were available. ......................................3-11<br />
Figure 3-10. DOC <strong>and</strong> TOC at all stations <strong>in</strong> <strong>the</strong> database where contemporaneous<br />
measurements were available....................................................................3-12<br />
April 14, 2006<br />
vii
Conceptual Model <strong>for</strong> Organic Carbon <strong>in</strong> <strong>the</strong> Central Valley<br />
Figure 3-11. TOC at various locations <strong>in</strong> Sacramento River. ..........................................3-13<br />
Figure 3-12. TOC at various locations <strong>in</strong> San Joaqu<strong>in</strong> River. ..........................................3-14<br />
Figure 3-13. Temporal variation <strong>in</strong> concentrations at key locations <strong>in</strong> <strong>the</strong> Sacramento<br />
River..........................................................................................................3-15<br />
Figure 3-14. Temporal variation <strong>in</strong> TOC concentrations at key locations <strong>in</strong> San Joaqu<strong>in</strong><br />
River..........................................................................................................3-16<br />
Figure 3-15. Stations with cont<strong>in</strong>uous flow records available through <strong>the</strong> USGS ...........3-18<br />
Figure 4-1. Sub-watersheds associated with pr<strong>in</strong>cipal tributaries....................................4-3<br />
Figure 4-2. L<strong>and</strong> use <strong>in</strong> <strong>the</strong> Central Valley. ....................................................................4-5<br />
Figure 4-3. Average <strong>organic</strong> <strong>carbon</strong> concentrations <strong>in</strong> <strong>the</strong> sub-watersheds.....................4-7<br />
Figure 4-4. Flows <strong>in</strong> <strong>the</strong> dry <strong>and</strong> wet season of 2002 (a dry year) on a schematic<br />
representation of <strong>the</strong> San Joaqu<strong>in</strong>-Sacramento River systems. ....................4-10<br />
Figure 4-5. Flows <strong>in</strong> <strong>the</strong> dry <strong>and</strong> wet season of 2003 (a wet year) on a schematic<br />
representation of <strong>the</strong> San Joaqu<strong>in</strong>-Sacramento River systems. ....................4-11<br />
Figure 4-6. Monthly average concentration, daily discharge, <strong>and</strong> estimated wet <strong>and</strong><br />
dry season loads by water year <strong>for</strong> Sacramento River above Bend Bridge. .4-14<br />
Figure 4-7. Monthly average concentration, daily discharge, <strong>and</strong> estimated wet <strong>and</strong><br />
dry season loads by water year <strong>for</strong> Sacramento River at Colusa. ................4-15<br />
Figure 4-8. Monthly average concentration, daily discharge, <strong>and</strong> estimated wet <strong>and</strong><br />
dry season loads by water year <strong>for</strong> <strong>the</strong> Yuba River. ....................................4-16<br />
Figure 4-9. Monthly average concentration, daily discharge, <strong>and</strong> estimated wet <strong>and</strong><br />
dry season loads by water year <strong>for</strong> <strong>the</strong> Bear River. .....................................4-17<br />
Figure 4-10. Monthly average concentration, daily discharge, <strong>and</strong> estimated wet <strong>and</strong><br />
dry season loads by water year <strong>for</strong> <strong>the</strong> Fea<strong>the</strong>r River..................................4-18<br />
Figure 4-11. Monthly average concentration, daily discharge, <strong>and</strong> estimated wet <strong>and</strong><br />
dry season loads by water year <strong>for</strong> <strong>the</strong> American River. .............................4-19<br />
Figure 4-12. Monthly average concentration, daily discharge, <strong>and</strong> estimated wet <strong>and</strong><br />
dry season loads by water year <strong>for</strong> Sacramento River at Hood/Greene’s<br />
L<strong>and</strong><strong>in</strong>g. ....................................................................................................4-20<br />
Figure 4-13. Monthly average concentration, daily discharge, <strong>and</strong> estimated wet <strong>and</strong><br />
dry season loads by water year <strong>for</strong> Cache Creek. .......................................4-21<br />
Figure 4-14. Monthly average concentration, daily discharge, <strong>and</strong> estimated wet <strong>and</strong><br />
dry season loads by water year <strong>for</strong> San Joaqu<strong>in</strong> River at Sack Dam. ...........4-22<br />
Figure 4-15. Monthly average concentration, daily discharge, <strong>and</strong> estimated wet <strong>and</strong><br />
dry season loads by water year <strong>for</strong> Merced River. ......................................4-23<br />
Figure 4-16. Monthly average concentration, daily discharge, <strong>and</strong> estimated wet <strong>and</strong><br />
dry season loads by water year <strong>for</strong> San Joaqu<strong>in</strong> River near Newman. ........4-24<br />
Figure 4-17. Monthly average concentration, daily discharge, <strong>and</strong> estimated wet <strong>and</strong><br />
dry season loads by water year <strong>for</strong> Tuolumne River...................................4-25<br />
viii April 14, 2006
Conceptual Model <strong>for</strong> Organic Carbon <strong>in</strong> <strong>the</strong> Central Valley<br />
Figure 4-18. Monthly average concentration, daily discharge, <strong>and</strong> estimated wet <strong>and</strong><br />
dry season loads by water year <strong>for</strong> Stanislaus River....................................4-26<br />
Figure 4-19. Monthly average concentration, daily discharge, <strong>and</strong> estimated wet <strong>and</strong><br />
dry season loads by water year <strong>for</strong> San Joaqu<strong>in</strong> River at Vernalis. ..............4-27<br />
Figure 4-20. Monthly average concentration, daily discharge, <strong>and</strong> estimated wet <strong>and</strong><br />
dry season loads by water year <strong>for</strong> Cosumnes River...................................4-28<br />
Figure 4-21. Monthly average concentration, daily discharge, <strong>and</strong> estimated wet <strong>and</strong><br />
dry season loads by water year <strong>for</strong> Mokelumne River. ...............................4-29<br />
Figure 4-22. Monthly average concentration, daily discharge, <strong>and</strong> estimated wet <strong>and</strong><br />
dry season loads by water year <strong>for</strong> <strong>the</strong> Yolo Bypass. ..................................4-30<br />
Figure 4-23. Monthly average concentration, daily discharge, <strong>and</strong> estimated wet <strong>and</strong><br />
dry season loads by water year <strong>for</strong> Delta outflows. ....................................4-31<br />
Figure 4-24. Organic <strong>carbon</strong> loads <strong>for</strong> <strong>the</strong> dry <strong>and</strong> wet season of an average wet year<br />
on a schematic representation of <strong>the</strong> San Joaqu<strong>in</strong>-Sacramento River<br />
systems......................................................................................................4-34<br />
Figure 4-25. Export rates from specific l<strong>and</strong> uses, weighted by <strong>the</strong> area of that l<strong>and</strong> use<br />
<strong>in</strong> a watershed,. .........................................................................................4-39<br />
Figure 4-26. Monthly average concentration, daily discharge, <strong>and</strong> estimated wet <strong>and</strong><br />
dry season loads by water year <strong>for</strong> <strong>the</strong> Colusa Bas<strong>in</strong> Dra<strong>in</strong>. .......................4-40<br />
Figure 4-27. Monthly average concentration, daily discharge, <strong>and</strong> estimated wet <strong>and</strong><br />
dry season loads by water year <strong>for</strong> <strong>the</strong> Hard<strong>in</strong>g Dra<strong>in</strong>................................4-41<br />
Figure 4-28. Monthly average concentration, daily discharge, <strong>and</strong> estimated wet <strong>and</strong><br />
dry season loads by water year <strong>for</strong> <strong>the</strong> Mud Slough. ..................................4-42<br />
Figure 4-29. Monthly average concentration, daily discharge, <strong>and</strong> estimated wet <strong>and</strong><br />
dry season loads by water year <strong>for</strong> <strong>the</strong> Salt Slough.....................................4-43<br />
Figure 4-30. Monthly average concentration, daily discharge, <strong>and</strong> estimated wet <strong>and</strong><br />
dry season loads by water year <strong>for</strong> Arcade Creek,......................................4-45<br />
Figure 4-31. Urban runoff <strong>organic</strong> <strong>carbon</strong> concentration data from Sacramento,<br />
Stockton, <strong>and</strong> <strong>the</strong> Natomas East Ma<strong>in</strong> Dra<strong>in</strong>age Canal (NEMDC)...............4-46<br />
Figure 4-32. Po<strong>in</strong>t source discharge locations <strong>in</strong> <strong>the</strong> database developed by Central<br />
Valley Dr<strong>in</strong>k<strong>in</strong>g Water Policy Workgroup.................................................. 4-49<br />
Figure 4-33. Organic <strong>carbon</strong> concentration <strong>and</strong> flow data <strong>for</strong> Davis, Sacramento, <strong>and</strong><br />
Vacaville. ..................................................................................................4-50<br />
Figure 4-34. Seasonal patterns <strong>in</strong> wastewater effluent concentrations at Vacaville <strong>and</strong><br />
Sacramento Regional Wastewater Treatment Plant. ...................................4-51<br />
Figure 4-35. The relationship between upstream loads, watershed loads<br />
correspond<strong>in</strong>g to a stream reach, <strong>and</strong> downstream exported loads. ...........4-52<br />
Figure 4-36. Distribution of <strong>organic</strong> <strong>carbon</strong> watershed loads by source, <strong>and</strong> loads<br />
flow<strong>in</strong>g out of stream locations are compared with <strong>the</strong> loads orig<strong>in</strong>at<strong>in</strong>g<br />
from <strong>the</strong>ir watersheds <strong>for</strong> dry years...........................................................4-53<br />
April 14, 2006<br />
ix
Conceptual Model <strong>for</strong> Organic Carbon <strong>in</strong> <strong>the</strong> Central Valley<br />
Figure 4-37. Distribution of <strong>organic</strong> <strong>carbon</strong> watershed loads by source, <strong>and</strong> loads<br />
flow<strong>in</strong>g out of stream locations are compared with <strong>the</strong> loads orig<strong>in</strong>at<strong>in</strong>g<br />
from <strong>the</strong>ir watersheds <strong>for</strong> wet years. ..........................................................4-54<br />
Figure 4-38. Distribution of <strong>organic</strong> <strong>carbon</strong> watershed loads by source <strong>for</strong> <strong>the</strong><br />
Sacramento <strong>and</strong> San Joaqu<strong>in</strong> Rivers. ..........................................................4-57<br />
Figure 4-39. Watershed <strong>and</strong> outflow loads <strong>for</strong> <strong>the</strong> Central Valley <strong>and</strong> Delta <strong>for</strong><br />
average dry years.......................................................................................4-58<br />
Figure 4-40. Watershed <strong>and</strong> outflow loads <strong>for</strong> <strong>the</strong> Central Valley <strong>and</strong> Delta <strong>for</strong><br />
average wet years. .....................................................................................4-59<br />
Figure 5-1. Delta locations with daily flow data reported <strong>in</strong> <strong>the</strong> DAYFLOW <strong>model</strong>. ......5-3<br />
Figure 5-2. Annual water supply diversions (Banks Pump<strong>in</strong>g Plant (SWP), Tracy<br />
Pump<strong>in</strong>g Plant (CVP), Contra Costa Water District’s Rock Slough <strong>and</strong> Old<br />
River pump<strong>in</strong>g plants (CCC), <strong>and</strong> <strong>the</strong> North Bay Aqueduct’s Barker Slough<br />
Pump<strong>in</strong>g Plant (NBAQ) as reported <strong>in</strong> <strong>the</strong> DAYFLOW <strong>model</strong>......................5-3<br />
Figure 5-3. The sum of project diversions as a percentage of annual flows from <strong>the</strong><br />
major tributaries (Sacramento <strong>and</strong> San Joaqu<strong>in</strong> Rivers) to <strong>the</strong> Delta. ............5-4<br />
Figure 5-4. Relationship between dissolved <strong>and</strong> total <strong>organic</strong> <strong>carbon</strong> concentrations at<br />
key Delta locations......................................................................................5-5<br />
Figure 5-5. Dissolved <strong>organic</strong> <strong>carbon</strong> concentrations <strong>and</strong> UVA at 254 nm at key Delta<br />
locations......................................................................................................5-6<br />
Figure 5-6. SUVA254 values (UVA normalized by <strong>the</strong> concentration of <strong>organic</strong><br />
<strong>carbon</strong>) at Sacramento River (Hood), San Joaqu<strong>in</strong> River (Vernalis) <strong>and</strong><br />
Banks Pump<strong>in</strong>g Plant...................................................................................5-7<br />
Figure 5-7. DOC concentrations at Sacramento River (Hood), San Joaqu<strong>in</strong> River<br />
(Vernalis) <strong>and</strong> Banks Pump<strong>in</strong>g Plant. ...........................................................5-8<br />
Figure 5-8. Correlation between DOC at <strong>the</strong> tributaries <strong>and</strong> DOC at Banks Pump<strong>in</strong>g<br />
Plant............................................................................................................5-9<br />
Figure 5-9. Real-time TOC data compared with grab sample data at Sacramento<br />
River (Hood) <strong>and</strong> Banks Pump<strong>in</strong>g Plant. ....................................................5-10<br />
Figure 5-10. Organic <strong>carbon</strong> concentrations at water supply diversions. .......................5-12<br />
Figure 5-11. Annual <strong>organic</strong> <strong>carbon</strong> exports over <strong>the</strong> water years 1984-2004................5-13<br />
Figure 5-12. DOC concentrations <strong>in</strong> Delta agricultural dra<strong>in</strong>age. ..................................5-15<br />
Figure 5-13. Seasonal variation <strong>in</strong> Delta agricultural dra<strong>in</strong>age DOC concentrations. .....5-15<br />
Figure 5-14. DICU estimates of flow <strong>for</strong> each month coupled with mean monthly<br />
concentration data observed at all isl<strong>and</strong> dra<strong>in</strong>s from Figure 5-13..............5-16<br />
Figure 5-15. The tributary loads calculated <strong>in</strong> Chapter 4................................................5-17<br />
Figure 5-16. Long-term percentage contribution of flows at <strong>the</strong> Banks Pump<strong>in</strong>g Plant ...5-19<br />
Figure 5-17. Percentage contribution of flows at <strong>the</strong> Banks Pump<strong>in</strong>g Plant....................5-20<br />
Figure 5-18. Contribution of DOC by source at <strong>the</strong> Banks Pump<strong>in</strong>g Plant .....................5-20<br />
x April 14, 2006
Conceptual Model <strong>for</strong> Organic Carbon <strong>in</strong> <strong>the</strong> Central Valley<br />
Figure 5-19. Banks <strong>in</strong>take DOC concentrations <strong>for</strong> wet <strong>and</strong> dry years <strong>for</strong> base case<br />
conditions <strong>and</strong> <strong>for</strong> a hypo<strong>the</strong>tical case of no Delta Isl<strong>and</strong> dra<strong>in</strong><br />
contribution...............................................................................................5-21<br />
April 14, 2006<br />
xi
Conceptual Model <strong>for</strong> Organic Carbon <strong>in</strong> <strong>the</strong> Central Valley<br />
LIST OF ACRONYMS & ABBREVIATIONS<br />
CDF FRAP<br />
cfs<br />
CVDWPWG<br />
DICU<br />
DOC<br />
DSM2<br />
DFG<br />
DWR<br />
EPA<br />
GIS<br />
HAA<br />
IESWTR<br />
LT2ESWTR<br />
MCL<br />
mg/l<br />
MGD<br />
MWQI<br />
NEMDC<br />
POC<br />
THM<br />
THMFP<br />
TOC<br />
USGS<br />
UVA254<br />
WY<br />
Cali<strong>for</strong>nia Department of Forestry <strong>and</strong> Fire Protection Fire <strong>and</strong> Resource<br />
Assessment Program<br />
Cubic feet per second<br />
Central Valley Dr<strong>in</strong>k<strong>in</strong>g Water Policy Workgroup<br />
Delta Isl<strong>and</strong> Consumptive Use<br />
Dissolved <strong>organic</strong> <strong>carbon</strong><br />
Delta Simulation Model, Version II<br />
Department of Fish <strong>and</strong> Game<br />
Department of Water Resources<br />
Environmental Protection Agency<br />
Geographic In<strong>for</strong>mation System<br />
Haloacetic acid<br />
Interim Enhanced Surface Water Treatment Rule<br />
Long Term 2 Enhanced Surface Water Treatment Rule<br />
Maximum contam<strong>in</strong>ant level<br />
Milligrams per liter<br />
Million gallons per day<br />
Municipal Water Quality Investigations<br />
Natomas East Ma<strong>in</strong> Dra<strong>in</strong>age Canal<br />
Particulate <strong>organic</strong> <strong>carbon</strong><br />
Trihalomethane<br />
Trihalomethane <strong>for</strong>mation potential<br />
Total <strong>organic</strong> <strong>carbon</strong><br />
United States Geological Survey<br />
UV absorbance at 254 nm<br />
Water year<br />
April 14, 2006<br />
xiii
EXECUTIVE SUMMARY<br />
This report presents a <strong>conceptual</strong> <strong>model</strong> of <strong>organic</strong> <strong>carbon</strong> <strong>for</strong> <strong>the</strong> Central Valley <strong>and</strong><br />
<strong>the</strong> Sacramento-San Joaqu<strong>in</strong> Delta. The <strong>conceptual</strong> <strong>model</strong> was based on previously<br />
collected data from a variety of sources <strong>and</strong> can be used to direct future <strong>in</strong>vestigations<br />
to improve underst<strong>and</strong><strong>in</strong>g of <strong>organic</strong> <strong>carbon</strong>-related sources, trans<strong>for</strong>mations,<br />
impacts, <strong>and</strong> management.<br />
Organic <strong>carbon</strong> <strong>in</strong> <strong>the</strong> dissolved <strong>for</strong>m (DOC) is <strong>the</strong> <strong>for</strong>m considered to be more likely<br />
to react dur<strong>in</strong>g chlor<strong>in</strong>ation <strong>and</strong> <strong>for</strong>m dis<strong>in</strong>fectant byproduct compounds. DOC is<br />
generally less bioavailable to <strong>the</strong> base of <strong>the</strong> web compared with particulate <strong>organic</strong><br />
<strong>carbon</strong> <strong>and</strong>/or <strong>organic</strong> <strong>carbon</strong> freshly derived from primary production. Thus, early<br />
data suggest that ef<strong>for</strong>ts <strong>in</strong> <strong>the</strong> Central Valley <strong>and</strong> Delta to control or manage DOC<br />
levels <strong>for</strong> dr<strong>in</strong>k<strong>in</strong>g water quality are less likely to have direct adverse effects on <strong>the</strong><br />
food web, although this is a subject that needs to be studied fur<strong>the</strong>r. There is general<br />
agreement <strong>in</strong> <strong>the</strong> literature that THM <strong>for</strong>mation is correlated to TOC concentrations,<br />
although <strong>the</strong> relationship is more complex when specific structural characteristics of<br />
DOC are compared with THM <strong>for</strong>mation potential. A commonly used measure of<br />
DOC aromaticity, specific ultraviolet absorbance (SUVA) at 254 nm, was found to be<br />
poorly correlated to THM <strong>for</strong>mation <strong>in</strong> Delta waters. Characterization of <strong>organic</strong><br />
matter through sophisticated analytical tools such as stable isotope signatures <strong>and</strong><br />
NMR-spectroscopy is an active area of research; published <strong>in</strong><strong>for</strong>mation that was<br />
available at this time, however, is limited to a small number of locations near <strong>the</strong><br />
Delta, <strong>and</strong> with limited temporal resolution. The data are <strong>in</strong>dicative of a contribution<br />
due to <strong>in</strong>-Delta primary production, although <strong>the</strong> variability of this contribution as a<br />
function of time is not known. There is limited knowledge on <strong>the</strong> relative propensity<br />
of different sources to <strong>for</strong>m THMs, although it appears that Delta isl<strong>and</strong> dra<strong>in</strong>age is<br />
somewhat less reactive than tributary sources.<br />
Organic <strong>carbon</strong> concentrations across <strong>the</strong> Central Valley were estimated by averag<strong>in</strong>g<br />
time series data at many sampl<strong>in</strong>g locations <strong>and</strong> are represented schematically <strong>in</strong><br />
Figure ES-1. In general, most of <strong>the</strong> <strong>organic</strong> <strong>carbon</strong> is present <strong>in</strong> <strong>the</strong> dissolved <strong>for</strong>m.<br />
The data show substantially higher concentrations <strong>in</strong> <strong>the</strong> San Joaqu<strong>in</strong> River bas<strong>in</strong><br />
April 14, 2006<br />
ES-1
Executive Summary<br />
Conceptual Model <strong>for</strong> Organic Carbon <strong>in</strong> <strong>the</strong> Central Valley<br />
compared with <strong>the</strong> Sacramento River bas<strong>in</strong>, especially <strong>in</strong> <strong>the</strong> upper reaches of <strong>the</strong><br />
Sacramento River bas<strong>in</strong>. Across seasons, <strong>the</strong> San Joaqu<strong>in</strong> <strong>and</strong> Sacramento River<br />
concentrations exhibit contrast<strong>in</strong>g behavior: <strong>in</strong> <strong>the</strong> Sacramento River, <strong>the</strong> highest<br />
concentrations are observed <strong>in</strong> <strong>the</strong> wet months, whereas <strong>in</strong> <strong>the</strong> San Joaqu<strong>in</strong> River, <strong>the</strong><br />
highest concentrations are observed <strong>in</strong> <strong>the</strong> dry months. The latter is a consequence of<br />
<strong>the</strong> significant contribution of agricultural dra<strong>in</strong>age to total flows <strong>in</strong> <strong>the</strong> San Joaqu<strong>in</strong><br />
River <strong>in</strong> <strong>the</strong> dry season.<br />
Organic <strong>carbon</strong> loads at various locations were estimated us<strong>in</strong>g historical monthly<br />
average flow data <strong>and</strong> average monthly concentrations of <strong>organic</strong> <strong>carbon</strong> at different<br />
stations (Figure ES-2). Tributary loads were found to vary significantly between wet<br />
<strong>and</strong> dry years, with loads from <strong>the</strong> Sacramento River Bas<strong>in</strong> exceed<strong>in</strong>g <strong>the</strong> San<br />
Joaqu<strong>in</strong> River loads by a factor of two. Current estimates <strong>for</strong> <strong>in</strong>-Delta contribution of<br />
<strong>organic</strong> <strong>carbon</strong> show that annual loads of <strong>organic</strong> <strong>carbon</strong> from <strong>the</strong> tributaries are<br />
substantially greater than <strong>the</strong> best estimates of <strong>in</strong>-Delta production. However, <strong>in</strong> dry<br />
years <strong>the</strong>se may be a significant fraction of <strong>the</strong> total loads. The <strong>organic</strong> <strong>carbon</strong> export<br />
<strong>in</strong> aqueducts is relatively uni<strong>for</strong>m from year to year, particularly when compared with<br />
<strong>the</strong> tributary loads. The export of <strong>organic</strong> <strong>carbon</strong> <strong>in</strong> <strong>the</strong> aqueducts is slightly larger<br />
than <strong>the</strong> average <strong>in</strong>ternal Delta production (Figure ES-3).<br />
The loads transported <strong>in</strong> streams were compared to <strong>the</strong> <strong>organic</strong> <strong>carbon</strong> export rates<br />
from different l<strong>and</strong> uses. Export rates of <strong>organic</strong> <strong>carbon</strong> (mass of <strong>carbon</strong> exported per<br />
unit area per year) were computed <strong>for</strong> key l<strong>and</strong> uses: urban l<strong>and</strong>, agricultural l<strong>and</strong>,<br />
wetl<strong>and</strong>s, <strong>and</strong> natural areas (<strong>in</strong>clud<strong>in</strong>g <strong>for</strong>ests, shrubl<strong>and</strong>, <strong>and</strong> rangel<strong>and</strong>). The<br />
calculated total watershed exports matched well with <strong>the</strong> stream loads at key locations<br />
(such as Sacramento River at Hood/Greene’s L<strong>and</strong><strong>in</strong>g <strong>and</strong> San Joaqu<strong>in</strong> River at<br />
Vernalis) although not at all locations considered. Theses differences highlight <strong>the</strong><br />
need <strong>for</strong> greater data collection, both to characterize stream loads <strong>and</strong> to quantify<br />
terrestrial export rates <strong>in</strong> selected watersheds. Export rates, as currently<br />
approximated, could be improved through focused flow <strong>and</strong> concentration data<br />
collection <strong>in</strong> small, relatively homogenous watersheds.<br />
ES-2 April 14, 2006
Conceptual Model <strong>for</strong> Organic Carbon <strong>in</strong> <strong>the</strong> Central Valley<br />
Executive Summary<br />
Figure ES-1.<br />
Average concentrations of <strong>organic</strong> <strong>carbon</strong> (mostly as TOC except where <strong>in</strong>dicated) <strong>in</strong> <strong>the</strong><br />
Central Valley <strong>and</strong> Delta.<br />
April 14, 2006<br />
ES-3
Executive Summary Conceptual Model <strong>for</strong> Organic Carbon <strong>in</strong> <strong>the</strong> Central Valley<br />
Figure ES-2. Watershed <strong>and</strong> outflow loads <strong>for</strong> <strong>the</strong> Central Valley <strong>and</strong> Delta <strong>for</strong> average dry <strong>and</strong> wet years. Arrow thicknesses are proportional to<br />
stream loads; bars on <strong>the</strong> boxes are proportional to <strong>the</strong> load<strong>in</strong>g from watershed sources.<br />
ES-4 April 14, 2006
Conceptual Model <strong>for</strong> Organic Carbon <strong>in</strong> <strong>the</strong> Central Valley<br />
Executive Summary<br />
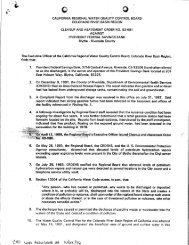
Figure ES-3.<br />
The major tributary loads shown <strong>in</strong> Figure ES-2, along with <strong>the</strong> <strong>in</strong>ternal loads from <strong>in</strong>-Delta<br />
sources <strong>and</strong> exports from <strong>the</strong> Delta <strong>in</strong>to San Francisco Bay <strong>and</strong> <strong>in</strong>to <strong>the</strong> water diversions.<br />
The concentrations at <strong>the</strong> Banks Pump<strong>in</strong>g Plant, <strong>and</strong> at o<strong>the</strong>r diversions <strong>in</strong> <strong>the</strong> Delta,<br />
are due to a complex mixture of <strong>the</strong> Sacramento River, <strong>the</strong> San Joaqu<strong>in</strong> River, <strong>and</strong> <strong>in</strong>-<br />
Delta sources. The contribution of various sources to <strong>organic</strong> <strong>carbon</strong> concentrations<br />
at <strong>the</strong> <strong>in</strong>takes is best estimated through <strong>model</strong><strong>in</strong>g. Cali<strong>for</strong>nia Department of Water<br />
Resources’ Delta Simulation Model (DSM2) was found to be <strong>the</strong> best tool <strong>for</strong> this<br />
task. This <strong>model</strong> is well calibrated <strong>and</strong> widely used <strong>for</strong> water flow <strong>and</strong> water quality<br />
applications throughout <strong>the</strong> Delta. The <strong>model</strong> is rout<strong>in</strong>ely used by DWR staff to<br />
April 14, 2006<br />
ES-5
Executive Summary<br />
Conceptual Model <strong>for</strong> Organic Carbon <strong>in</strong> <strong>the</strong> Central Valley<br />
evaluate <strong>the</strong> effect of specific scenarios on concentrations at various <strong>in</strong>takes. Ongo<strong>in</strong>g<br />
work, termed f<strong>in</strong>gerpr<strong>in</strong>t<strong>in</strong>g, <strong>for</strong> example, shows <strong>the</strong> contribution of different sources<br />
to water volume <strong>and</strong> DOC concentrations at key <strong>in</strong>takes over time. A similar<br />
mechanistic <strong>model</strong> of <strong>the</strong> tributaries may need to be developed if impacts at stations<br />
outside <strong>the</strong> Delta need to be studied.<br />
The <strong>conceptual</strong> <strong>model</strong> also identified data gaps <strong>and</strong> recommended improved<br />
catalog<strong>in</strong>g of data from exist<strong>in</strong>g monitor<strong>in</strong>g <strong>and</strong> research projects <strong>and</strong> additional field<br />
data collection. The broad areas where data collection is recommended <strong>in</strong>cludes<br />
characterization of export rates from different l<strong>and</strong> uses, improved representation of<br />
agricultural dra<strong>in</strong>s, <strong>the</strong> contribution of Delta Isl<strong>and</strong> dra<strong>in</strong>age <strong>and</strong> tidal marshes,<br />
quantification of reservoir exports of <strong>organic</strong> <strong>carbon</strong>, <strong>and</strong> improved quantification of<br />
wastewater sources. Recommendations <strong>for</strong> data collection were provided here as<br />
suggestions; <strong>the</strong> actual extent of additional data to be collected will depend on<br />
available time <strong>and</strong> resources.<br />
Look<strong>in</strong>g to <strong>the</strong> future, it appears that gradual changes <strong>in</strong> potential <strong>organic</strong> <strong>carbon</strong><br />
sources (<strong>in</strong>creased urban l<strong>and</strong> <strong>and</strong>/or <strong>in</strong>creased wastewater sources) are unlikely to be<br />
as large as <strong>the</strong> natural year-to-year variability <strong>in</strong> loads currently exhibited <strong>in</strong> <strong>the</strong><br />
Delta. However, <strong>the</strong> role of anthropogenic <strong>organic</strong> <strong>carbon</strong> sources <strong>and</strong> <strong>the</strong> ecological<br />
impacts of substantial water withdrawals from <strong>the</strong> Delta, can all become highly<br />
significant dur<strong>in</strong>g dry <strong>and</strong> critically dry years. Consideration of such extreme<br />
conditions should be a focus of future <strong>model</strong><strong>in</strong>g work. In addition to <strong>the</strong> processes<br />
dur<strong>in</strong>g dry years, future study of <strong>organic</strong> <strong>carbon</strong> should consider o<strong>the</strong>r factors. These<br />
<strong>in</strong>clude potential changes <strong>in</strong> Delta tidal marsh area due to restoration, changes <strong>in</strong> <strong>the</strong><br />
regulations with lower st<strong>and</strong>ards <strong>for</strong> exist<strong>in</strong>g dis<strong>in</strong>fection byproducts, or <strong>the</strong> addition<br />
of new compounds to <strong>the</strong> regulations, <strong>and</strong> <strong>the</strong> likelihood of catastrophic events such<br />
as levee failures.<br />
ES-6 April 14, 2006
CHAPTER 1.0<br />
INTRODUCTION<br />
The Central Valley, compris<strong>in</strong>g <strong>the</strong> Sacramento <strong>and</strong> San Joaqu<strong>in</strong> River watersheds, is<br />
a vital source of dr<strong>in</strong>k<strong>in</strong>g water <strong>in</strong> Cali<strong>for</strong>nia. Many Central Valley communities rely<br />
on water from <strong>the</strong> Sacramento <strong>and</strong> San Joaqu<strong>in</strong> rivers or <strong>the</strong>ir tributaries. The<br />
Sacramento-San Joaqu<strong>in</strong> Delta (hereafter referred to as <strong>the</strong> Delta) provides source<br />
water to more than 23 million people <strong>in</strong> <strong>the</strong> Sou<strong>the</strong>rn Cali<strong>for</strong>nia, Central Coast, <strong>and</strong><br />
San Francisco Bay regions (CALFED Water Quality Program Plan, 2000). The<br />
tributaries of <strong>the</strong> Sacramento <strong>and</strong> San Joaqu<strong>in</strong> rivers that orig<strong>in</strong>ate <strong>in</strong> <strong>the</strong> Cascade<br />
Range <strong>and</strong> Sierra Nevada Mounta<strong>in</strong>s generally have high quality water; however, as<br />
<strong>the</strong> tributaries flow <strong>in</strong>to lower elevations, <strong>the</strong>y are affected by flows from urban,<br />
<strong>in</strong>dustrial, agricultural, <strong>and</strong> natural l<strong>and</strong> uses as well as a highly managed water<br />
supply system.<br />
The Central Valley Dr<strong>in</strong>k<strong>in</strong>g Water Policy Workgroup is work<strong>in</strong>g with <strong>the</strong> Central<br />
Valley Regional Water Quality Control Board (Regional Board) to conduct <strong>the</strong><br />
technical studies needed to develop a policy that will provide greater protection to<br />
dr<strong>in</strong>k<strong>in</strong>g water supplies <strong>in</strong> <strong>the</strong> Central Valley. The policy is <strong>in</strong>itially focused on five<br />
categories of constituents: <strong>organic</strong> <strong>carbon</strong>, nutrients (nitrogen <strong>and</strong> phosphorus),<br />
sal<strong>in</strong>ity, bromide, <strong>and</strong> pathogens <strong>and</strong> <strong>in</strong>dicator organisms. This <strong>conceptual</strong> <strong>model</strong><br />
report is focused on <strong>organic</strong> <strong>carbon</strong>.<br />
For more than two decades <strong>organic</strong> <strong>carbon</strong> <strong>in</strong> source waters has been identified as a<br />
constituent of concern, <strong>in</strong> <strong>the</strong> Delta <strong>and</strong> elsewhere, primarily due to <strong>the</strong> <strong>for</strong>mation of<br />
carc<strong>in</strong>ogenic byproducts dur<strong>in</strong>g dis<strong>in</strong>fection at water treatment facilities. Dr<strong>in</strong>k<strong>in</strong>g<br />
water is dis<strong>in</strong>fected with chlor<strong>in</strong>e or o<strong>the</strong>r chemicals to meet regulatory requirements<br />
to <strong>in</strong>activate pathogens that may be present <strong>in</strong> <strong>the</strong> source water. Organic <strong>carbon</strong>, like<br />
several of <strong>the</strong> o<strong>the</strong>r identified constituents of concern, may orig<strong>in</strong>ate from both<br />
natural <strong>and</strong> anthropogenic (human) sources, <strong>and</strong> <strong>the</strong> levels of <strong>organic</strong> <strong>carbon</strong> may<br />
play a beneficial role <strong>in</strong> ecosystem function.<br />
April 14, 2006 1-1
Chapter 1.0<br />
Conceptual Model <strong>for</strong> Organic Carbon <strong>in</strong> <strong>the</strong> Central Valley<br />
A wide variety of chemical compounds are <strong>for</strong>med dur<strong>in</strong>g <strong>the</strong> dis<strong>in</strong>fection of source<br />
waters with chlor<strong>in</strong>e <strong>in</strong> <strong>the</strong> presence of <strong>organic</strong> <strong>carbon</strong> <strong>and</strong> bromide. Of <strong>the</strong> many<br />
dozen dis<strong>in</strong>fection byproduct compounds that have been detected (Cohn et al., 1999),<br />
trihalomethanes (THMs) <strong>and</strong> several haloacetic acids (HAAs) are currently regulated<br />
by <strong>the</strong> US EPA as part of <strong>the</strong> Stage 1 <strong>and</strong> Stage 2 Dis<strong>in</strong>fectants <strong>and</strong> Dis<strong>in</strong>fection<br />
Byproducts Rule (US EPA, 1998). These rules, <strong>in</strong> conjunction with <strong>the</strong> Interim<br />
Enhanced Surface Water Treatment Rule (IESWTR) <strong>and</strong> <strong>the</strong> Long Term 2 Enhanced<br />
Surface Water Treatment Rule (LT2ESWTR), are <strong>in</strong>tended to provide protection<br />
from microbial pathogens while m<strong>in</strong>imiz<strong>in</strong>g <strong>the</strong> human health risk due to dis<strong>in</strong>fection<br />
byproducts. Table 1-1 lists <strong>the</strong> regulated THMs, <strong>the</strong> total concentrations of which<br />
cannot exceed 0.08 mg/l, <strong>and</strong> <strong>the</strong> five regulated HAAs (also abbreviated as HAA5),<br />
<strong>the</strong> total concentrations of which cannot exceed 0.06 mg/l (US EPA, 2001).<br />
Approximately 50% of <strong>the</strong> dis<strong>in</strong>fection byproduct compounds <strong>in</strong> f<strong>in</strong>ished dr<strong>in</strong>k<strong>in</strong>g<br />
water are unidentified (US EPA, 2003). The list of detected dis<strong>in</strong>fection byproducts<br />
<strong>and</strong> knowledge of <strong>the</strong>ir human health impacts cont<strong>in</strong>ues to grow, <strong>and</strong> it is conceivable<br />
that <strong>in</strong> future years <strong>the</strong> total allowable THM <strong>and</strong> HAA5 concentrations may decrease<br />
<strong>and</strong> <strong>the</strong> number of regulated compounds may <strong>in</strong>crease.<br />
Table 1-1.<br />
Dis<strong>in</strong>fection by-products of human health concern.<br />
Trihalomethanes (Current EPA st<strong>and</strong>ard*: 0.08 mg/l):<br />
Chloro<strong>for</strong>m<br />
Bromodichloromethane<br />
Dibromochloromethane<br />
Bromo<strong>for</strong>m<br />
CHCl3<br />
CHCl2Br<br />
CHClBr2<br />
CHBr3<br />
Haloacetic acids (HAA5) (Current EPA st<strong>and</strong>ard*: 0.060 mg/l):<br />
Dibromoacetic acid<br />
Dichlororoacetic acid<br />
Monobromoacetic acid<br />
Monochloroacetic acid<br />
Trichloroacetic acid<br />
CHBr2CO2H<br />
CHCl2CO2H<br />
CH2BrCO2H<br />
CH2ClCO2H<br />
CCl3CO2H<br />
Bromate (BrO3-); MCL = 0.010 mg/l<br />
Chorite (ClO2-); MCL = 1.0 mg/l<br />
* 1998 Stage 1 Dis<strong>in</strong>fectants <strong>and</strong> Dis<strong>in</strong>fection Byproducts F<strong>in</strong>al Rule; 2005 Stage 2 Dis<strong>in</strong>fectants <strong>and</strong><br />
Dis<strong>in</strong>fection Byproducts F<strong>in</strong>al Rule<br />
A number of water suppliers that rely on <strong>the</strong> Delta as a source of dr<strong>in</strong>k<strong>in</strong>g water have<br />
modified <strong>the</strong>ir treatment processes <strong>and</strong> are us<strong>in</strong>g ozone as <strong>the</strong> primary dis<strong>in</strong>fectant to<br />
avoid <strong>the</strong> <strong>for</strong>mation of trihalomethanes <strong>and</strong> haloacetic acids. However, <strong>organic</strong><br />
<strong>carbon</strong> <strong>in</strong> <strong>the</strong> source water still impacts facilities us<strong>in</strong>g ozone because <strong>in</strong>creased TOC<br />
<strong>in</strong>creases <strong>the</strong> required ozone dosage. Higher levels of ozone <strong>in</strong> <strong>the</strong> presence of<br />
bromide can <strong>in</strong>crease bromate concentrations. Dr<strong>in</strong>k<strong>in</strong>g water suppliers that treat<br />
1-2 April 14, 2006
Conceptual Model <strong>for</strong> Organic Carbon <strong>in</strong> <strong>the</strong> Central Valley Chapter 1.0<br />
Delta water with ozone already must take steps to ensure that bromate levels do not<br />
exceed <strong>the</strong> Maximum Contam<strong>in</strong>ant Level (MCL) of 0.01 mg/l.<br />
To protect <strong>the</strong> quality of Delta source waters, CALFED has proposed a total <strong>organic</strong><br />
<strong>carbon</strong> target of 3 mg/l or an equivalent level of public health protection us<strong>in</strong>g a costeffective<br />
comb<strong>in</strong>ation of alternative source waters, source controls, <strong>and</strong> treatment<br />
technologies. In recent years, water at <strong>the</strong> Delta pump<strong>in</strong>g plants has often exceeded<br />
this concentration target, particularly dur<strong>in</strong>g <strong>the</strong> wet season (Department of Water<br />
Resources, 2005).<br />
Although <strong>organic</strong> <strong>carbon</strong> is referred to as a s<strong>in</strong>gle constituent, it is well known that it<br />
is comprised of a wide variety of chemical compounds, with numerous structural<br />
<strong>for</strong>ms, <strong>and</strong> a range of reactivity, solubility, <strong>and</strong> molecular weights (Thurman, 1985).<br />
Inferr<strong>in</strong>g <strong>the</strong>se details about an aquatic <strong>organic</strong> <strong>carbon</strong> sample is not straight<strong>for</strong>ward,<br />
but studies have documented <strong>the</strong> importance of <strong>organic</strong> <strong>carbon</strong> quality <strong>in</strong> <strong>in</strong>fluenc<strong>in</strong>g<br />
<strong>the</strong> quantity of THMs that are <strong>for</strong>med dur<strong>in</strong>g chlor<strong>in</strong>e dis<strong>in</strong>fection. Un<strong>for</strong>tunately,<br />
<strong>the</strong>re is not sufficient <strong>in</strong><strong>for</strong>mation about <strong>the</strong> quality or characteristics of <strong>organic</strong><br />
<strong>carbon</strong> from many sources <strong>in</strong> <strong>the</strong> Central Valley. This report is <strong>the</strong>re<strong>for</strong>e focused on<br />
total <strong>organic</strong> <strong>carbon</strong>.<br />
This report presents a <strong>conceptual</strong> <strong>model</strong> of <strong>organic</strong> <strong>carbon</strong> that summarizes current<br />
knowledge of <strong>the</strong> sources, trans<strong>for</strong>mation processes, <strong>and</strong> transport of <strong>organic</strong> <strong>carbon</strong><br />
<strong>in</strong> <strong>the</strong> waters of <strong>the</strong> Central Valley <strong>and</strong> Delta. There have been previous descriptions<br />
of <strong>conceptual</strong> <strong>model</strong>s <strong>for</strong> <strong>organic</strong> <strong>carbon</strong> <strong>in</strong> this region (MWQI, 1998; Brown, 2003).<br />
The work presented <strong>in</strong> this report exp<strong>and</strong>s upon <strong>the</strong> earlier ef<strong>for</strong>ts by us<strong>in</strong>g more<br />
recent data <strong>and</strong> cover<strong>in</strong>g a larger geographical area. The <strong>conceptual</strong> <strong>model</strong> is <strong>in</strong>tended<br />
to <strong>for</strong>m <strong>the</strong> basis <strong>for</strong> identify<strong>in</strong>g data needed to better underst<strong>and</strong> <strong>the</strong> sources of<br />
<strong>organic</strong> <strong>carbon</strong>, <strong>the</strong> relationship between dr<strong>in</strong>k<strong>in</strong>g water concerns <strong>and</strong> ecosystem<br />
concerns, <strong>and</strong> <strong>the</strong> ability to control <strong>organic</strong> <strong>carbon</strong> <strong>in</strong> <strong>the</strong> Delta <strong>and</strong> its watersheds.<br />
This is important because <strong>organic</strong> <strong>carbon</strong> concentrations are currently problematic at<br />
some water supply <strong>in</strong>takes <strong>and</strong> anticipated changes <strong>in</strong> <strong>the</strong> Central Valley <strong>and</strong> Delta<br />
system may exacerbate <strong>the</strong> problem <strong>in</strong> <strong>the</strong> future. Anticipated changes <strong>in</strong>clude<br />
<strong>in</strong>creases <strong>in</strong> developed l<strong>and</strong>, population, <strong>and</strong> concomitant <strong>in</strong>creases <strong>in</strong> water<br />
withdrawals (at new <strong>and</strong> exist<strong>in</strong>g locations) <strong>and</strong> wastewater <strong>and</strong> urban runoff<br />
discharges. The CALFED Program <strong>in</strong>cludes a number of ecosystem restoration<br />
activities <strong>in</strong> <strong>the</strong> Delta, <strong>in</strong>clud<strong>in</strong>g <strong>the</strong> restoration of tidal marshes, some of which have<br />
<strong>the</strong> potential to adversely affect <strong>organic</strong> <strong>carbon</strong> concentrations at <strong>the</strong> dr<strong>in</strong>k<strong>in</strong>g water<br />
<strong>in</strong>takes. Changes to state <strong>and</strong> federal water management system are also be<strong>in</strong>g<br />
contemplated.<br />
The contents of <strong>the</strong> chapters that follow are briefly summarized as follows:<br />
• Chapter 2 presents a summary of <strong>the</strong> key processes associated with <strong>the</strong><br />
production, consumption, decomposition, <strong>and</strong> transport of <strong>organic</strong> <strong>carbon</strong> <strong>in</strong><br />
watersheds <strong>and</strong> receiv<strong>in</strong>g waters <strong>and</strong> an overview of <strong>the</strong> chemical <strong>for</strong>ms of<br />
April 14, 2006 1-3
Chapter 1.0<br />
Conceptual Model <strong>for</strong> Organic Carbon <strong>in</strong> <strong>the</strong> Central Valley<br />
<strong>organic</strong> <strong>carbon</strong> <strong>and</strong> what is known about its relationship to dis<strong>in</strong>fection<br />
byproduct <strong>for</strong>mation.<br />
• Chapter 3 summarizes <strong>the</strong> <strong>in</strong><strong>for</strong>mation on <strong>organic</strong> <strong>carbon</strong>-related parameters<br />
<strong>in</strong> <strong>the</strong> database developed by <strong>the</strong> Central Valley Dr<strong>in</strong>k<strong>in</strong>g Water Policy<br />
Workgroup. Spatial <strong>and</strong> temporal trends <strong>in</strong> concentration data are presented.<br />
This database is <strong>the</strong> primary source of <strong>in</strong><strong>for</strong>mation <strong>for</strong> <strong>the</strong> development of this<br />
<strong>conceptual</strong> <strong>model</strong>. Additional sources of data used <strong>for</strong> this assessment are also<br />
identified.<br />
• Us<strong>in</strong>g <strong>the</strong> data summarized <strong>in</strong> Chapter 3, Chapter 4 provides an estimate of<br />
<strong>the</strong> flows <strong>and</strong> <strong>organic</strong> <strong>carbon</strong> loads transported from <strong>the</strong> tributaries to <strong>the</strong><br />
Delta <strong>in</strong> wet <strong>and</strong> dry years. Sources of <strong>organic</strong> <strong>carbon</strong> from key non-po<strong>in</strong>t <strong>and</strong><br />
po<strong>in</strong>t sources are estimated on a unit basis (e.g., per unit area or per unit<br />
population) to compare stream loads to watershed <strong>in</strong>puts.<br />
• Chapter 5 presents an estimate of <strong>the</strong> <strong>organic</strong> <strong>carbon</strong> concentrations <strong>and</strong><br />
sources with<strong>in</strong> <strong>the</strong> Delta boundaries. Loads <strong>in</strong>ternal to <strong>the</strong> Delta are presented<br />
along with tributary sources discussed <strong>in</strong> Chapter 4. The current approach to<br />
relate tributary loads <strong>and</strong> <strong>in</strong>-Delta sources to concentrations at major pump<br />
stations is also presented.<br />
• Chapter 6 summarizes <strong>the</strong> uncerta<strong>in</strong>ty <strong>in</strong> <strong>the</strong> f<strong>in</strong>d<strong>in</strong>gs from <strong>the</strong> preced<strong>in</strong>g<br />
chapters <strong>and</strong> identifies additional data <strong>and</strong> studies that are needed to better<br />
underst<strong>and</strong> <strong>the</strong> sources <strong>and</strong> potential impacts of <strong>organic</strong> <strong>carbon</strong> <strong>in</strong> municipal<br />
supplies. Key f<strong>in</strong>d<strong>in</strong>gs of <strong>the</strong> analysis presented <strong>in</strong> this <strong>conceptual</strong> <strong>model</strong> are<br />
highlighted. Future trends <strong>in</strong> <strong>organic</strong> <strong>carbon</strong> supplies to <strong>the</strong> Delta <strong>and</strong> vic<strong>in</strong>ity<br />
are also discussed.<br />
1-4 April 14, 2006
CHAPTER 2.0<br />
ORGANIC CARBON IN AQUATIC<br />
ECOSYSTEMS AND PATHWAYS OF<br />
DISINFECTION BYPRODUCT<br />
FORMATION<br />
Organic <strong>carbon</strong>, compris<strong>in</strong>g liv<strong>in</strong>g <strong>and</strong> non-liv<strong>in</strong>g fractions, is <strong>central</strong> to <strong>the</strong> flow of<br />
energy <strong>and</strong> <strong>the</strong> trophic structure of aquatic ecosystems (Wetzel, 2001). Although high<br />
concentrations of <strong>organic</strong> <strong>carbon</strong> are generally undesirable <strong>in</strong> dr<strong>in</strong>k<strong>in</strong>g water sources<br />
due to <strong>the</strong> <strong>for</strong>mation of dis<strong>in</strong>fection byproducts (Amy et al., 1990; Cohn et al., 1999),<br />
<strong>the</strong>se concentrations may be beneficial <strong>and</strong> even essential <strong>for</strong> aquatic ecosystems. An<br />
underst<strong>and</strong><strong>in</strong>g of <strong>the</strong> ecosystem processes of <strong>organic</strong> <strong>carbon</strong> <strong>in</strong> <strong>the</strong> Central Valley is<br />
important because any actions to manage <strong>the</strong> concentrations of <strong>organic</strong> <strong>carbon</strong> at<br />
dr<strong>in</strong>k<strong>in</strong>g water <strong>in</strong>takes must also consider <strong>the</strong> potential ecological impacts. Likewise,<br />
restoration actions <strong>in</strong> <strong>the</strong> Delta to improve habitat quality that change <strong>organic</strong> <strong>carbon</strong><br />
concentrations <strong>and</strong> <strong>the</strong> quality of <strong>the</strong> <strong>organic</strong> <strong>carbon</strong> must consider <strong>the</strong> impacts to<br />
dr<strong>in</strong>k<strong>in</strong>g water. For <strong>the</strong> purpose of evaluat<strong>in</strong>g <strong>the</strong> role of <strong>organic</strong> <strong>carbon</strong> <strong>in</strong> ecological<br />
processes, <strong>the</strong> division <strong>in</strong>to dissolved <strong>and</strong> particulate <strong>for</strong>ms, <strong>and</strong> also bioavailable<br />
<strong>for</strong>ms, is critical. However, <strong>the</strong> <strong>for</strong>mation of THMs <strong>and</strong> o<strong>the</strong>r dis<strong>in</strong>fection byproducts<br />
dur<strong>in</strong>g dr<strong>in</strong>k<strong>in</strong>g water treatment is generally not directly related to <strong>the</strong>se <strong>for</strong>ms, but is<br />
a function of <strong>the</strong> chemical structure <strong>and</strong> reactivity of <strong>the</strong> <strong>organic</strong> <strong>carbon</strong>. General<br />
f<strong>in</strong>d<strong>in</strong>gs from <strong>the</strong> literature on ecosystem processes <strong>and</strong> dr<strong>in</strong>k<strong>in</strong>g water impacts are<br />
briefly reviewed <strong>in</strong> this chapter. Subsequent chapters present Central Valley <strong>and</strong><br />
Delta specific data <strong>and</strong> quantification of <strong>the</strong> processes described <strong>in</strong> this chapter.<br />
2.1 ORGANIC CARBON CYCLING AND TRANSPORT<br />
The cycl<strong>in</strong>g of <strong>organic</strong> <strong>carbon</strong> <strong>in</strong> terrestrial environments is shown <strong>in</strong> schematic <strong>for</strong>m<br />
<strong>in</strong> Figure 2-1. Organic <strong>carbon</strong> is produced from atmospheric <strong>carbon</strong> dioxide <strong>and</strong><br />
April 14, 2006 2-1
Chapter 2.0<br />
Conceptual Model <strong>for</strong> Organic Carbon <strong>in</strong> <strong>the</strong> Central Valley<br />
water by plants through <strong>the</strong> many complex reactions of photosyn<strong>the</strong>sis. (<strong>in</strong> <strong>for</strong>ests,<br />
cropl<strong>and</strong>, rangel<strong>and</strong>, <strong>and</strong> to a lesser degree on urban l<strong>and</strong>). Organic <strong>carbon</strong> enters <strong>the</strong><br />
surface soil pool follow<strong>in</strong>g senescence <strong>and</strong> litterfall of plant matter. Microbial<br />
populations <strong>and</strong> fungi break down this <strong>organic</strong> <strong>carbon</strong> <strong>in</strong>to smaller, more labile <strong>for</strong>ms<br />
<strong>and</strong> ultimately to <strong>carbon</strong> dioxide. A fraction of soil <strong>organic</strong> matter is stored <strong>in</strong> <strong>the</strong><br />
terrestrial compartment <strong>and</strong> a fraction is transported <strong>in</strong> surface runoff <strong>and</strong> <strong>in</strong>to<br />
groundwater which may enter surface waters as baseflow. Not shown <strong>in</strong> this<br />
schematic are po<strong>in</strong>t sources such as wastewater treatment plants that may conta<strong>in</strong><br />
<strong>organic</strong> <strong>carbon</strong> orig<strong>in</strong>at<strong>in</strong>g <strong>in</strong> <strong>the</strong> watershed as well as imported <strong>organic</strong> <strong>carbon</strong>. The<br />
magnitude of <strong>organic</strong> <strong>carbon</strong> export is a function of <strong>the</strong> l<strong>and</strong> use <strong>and</strong> <strong>the</strong> level of<br />
ra<strong>in</strong>fall <strong>and</strong> runoff. Literature reports suggest a range of dissolved <strong>organic</strong> <strong>carbon</strong><br />
exports from 0.38 tons/km 2 /yr <strong>for</strong> cool grassl<strong>and</strong>s to 9.9 tons/km 2 /yr <strong>in</strong> swamp <strong>for</strong>ests<br />
(Aitkenhead <strong>and</strong> McDowell, 2000). For most freshwater bodies, watershed sources of<br />
<strong>organic</strong> <strong>carbon</strong> are a much greater source than <strong>in</strong>ternal production (Wetzel, 2001).<br />
O<strong>the</strong>r th<strong>in</strong>gs be<strong>in</strong>g equal, dry regions are expected to export a lower amount of<br />
<strong>organic</strong> <strong>carbon</strong> than wet regions with greater runoff. This is relevant to <strong>the</strong> Central<br />
Valley because it exhibits a variety of precipitation characteristics, with <strong>the</strong> nor<strong>the</strong>rn<br />
<strong>and</strong> eastern portions be<strong>in</strong>g wetter than <strong>the</strong> sou<strong>the</strong>rn <strong>and</strong> western portions (NRCS,<br />
2006).<br />
Figure 2-1.<br />
Schematic of <strong>organic</strong> <strong>carbon</strong> cycl<strong>in</strong>g <strong>in</strong> <strong>the</strong> terrestrial environment<br />
The cycl<strong>in</strong>g of <strong>organic</strong> <strong>carbon</strong> <strong>in</strong> <strong>the</strong> aquatic environment is shown <strong>in</strong> schematic <strong>for</strong>m<br />
<strong>in</strong> Figure 2-2. Organic <strong>carbon</strong> may enter a water body from terrestrial sources <strong>in</strong> <strong>the</strong><br />
watershed as shown <strong>in</strong> Figure 2-1, <strong>and</strong> it may also be photosyn<strong>the</strong>sized with<strong>in</strong> <strong>the</strong><br />
water body by benthic <strong>and</strong> planktonic algae <strong>and</strong> plants, us<strong>in</strong>g atmospheric <strong>carbon</strong><br />
dioxide or dissolved <strong>in</strong><strong>organic</strong> <strong>carbon</strong> as a <strong>carbon</strong> source. For simplicity, <strong>the</strong> <strong>organic</strong><br />
<strong>carbon</strong> is represented as two pools, particulate <strong>and</strong> dissolved <strong>organic</strong> <strong>carbon</strong> (POC<br />
<strong>and</strong> DOC respectively), although <strong>in</strong> reality <strong>the</strong>re is a cont<strong>in</strong>uum of particle size <strong>and</strong><br />
molecular weight that <strong>in</strong>fluences its metabolism (Wetzel, 2001). A key feature shown<br />
2-2 April 14, 2006
Conceptual Model <strong>for</strong> Organic Carbon <strong>in</strong> <strong>the</strong> Central Valley Chapter 2.0<br />
<strong>in</strong> Figure 2-2 is that DOC, unlike POC, cannot be directly taken up by primary<br />
consumers. Bacteria may convert DOC to bacterial biomass which <strong>the</strong>n becomes<br />
available <strong>for</strong> consumption by higher organisms (Wetzel, 2001; Jassby <strong>and</strong> Cloern,<br />
2000). POC from <strong>the</strong> watershed <strong>and</strong> POC from aquatic primary production is<br />
generally more accessible to <strong>the</strong> food web than DOC. In most ecosystems it has been<br />
observed that <strong>the</strong> detrital <strong>organic</strong> <strong>carbon</strong> (as DOC <strong>and</strong> non-liv<strong>in</strong>g POC) is far more<br />
abundant than <strong>the</strong> <strong>organic</strong> <strong>carbon</strong> <strong>in</strong> liv<strong>in</strong>g POC (Wetzel, 2001). Bacteria may also<br />
metabolize DOC to <strong>carbon</strong> dioxide that exits <strong>the</strong> aquatic system. The atmospheric<br />
pathway <strong>for</strong> loss of <strong>organic</strong> <strong>carbon</strong> is significant, <strong>and</strong> <strong>in</strong> some areas of <strong>the</strong> Delta, such<br />
as <strong>the</strong> isl<strong>and</strong>s, can be far <strong>in</strong> excess of aqueous export (Deverel <strong>and</strong> Rojstaczer, 1996).<br />
Sediments <strong>in</strong> water bodies play a key role <strong>in</strong> <strong>the</strong> cycl<strong>in</strong>g of <strong>organic</strong> <strong>carbon</strong>. Generally,<br />
POC can settle to <strong>the</strong> sediments, <strong>and</strong> provide a source of DOC to <strong>the</strong> overly<strong>in</strong>g water<br />
column through microbial decay. Sediment POC can be stored <strong>for</strong> long periods, or<br />
may be scoured <strong>and</strong> transported downstream dur<strong>in</strong>g high flow events. Thus, high flow<br />
events <strong>in</strong> <strong>the</strong> wet season transport large quantities of <strong>organic</strong> <strong>carbon</strong> that may have<br />
accumulated <strong>in</strong> <strong>the</strong> sediments <strong>in</strong> preced<strong>in</strong>g months or years.<br />
Figure 2-2.<br />
Schematic of <strong>organic</strong> <strong>carbon</strong> cycl<strong>in</strong>g <strong>in</strong> <strong>the</strong> aquatic environment (modified from<br />
Wetzel, 2001).<br />
The transport processes of <strong>organic</strong> <strong>carbon</strong> are shown schematically <strong>for</strong> <strong>the</strong> Central<br />
Valley - Delta ecosystem <strong>in</strong> Figure 2-3. Organic <strong>carbon</strong>, <strong>in</strong> various stages of decay,<br />
April 14, 2006 2-3
Chapter 2.0<br />
Conceptual Model <strong>for</strong> Organic Carbon <strong>in</strong> <strong>the</strong> Central Valley<br />
enters water bodies through streams <strong>in</strong> dra<strong>in</strong>age <strong>and</strong> runoff <strong>and</strong> through groundwater<br />
flows. Streams play a critical role <strong>in</strong> <strong>organic</strong> <strong>carbon</strong> transport. They act as conduits<br />
<strong>for</strong> <strong>organic</strong> <strong>carbon</strong> exported from l<strong>and</strong> surfaces, but may also convert some of <strong>the</strong><br />
<strong>organic</strong> <strong>carbon</strong> <strong>in</strong>to <strong>carbon</strong> dioxide or store it <strong>in</strong> sediments. At o<strong>the</strong>r times, depend<strong>in</strong>g<br />
on flow rates, sediment erosion or efflux can be a contribution to <strong>the</strong> transported load.<br />
Fur<strong>the</strong>r, streams may be an additional source of <strong>organic</strong> <strong>carbon</strong> production through<br />
algal <strong>and</strong> macrophyte growth. Organic <strong>carbon</strong> transport <strong>in</strong> streams is controlled by<br />
flow rates with <strong>the</strong> greatest loads be<strong>in</strong>g transported dur<strong>in</strong>g high flow events <strong>in</strong> <strong>the</strong> wet<br />
season. In <strong>the</strong> wet season, <strong>and</strong> especially dur<strong>in</strong>g storm flows, <strong>organic</strong> <strong>carbon</strong> stored <strong>in</strong><br />
<strong>the</strong> surface layers of various l<strong>and</strong> uses, <strong>and</strong> also <strong>in</strong> stream sediments is transported<br />
<strong>in</strong>to downstream waters.<br />
The Central Valley is unique <strong>in</strong> hav<strong>in</strong>g reservoirs on practically all tributaries, which<br />
may play an important role <strong>in</strong> <strong>organic</strong> <strong>carbon</strong> production <strong>and</strong> export. Reservoirs, by<br />
stor<strong>in</strong>g water <strong>for</strong> extended residence times dur<strong>in</strong>g <strong>the</strong> warm, dry months of <strong>the</strong> year,<br />
<strong>and</strong> by provid<strong>in</strong>g a large surface area, may provide an environment <strong>for</strong> algae growth<br />
<strong>in</strong> excess of what would have occurred naturally. Some of <strong>the</strong> <strong>organic</strong> <strong>carbon</strong><br />
produced <strong>in</strong> reservoirs may be exported downstream. Conversely, reservoirs may act<br />
as large settl<strong>in</strong>g bas<strong>in</strong>s <strong>for</strong> POC, result<strong>in</strong>g <strong>in</strong> less transport of <strong>organic</strong> <strong>carbon</strong><br />
downstream.<br />
Tributary <strong>organic</strong> <strong>carbon</strong> loads (termed allochthonous loads), which <strong>in</strong>clude detrital<br />
as well as planktonic <strong>organic</strong> <strong>carbon</strong>, reach <strong>the</strong> Delta where <strong>the</strong> residence time ranges<br />
from days to weeks, depend<strong>in</strong>g on season <strong>and</strong> <strong>in</strong>flow volume. As shown <strong>in</strong> Figure 2-<br />
3, <strong>the</strong> Delta is itself a producer of <strong>organic</strong> <strong>carbon</strong> due to primary production by<br />
benthic <strong>and</strong> planktonic algae <strong>and</strong> plants <strong>and</strong> export from tidal marshes, agriculture,<br />
<strong>and</strong> developed l<strong>and</strong>s (autochthonous loads). A fraction of <strong>the</strong> <strong>in</strong>ternally generated <strong>and</strong><br />
<strong>the</strong> tributary <strong>organic</strong> <strong>carbon</strong> is exported to San Francisco Bay. Organic <strong>carbon</strong> is also<br />
lost from <strong>the</strong> Delta by <strong>the</strong> diversion of water at <strong>the</strong> dr<strong>in</strong>k<strong>in</strong>g water <strong>in</strong>takes.<br />
Additionally, <strong>organic</strong> <strong>carbon</strong> is <strong>in</strong>corporated <strong>in</strong> sediments <strong>and</strong> metabolized to <strong>carbon</strong><br />
dioxide. Because large dr<strong>in</strong>k<strong>in</strong>g water <strong>in</strong>takes are located <strong>in</strong> <strong>the</strong> Delta, <strong>the</strong> quality <strong>and</strong><br />
quantity of <strong>the</strong> autochthonous <strong>organic</strong> <strong>carbon</strong> is of particular relevance to potential<br />
dr<strong>in</strong>k<strong>in</strong>g water quality impacts.<br />
Decl<strong>in</strong>es <strong>in</strong> fish species <strong>and</strong> related food web impacts <strong>in</strong> San Francisco Bay <strong>and</strong> <strong>the</strong><br />
Delta have motivated studies of <strong>organic</strong> <strong>carbon</strong> sources <strong>and</strong> bioavailability<br />
<strong>in</strong>dependent of dr<strong>in</strong>k<strong>in</strong>g water quality-related <strong>in</strong>vestigations (e.g., Jassby et al., 1993).<br />
Driven by variations <strong>in</strong> tributary <strong>in</strong>flows, allochthonous <strong>organic</strong> <strong>carbon</strong> loads vary<br />
widely from year to year (Jassby et al., 2002). There is also a substantial year-to-year<br />
variation <strong>in</strong> primary production <strong>in</strong> <strong>the</strong> Delta with a decl<strong>in</strong><strong>in</strong>g trend <strong>in</strong> primary<br />
production <strong>in</strong> recent years that has been attributed to various causes <strong>in</strong>clud<strong>in</strong>g <strong>the</strong><br />
consumption of phytoplankton by an exotic <strong>in</strong>vad<strong>in</strong>g species (<strong>the</strong> Asian clam<br />
Potamocorbula amurensis) <strong>and</strong> o<strong>the</strong>r benthic consumers (Jassby et al., 2002).<br />
2-4 April 14, 2006
Conceptual Model <strong>for</strong> Organic Carbon <strong>in</strong> <strong>the</strong> Central Valley Chapter 2.0<br />
Figure 2-3. Schematic representation of <strong>organic</strong> <strong>carbon</strong> transport <strong>in</strong> <strong>the</strong> Central Valley-Delta system. Organic <strong>carbon</strong> orig<strong>in</strong>ates <strong>in</strong> upstream<br />
natural sources, <strong>and</strong> is released from reservoirs to <strong>the</strong> lower watershed, where <strong>the</strong>re are additional contributions from po<strong>in</strong>t <strong>and</strong><br />
non-po<strong>in</strong>t sources. The <strong>organic</strong> <strong>carbon</strong> from <strong>the</strong> tributaries enters <strong>the</strong> Delta, where <strong>the</strong>re are additional po<strong>in</strong>t <strong>and</strong> non-po<strong>in</strong>t<br />
sources <strong>in</strong> its immediate watershed, as well as production with<strong>in</strong> <strong>the</strong> Delta. A fraction of <strong>the</strong> <strong>organic</strong> <strong>carbon</strong> is exported <strong>in</strong><br />
aqueducts, but <strong>in</strong> most seasons, a large fraction is exported downstream to San Francisco Bay.<br />
April 14, 2006 2-5
Chapter 2.0<br />
Conceptual Model <strong>for</strong> Organic Carbon <strong>in</strong> <strong>the</strong> Central Valley<br />
Recent studies have concluded that tributary <strong>in</strong>puts of <strong>organic</strong> <strong>carbon</strong> several times<br />
larger than <strong>in</strong>-Delta primary productivity <strong>and</strong> agricultural dra<strong>in</strong>age (Jassby <strong>and</strong><br />
Cloern, 2000). A fraction of <strong>the</strong> tributary <strong>and</strong> <strong>in</strong>ternal loads are exported <strong>in</strong> <strong>the</strong> water<br />
supply <strong>in</strong>takes, while <strong>the</strong> rema<strong>in</strong>der flows <strong>in</strong>to San Francisco Bay. Evaluation of<br />
bacterial communities <strong>in</strong> <strong>the</strong> Delta us<strong>in</strong>g DNA f<strong>in</strong>gerpr<strong>in</strong>ts showed seasonal, but not<br />
spatial variation, <strong>in</strong> <strong>the</strong> bacterial communities. Bacterial communities associated with<br />
local primary production-derived <strong>organic</strong> <strong>carbon</strong> were dom<strong>in</strong>ant <strong>in</strong> summer/fall, <strong>and</strong><br />
communities associated with terrestrial sources were dom<strong>in</strong>ant <strong>in</strong> w<strong>in</strong>ter<br />
(Stepanauskas et al., 2003).<br />
The bioavailability, <strong>and</strong> <strong>the</strong>re<strong>for</strong>e <strong>the</strong> ecological significance, of different components<br />
of <strong>organic</strong> <strong>carbon</strong> <strong>in</strong> <strong>the</strong> Delta are variable. Although a fraction of <strong>the</strong> DOC is<br />
available <strong>for</strong> bacterial metabolism, it appears to be a less important food source at <strong>the</strong><br />
base of <strong>the</strong> food web than <strong>organic</strong> <strong>carbon</strong> derived from primary production with<strong>in</strong> <strong>the</strong><br />
Delta (Jassby <strong>and</strong> Cloern, 2000; Sobczak et al., 2002, 2004). Fur<strong>the</strong>r, much of <strong>the</strong><br />
natural POC load <strong>in</strong> <strong>the</strong> tributaries is a much poorer food source than natural<br />
phytoplankton. In controlled experimental studies with a zooplankton, Daphnia<br />
magna, total detrital <strong>organic</strong> <strong>carbon</strong> concentrations were found to be weakly related<br />
to growth, although chlorophyll a concentrations were found to be a good predictor<br />
<strong>for</strong> growth (Müeller-Solger et al., 2002). This study <strong>in</strong>dicates that <strong>in</strong> a system like <strong>the</strong><br />
Delta with an abundance of detrital <strong>organic</strong> <strong>carbon</strong>, much of it from tributary sources,<br />
some consum<strong>in</strong>g organisms exhibit a preference <strong>for</strong> <strong>organic</strong> <strong>carbon</strong> freshly derived<br />
from primary production. In laboratory studies on water samples from <strong>the</strong> Delta, it<br />
has been shown that a relatively small fraction of <strong>the</strong> DOC <strong>and</strong> POC is available <strong>for</strong><br />
bacterial metabolism (operationally def<strong>in</strong>ed as a 21-day <strong>in</strong>cubation), <strong>and</strong> <strong>the</strong><br />
bioavailable fraction is well correlated with primary production (Sobczak et al.,<br />
2004). If <strong>the</strong>se results are corroborated by fur<strong>the</strong>r research, potential reductions <strong>in</strong><br />
tributary loads of <strong>organic</strong> <strong>carbon</strong> are less likely to have adverse ecological impacts,<br />
<strong>and</strong> it may be found that water quality objectives <strong>for</strong> dr<strong>in</strong>k<strong>in</strong>g water supply <strong>and</strong><br />
ecosystem health are not necessarily <strong>in</strong> conflict.<br />
2.2 ORGANIC CARBON CHEMISTRY AND DRINKING WATER QUALITY<br />
As shown schematically <strong>in</strong> Figure 2-2, <strong>organic</strong> matter <strong>in</strong> <strong>the</strong> water column of a water<br />
body consists of materials from plant, animal, <strong>and</strong> bacterial orig<strong>in</strong>s <strong>in</strong> various stages<br />
of decay, with fragments of variable molecular weight, functional group, <strong>and</strong><br />
chemical reactivity. This <strong>organic</strong> <strong>carbon</strong> can exist as both POC <strong>and</strong> DOC, although<br />
DOC is generally considered <strong>the</strong> more important fraction <strong>for</strong> <strong>the</strong> production of<br />
dis<strong>in</strong>fection byproducts because of its greater abundance <strong>and</strong> reactivity dur<strong>in</strong>g<br />
chlor<strong>in</strong>ation (e.g., Chow <strong>and</strong> Gao, 2003; Chow et al., 2003). Organic <strong>carbon</strong> can<br />
broadly be divided <strong>in</strong>to two groups, humic <strong>and</strong> non-humic substances (Thurman,<br />
1985). Humic substances are high molecular weight compounds largely <strong>for</strong>med as a<br />
result of bacterial <strong>and</strong> fungal action on plant material <strong>and</strong> <strong>in</strong>clude humic acids (that<br />
precipitate at pH
Conceptual Model <strong>for</strong> Organic Carbon <strong>in</strong> <strong>the</strong> Central Valley Chapter 2.0<br />
Several studies <strong>in</strong> <strong>the</strong> literature have shown <strong>the</strong> l<strong>in</strong>k between TOC or DOC levels <strong>and</strong><br />
THM <strong>for</strong>mation. For example, us<strong>in</strong>g data from 133 lakes, rivers, <strong>and</strong> reservoirs across<br />
<strong>the</strong> US, Chapra et al. (1997) showed that TOC levels were a good predictor of THM<br />
<strong>for</strong>mation potential (THMFP) with a non-l<strong>in</strong>ear relationship (THMFP =<br />
43.8*TOC 1.248 , r 2 = 0.94). It was also noted that higher TOC waters, possibly with a<br />
higher proportion of humic acids, produced more THMs per unit weight of <strong>carbon</strong><br />
than lower TOC waters. In general, simple measures of <strong>organic</strong> <strong>carbon</strong> (such as DOC<br />
or TOC) work best as a predictor <strong>for</strong> THM <strong>for</strong>mation if <strong>the</strong> <strong>carbon</strong> orig<strong>in</strong>ates from<br />
one type of source. When <strong>organic</strong> <strong>carbon</strong> <strong>in</strong> a water sample orig<strong>in</strong>ates from multiple<br />
sources, or when waters from different locations are compared, <strong>the</strong> predictive ability<br />
is likely to be weaker. Thus, <strong>for</strong> samples from a s<strong>in</strong>gle Delta isl<strong>and</strong>, Fujii et al (1998)<br />
found a strong correlation between DOC <strong>and</strong> THMFP, although this relationship may<br />
be weaker when multiple locations are compared toge<strong>the</strong>r (Weishaar et al., 2003) or<br />
when rivers with multiple sources are considered (Amy et al., 1990). A considerable<br />
amount of recent research has focused on relat<strong>in</strong>g <strong>organic</strong> matter compositional<br />
<strong>in</strong><strong>for</strong>mation to THM <strong>for</strong>mation, <strong>and</strong> on identify<strong>in</strong>g <strong>the</strong> orig<strong>in</strong>s of <strong>organic</strong> <strong>carbon</strong> near<br />
water <strong>in</strong>takes <strong>in</strong> <strong>the</strong> Delta. Much of this work has confirmed that <strong>organic</strong> <strong>carbon</strong> <strong>in</strong><br />
water from different locations varies considerably with respect to <strong>the</strong> <strong>for</strong>mation of<br />
THMs dur<strong>in</strong>g chlor<strong>in</strong>ation (Bergamaschi et al., undated; Fujii et al., 1998; Fram et al.,<br />
1999; Weishaar et al., 2003). Although <strong>the</strong> relationship between <strong>organic</strong> <strong>carbon</strong><br />
sources <strong>and</strong> concentrations at <strong>in</strong>dividual water supply <strong>in</strong>takes is complex, <strong>the</strong>se<br />
studies suggest that management of <strong>organic</strong> <strong>carbon</strong> sources <strong>for</strong> dr<strong>in</strong>k<strong>in</strong>g water quality<br />
should consider both quality <strong>and</strong> quantity, with greater emphasis on sources with <strong>the</strong><br />
highest THMFP.<br />
Organic <strong>carbon</strong> quality is characterized <strong>in</strong> a few different ways <strong>in</strong> rout<strong>in</strong>e monitor<strong>in</strong>g<br />
<strong>and</strong> specialized research studies. The data most commonly reported <strong>in</strong> <strong>the</strong> Delta <strong>and</strong><br />
vic<strong>in</strong>ity <strong>in</strong>clude dissolved, particulate, <strong>and</strong> total <strong>organic</strong> <strong>carbon</strong>, ultraviolet (UV)<br />
absorbance at 254 nm, specific UV absorbance (or SUVA, which is absorbance <strong>in</strong><br />
units of cm -1 divided by <strong>the</strong> DOC concentration <strong>in</strong> mg/l). To a limited extent, data are<br />
also available on <strong>the</strong> THMFP through equilibrations of water samples with gaseous<br />
chlor<strong>in</strong>e <strong>in</strong> a protocol to mimic <strong>the</strong> dis<strong>in</strong>fection process <strong>in</strong> water treatment plants<br />
(Cali<strong>for</strong>nia Department of Water Resources, 1994). Specialized, limited-duration<br />
research studies have per<strong>for</strong>med considerably more detailed analysis of <strong>the</strong> structure<br />
of natural <strong>organic</strong> matter to estimate reactivity <strong>and</strong> identify sources. These analyses<br />
have <strong>in</strong>cluded separation <strong>in</strong>to various fractions (hydrophilic <strong>and</strong> hydrophobic, humic<br />
<strong>and</strong> fulvic acids, etc.), 13 C-NMR spectroscopy to identify chemical structures <strong>and</strong><br />
<strong>carbon</strong>:nitrogen ratios <strong>and</strong> stable isotope (δ 13 C, δ 15 N) signatures to identify sources.<br />
The variety of analyses of aquatic <strong>organic</strong> <strong>carbon</strong> samples <strong>and</strong> <strong>the</strong> <strong>in</strong><strong>for</strong>mation<br />
derived from <strong>the</strong>m is summarized <strong>in</strong> Table 2-1. An important goal of <strong>the</strong>se studies is<br />
to establish <strong>the</strong> l<strong>in</strong>k between various structural moieties of <strong>organic</strong> <strong>carbon</strong> <strong>and</strong><br />
THMFP. When certa<strong>in</strong> chemical characteristics of <strong>organic</strong> <strong>carbon</strong> associated with<br />
THM <strong>for</strong>mation can be related to specific sources, <strong>the</strong> <strong>in</strong><strong>for</strong>mation can be used to<br />
improve management of source water quality by target<strong>in</strong>g <strong>the</strong> most reactive <strong>for</strong>ms of<br />
April 14, 2006 2-7
Chapter 2.0<br />
Conceptual Model <strong>for</strong> Organic Carbon <strong>in</strong> <strong>the</strong> Central Valley<br />
<strong>organic</strong> <strong>carbon</strong>. Key f<strong>in</strong>d<strong>in</strong>gs from recent research on <strong>organic</strong> <strong>carbon</strong> chemistry are<br />
summarized below.<br />
Table 2-1<br />
DOC-related measurements.<br />
A significant quantity of <strong>the</strong> <strong>in</strong>itial work on <strong>organic</strong> <strong>carbon</strong> characterization was<br />
focused on UV absorbance (<strong>and</strong> SUVA), because this parameter was related to <strong>the</strong><br />
aromaticity of <strong>organic</strong> <strong>carbon</strong>, a property identified to be related to general <strong>organic</strong><br />
matter reactivity <strong>and</strong> THM <strong>for</strong>mation (Reckhow et al., 1990). More recent work <strong>in</strong> <strong>the</strong><br />
Delta <strong>and</strong> o<strong>the</strong>r locations shows that <strong>the</strong> correlation between SUVA <strong>and</strong> THM<br />
<strong>for</strong>mation potential is weak (Fujii et al., 1998; Fram et al., 1999; Weishaar et al.,<br />
2003). SUVA, while confirmed to be a good predictor of aromaticity by 13 C-NMR<br />
spectroscopy, is a weak predictor of THM <strong>for</strong>mation because non-aromatic fractions<br />
of <strong>organic</strong> <strong>carbon</strong> also play an important role <strong>and</strong> all aromatic fractions are not highly<br />
reactive (Weishaar et al., 2003; Fleck et al., 2004). In Delta waters, <strong>the</strong> percentage of<br />
<strong>organic</strong> <strong>carbon</strong> was not shown to correlate with <strong>the</strong> THM <strong>for</strong>mation (Fram et al.,<br />
1999). In a study with water with from a relatively homogeneous source (Twitchell<br />
Isl<strong>and</strong> agricultural dra<strong>in</strong>age), <strong>the</strong> correlation between SUVA <strong>and</strong> specific THMFP<br />
was considerably weaker than that between DOC <strong>and</strong> THMFP (Fujii et al., 1998).<br />
SUVA has also been shown to be <strong>in</strong>fluenced by <strong>in</strong>terferences such as pH, nitrate, <strong>and</strong><br />
iron <strong>in</strong> water samples, although <strong>the</strong>se may not be significant at <strong>the</strong> ranges of <strong>the</strong>se<br />
parameters <strong>in</strong> surface waters (Weishaar et al., 2003). SUVA is used to determ<strong>in</strong>e <strong>the</strong><br />
level of TOC removal required <strong>in</strong> raw water samples (US EPA, 1998) <strong>and</strong> cont<strong>in</strong>ues<br />
to be a widely used measure of <strong>organic</strong> <strong>carbon</strong> reactivity. In fact, at most <strong>organic</strong><br />
<strong>carbon</strong> sampl<strong>in</strong>g locations <strong>in</strong> <strong>the</strong> Delta <strong>and</strong> Central Valley, SUVA (or UVA) is <strong>the</strong><br />
only o<strong>the</strong>r additional chemical characterization that is reported.<br />
2-8 April 14, 2006
Conceptual Model <strong>for</strong> Organic Carbon <strong>in</strong> <strong>the</strong> Central Valley Chapter 2.0<br />
The most direct measure of <strong>the</strong> chemical functional groups of natural <strong>organic</strong> matter<br />
is through 13 C-NMR spectroscopy, a method that is complicated <strong>and</strong> expensive to<br />
apply on a rout<strong>in</strong>e basis. However, reports of <strong>organic</strong> matter characterization with this<br />
approach cont<strong>in</strong>ue to grow <strong>in</strong> <strong>the</strong> literature. A major f<strong>in</strong>d<strong>in</strong>g from <strong>the</strong> application of<br />
13 C-NMR spectroscopy is that aromaticity is not a good predictor of THMFP<br />
(Weishaar et al., 2003), although <strong>the</strong> role of o<strong>the</strong>r functional groups has not been<br />
clearly identified (Chow <strong>and</strong> Gao, 2003).<br />
Fractionation evaluations on <strong>organic</strong> <strong>carbon</strong> <strong>in</strong> water samples us<strong>in</strong>g nonionic res<strong>in</strong>s,<br />
followed by tests <strong>for</strong> THMFP, have been per<strong>for</strong>med by several researchers (e.g.,<br />
reviewed by Chow <strong>and</strong> Gao, 2003). Fractionation of <strong>organic</strong> matter <strong>in</strong>to hydrophobic<br />
<strong>and</strong> hydrophilic acids has shown that hydrophobic acids more readily <strong>for</strong>m THMs<br />
than hydrophilic acids at many locations (Krasner et al., 1996), <strong>and</strong> specifically <strong>in</strong> <strong>the</strong><br />
Central Valley <strong>and</strong> Delta (Bergamaschi et al., 2000). Fractionation <strong>in</strong>to apparent<br />
molecular weight (AMW) has not shown a strong correlation between AMW <strong>and</strong><br />
THMFP <strong>and</strong> <strong>the</strong>re is no consensus <strong>in</strong> <strong>the</strong> literature on <strong>the</strong> l<strong>in</strong>k between <strong>the</strong> two<br />
parameters (Chow <strong>and</strong> Gao, 2003). In some <strong>in</strong>stances <strong>in</strong> <strong>the</strong> Delta, lower AMW<br />
fractions were found to be more reactive than <strong>the</strong> larger AMW fractions (Amy et al.,<br />
1990). Organic <strong>carbon</strong> from different sources <strong>in</strong> <strong>the</strong> Delta was found to have different<br />
propensities to <strong>for</strong>m THMs, with <strong>the</strong> limited data currently available <strong>in</strong>dicat<strong>in</strong>g that<br />
tributary <strong>organic</strong> <strong>carbon</strong> was more reactive than that released from Delta agricultural<br />
isl<strong>and</strong>s (Bergamaschi et al., 2000).<br />
Carbon:Nitrogen ratios <strong>and</strong> stable isotope chemistry <strong>in</strong> bulk <strong>organic</strong> matter (δ 13 C,<br />
δ 15 N) <strong>and</strong> <strong>in</strong> THMs (δ 13 C) <strong>for</strong>med <strong>in</strong> test samples can be used to elucidate <strong>the</strong> source<br />
of <strong>organic</strong> matter, <strong>and</strong> to identify <strong>the</strong> relative reactivity of <strong>the</strong> different <strong>organic</strong> <strong>carbon</strong><br />
fractions (e.g., Bergamaschi et al., 1999). Organic matter from tributary sources<br />
(orig<strong>in</strong>at<strong>in</strong>g <strong>in</strong> surface runoff <strong>and</strong> groundwater flow) has much lower nitrogen<br />
contents (C:N of about 50:1) compared with <strong>organic</strong> matter derived from primary<br />
production with<strong>in</strong> water bodies (C:N of about 12:1) (Wetzel, 2001). Data from <strong>the</strong><br />
Delta show relatively small differences across different sites <strong>in</strong> all of <strong>the</strong>se<br />
parameters. Organic <strong>carbon</strong> at most tributary <strong>and</strong> Delta locations sampled appears to<br />
be dom<strong>in</strong>ated by detrital material, with C:N ratios <strong>in</strong> most cases 30 or greater. In<br />
general, <strong>the</strong> stable isotope data are consistent with a small addition of <strong>organic</strong> matter<br />
due to primary production <strong>in</strong> <strong>the</strong> Delta, with much of <strong>the</strong> <strong>organic</strong> matter orig<strong>in</strong>at<strong>in</strong>g <strong>in</strong><br />
<strong>the</strong> tributaries (Bergamaschi et al., undated). The limited spatial <strong>and</strong> temporal detail<br />
<strong>in</strong> <strong>the</strong> data currently available precludes a more detailed assessment us<strong>in</strong>g <strong>the</strong>se<br />
analytical approaches.<br />
It is important to note that published research on dis<strong>in</strong>fectant byproduct <strong>for</strong>mation has<br />
largely focused on <strong>the</strong> potential <strong>for</strong> THM <strong>for</strong>mation, <strong>and</strong> not on potential <strong>for</strong><br />
<strong>for</strong>mation of haloacetic acids <strong>and</strong> o<strong>the</strong>r <strong>organic</strong> halides. An exception is work by <strong>the</strong><br />
Municipal Water Quality Investigations Program (MWQI, 2003) where a limited<br />
about of haloacetic acid <strong>for</strong>mation was also studied. THMs are generally <strong>the</strong> most<br />
abundant dis<strong>in</strong>fection byproduct <strong>in</strong> tests <strong>for</strong> dis<strong>in</strong>fectant byproduct <strong>for</strong>mation<br />
April 14, 2006 2-9
Chapter 2.0<br />
Conceptual Model <strong>for</strong> Organic Carbon <strong>in</strong> <strong>the</strong> Central Valley<br />
potential, <strong>and</strong> haloacetic acids are no more that 50% of <strong>the</strong> total concentration of<br />
THMs.<br />
2.3 MAJOR FINDINGS<br />
Organic <strong>carbon</strong> <strong>in</strong> <strong>the</strong> dissolved <strong>for</strong>m (DOC) is <strong>the</strong> <strong>for</strong>m considered to be more likely<br />
to react dur<strong>in</strong>g chlor<strong>in</strong>ation <strong>and</strong> <strong>for</strong>m dis<strong>in</strong>fection byproduct compounds. DOC is<br />
generally less bioavailable to <strong>the</strong> base of <strong>the</strong> food web compared with particulate<br />
<strong>organic</strong> <strong>carbon</strong> <strong>and</strong>/or <strong>organic</strong> <strong>carbon</strong> freshly derived from primary production. Thus,<br />
ef<strong>for</strong>ts <strong>in</strong> <strong>the</strong> Central Valley <strong>and</strong> Delta to control or manage DOC levels <strong>for</strong> dr<strong>in</strong>k<strong>in</strong>g<br />
water quality may not have direct adverse effects on <strong>the</strong> food web, although this is a<br />
subject that needs to be studied fur<strong>the</strong>r.<br />
There is general agreement <strong>in</strong> <strong>the</strong> literature that THM <strong>for</strong>mation is correlated to DOC<br />
concentrations, although <strong>the</strong> relationship is more complex when a specific structural<br />
characteristic of DOC is compared with THMFP. A commonly used measure of DOC<br />
aromaticity, SUVA at 254 nm, was found to be poorly correlated to THM <strong>for</strong>mation<br />
<strong>in</strong> Delta waters.<br />
Characterization of <strong>organic</strong> matter through sophisticated analytical tools such as<br />
stable isotope signatures is an active area of research. Published <strong>in</strong><strong>for</strong>mation that was<br />
available at this time, however, is limited to a small number of locations near <strong>the</strong><br />
Delta, <strong>and</strong> with limited temporal resolution. The data are <strong>in</strong>dicative of a contribution<br />
due to <strong>in</strong>-Delta primary production, although <strong>the</strong> variability of this contribution as a<br />
function of time is not known. There is limited knowledge on <strong>the</strong> relative propensity<br />
of different sources to <strong>for</strong>m THMs, although it appears that Delta isl<strong>and</strong> dra<strong>in</strong>age is<br />
somewhat less reactive than tributary sources.<br />
2-10 April 14, 2006
CHAPTER 3.0<br />
OVERVIEW OF DATA USED FOR<br />
ANALYSIS<br />
The <strong>conceptual</strong> <strong>model</strong> <strong>for</strong> <strong>organic</strong> <strong>carbon</strong> developed <strong>in</strong> this report is based largely on<br />
a database of <strong>organic</strong> <strong>carbon</strong> <strong>and</strong> o<strong>the</strong>r constituents compiled by <strong>the</strong> Dr<strong>in</strong>k<strong>in</strong>g Water<br />
Policy Workgroup <strong>in</strong> 2004-2005. Data <strong>in</strong> <strong>the</strong> database orig<strong>in</strong>ate from a variety of<br />
agricultural, urban, po<strong>in</strong>t source, <strong>and</strong> surface water monitor<strong>in</strong>g programs throughout<br />
<strong>the</strong> watersheds of <strong>the</strong> Sacramento <strong>and</strong> San Joaqu<strong>in</strong> rivers. Although it is possible that<br />
<strong>the</strong>re are analytical differences between <strong>organic</strong> <strong>carbon</strong> measurements from <strong>the</strong>se<br />
different sources, <strong>for</strong> <strong>the</strong> purpose of <strong>the</strong> large-scale evaluation that follows it is<br />
assumed that <strong>the</strong> measurements are comparable (i.e., DOC reported <strong>in</strong> different<br />
studies can be compared).<br />
This chapter provides an overview of <strong>the</strong> <strong>organic</strong> <strong>carbon</strong> data conta<strong>in</strong>ed <strong>in</strong> <strong>the</strong><br />
Dr<strong>in</strong>k<strong>in</strong>g Water Policy Database, notably <strong>the</strong> <strong>for</strong>ms measured, <strong>the</strong> quantity <strong>and</strong> spatial<br />
distribution of <strong>the</strong> data, <strong>and</strong> <strong>the</strong> concentrations observed at various stations. Data from<br />
o<strong>the</strong>r sources were used to supplement this data where needed <strong>and</strong> are discussed<br />
below <strong>and</strong> <strong>in</strong> subsequent chapters. The plots <strong>in</strong> this chapter present an <strong>in</strong><strong>for</strong>mative<br />
snapshot of <strong>the</strong> available data, <strong>and</strong> set <strong>the</strong> stage <strong>for</strong> load<strong>in</strong>g analyses <strong>in</strong> <strong>the</strong> next two<br />
chapters. Figure 3-1 illustrates key locations <strong>in</strong> <strong>the</strong> Central Valley <strong>and</strong> Delta referred<br />
to <strong>in</strong> this <strong>and</strong> subsequent chapters.<br />
April 14, 2006 3-1
Chapter 3.0<br />
Conceptual Model <strong>for</strong> Organic Carbon <strong>in</strong> <strong>the</strong> Central Valley<br />
Figure 3-1. Stream reaches <strong>and</strong> o<strong>the</strong>r key locations <strong>in</strong> <strong>the</strong> Central Valley <strong>and</strong> Delta.<br />
3-2 April 14, 2006
Conceptual Model <strong>for</strong> Organic Carbon <strong>in</strong> <strong>the</strong> Central Valley Chapter 3.0<br />
3.1 OVERVIEW OF CONCENTRATION DATA<br />
Maps show<strong>in</strong>g <strong>the</strong> distribution of data <strong>in</strong> <strong>the</strong> Central Valley are presented <strong>in</strong> Figures<br />
3-2, 3-3, <strong>and</strong> 3-4 <strong>for</strong> total <strong>and</strong> dissolved <strong>organic</strong> <strong>carbon</strong> <strong>and</strong> UV absorbance at 254<br />
nm, <strong>the</strong> only three <strong>organic</strong> <strong>carbon</strong>-related parameters <strong>in</strong> <strong>the</strong> database. Most of <strong>the</strong> data<br />
were collected along <strong>the</strong> ma<strong>in</strong> stems of <strong>the</strong> Sacramento <strong>and</strong> San Joaqu<strong>in</strong> rivers <strong>and</strong> <strong>in</strong><br />
<strong>the</strong> Delta. There were limited data <strong>for</strong> <strong>the</strong> tributaries to <strong>the</strong> Sacramento <strong>and</strong> San<br />
Joaqu<strong>in</strong> rivers. Approximately half <strong>the</strong> stations <strong>in</strong> <strong>the</strong> database (represent<strong>in</strong>g about a<br />
third of <strong>the</strong> data) had no coord<strong>in</strong>ate <strong>in</strong><strong>for</strong>mation <strong>and</strong> are not shown <strong>in</strong> <strong>the</strong>se maps; <strong>and</strong><br />
<strong>the</strong> data were not used <strong>in</strong> this analysis. Based on a spatial evaluation of <strong>the</strong> data, it<br />
appears that both DOC <strong>and</strong> TOC data are measured widely enough <strong>for</strong> watershedwide<br />
analysis, although UVA254 is not.<br />
A series of box plots was used to describe <strong>the</strong> range of <strong>organic</strong> <strong>carbon</strong> concentrations<br />
at various locations <strong>in</strong> <strong>the</strong> watershed. Figures 3-5 <strong>and</strong> 3-6 show <strong>the</strong> TOC <strong>and</strong> DOC<br />
concentrations by stations <strong>in</strong> alphabetic order, respectively. Data from wastewater<br />
effluent <strong>and</strong> from urban runoff were excluded from <strong>the</strong>se plots. Agricultural dra<strong>in</strong>age<br />
data are <strong>in</strong>cluded <strong>in</strong> <strong>the</strong>se plots, <strong>in</strong> part because it could often not be clearly<br />
dist<strong>in</strong>guished from surface water flows, especially <strong>in</strong> <strong>the</strong> San Joaqu<strong>in</strong> Valley. Both<br />
l<strong>in</strong>ear <strong>and</strong> log scales are presented because <strong>the</strong> concentrations <strong>in</strong> <strong>the</strong> Delta agricultural<br />
dra<strong>in</strong>s are an order of magnitude higher than at <strong>the</strong> o<strong>the</strong>r stations. Both plots clearly<br />
demonstrate that concentrations are substantially higher <strong>in</strong> <strong>the</strong> San Joaqu<strong>in</strong> River<br />
Bas<strong>in</strong> than <strong>in</strong> <strong>the</strong> Sacramento River Bas<strong>in</strong>. Delta agricultural dra<strong>in</strong>age conta<strong>in</strong>s <strong>the</strong><br />
highest concentrations. This is notable due to <strong>the</strong> proximity of <strong>the</strong> Delta agricultural<br />
dra<strong>in</strong>s to major dr<strong>in</strong>k<strong>in</strong>g water <strong>in</strong>takes.<br />
Figures 3-7 <strong>and</strong> 3-8 show spatial views of <strong>the</strong> TOC data <strong>and</strong> DOC data, respectively.<br />
These figures also illustrate <strong>the</strong> higher concentrations <strong>in</strong> <strong>the</strong> San Joaqu<strong>in</strong> River Bas<strong>in</strong>,<br />
which is particularly evident <strong>for</strong> TOC (Figure 3-7).<br />
Appendix A conta<strong>in</strong>s a list<strong>in</strong>g of all stations with <strong>organic</strong> <strong>carbon</strong> data, <strong>in</strong>clud<strong>in</strong>g <strong>the</strong><br />
number of data po<strong>in</strong>ts <strong>for</strong> each parameter (DOC, TOC, <strong>and</strong> UVA254), <strong>the</strong> period over<br />
which sampl<strong>in</strong>g was conducted, <strong>and</strong> whe<strong>the</strong>r coord<strong>in</strong>ate <strong>in</strong><strong>for</strong>mation is <strong>in</strong>cluded. This<br />
list<strong>in</strong>g can be used as a reference to identify <strong>the</strong> quantity of relevant data associated<br />
with specific stations <strong>in</strong> <strong>the</strong> database, particularly <strong>for</strong> future work to identify patterns<br />
at greater spatial detail than presented <strong>in</strong> this report. Review of Appendix A shows<br />
that stations with <strong>the</strong> largest number of data po<strong>in</strong>ts are those on <strong>the</strong> ma<strong>in</strong> stem of <strong>the</strong><br />
Sacramento <strong>and</strong> San Joaqu<strong>in</strong> Rivers, especially at stations near <strong>the</strong> Delta. Many<br />
locations had measurements of ei<strong>the</strong>r TOC or DOC, <strong>and</strong> data on all three parameters<br />
were available <strong>for</strong> a small number of stations. It was fur<strong>the</strong>r noted that many stations<br />
appeared <strong>in</strong> <strong>the</strong> database under different, slightly vary<strong>in</strong>g names. In subsequent<br />
analysis, such stations were merged with a set of consistent names.<br />
April 14, 2006 3-3
Chapter 3.0<br />
Conceptual Model <strong>for</strong> Organic Carbon <strong>in</strong> <strong>the</strong> Central Valley<br />
Figure 3-2. Number of TOC data po<strong>in</strong>ts at each station <strong>in</strong> <strong>the</strong> Central Valley Dr<strong>in</strong>k<strong>in</strong>g Water Policy<br />
Workgroup database.<br />
3-4 April 14, 2006
Conceptual Model <strong>for</strong> Organic Carbon <strong>in</strong> <strong>the</strong> Central Valley Chapter 3.0<br />
Figure 3-3. Number of DOC data po<strong>in</strong>ts at each station <strong>in</strong> <strong>the</strong> Central Valley Dr<strong>in</strong>k<strong>in</strong>g Water Policy<br />
Workgroup database.<br />
April 14, 2006 3-5
Chapter 3.0<br />
Conceptual Model <strong>for</strong> Organic Carbon <strong>in</strong> <strong>the</strong> Central Valley<br />
Figure 3-4. Number of UVA 254 data po<strong>in</strong>ts at each station <strong>in</strong> <strong>the</strong> Central Valley Dr<strong>in</strong>k<strong>in</strong>g Water Policy<br />
Workgroup database.<br />
3-6 April 14, 2006
Conceptual Model <strong>for</strong> Organic Carbon <strong>in</strong> <strong>the</strong> Central Valley Chapter 3.0<br />
Number of Data Po<strong>in</strong>ts<br />
Stations <strong>in</strong> Alpahabetical Order<br />
Stations<br />
American River at Discovery Park--41<br />
American River at Sacramento Water Plant--70<br />
American River below Nimbus Dam--41<br />
Barker Slough--24<br />
Bear Creek at Thornton Road--15<br />
Bear Creek near Bert Crane Road--20<br />
Calhoun Cut at Hwy 113--9<br />
Colusa Bas<strong>in</strong> Dra<strong>in</strong>--14<br />
Contra Costa PP Number 01--23<br />
Cosumnes River at Tw<strong>in</strong> Cities Road--15<br />
Deep Slough at Green House Road--19<br />
Del Puerto Creek at V<strong>in</strong>eyard Ave--15<br />
Delta Mendona Canal at L<strong>in</strong>deman Road--27<br />
Delta Is<strong>and</strong> Dra<strong>in</strong>age--316<br />
Delta Pump<strong>in</strong>g Plant Headworks--26<br />
Fea<strong>the</strong>r River near Nicolaus--13<br />
French Camp Slough at Airport Way--25<br />
Grayson Road Dra<strong>in</strong> at Grayson--15<br />
Hospital Creek at River Road--11<br />
Ingram Creek at River Road--14<br />
L<strong>in</strong>dsay Slough at Hast<strong>in</strong>gs Cut--28<br />
Lone Tree Creek at Aust<strong>in</strong> Road--22<br />
Merced River at River Road--24<br />
Middle River at Union Pt_--27<br />
Mokelumne River at New Hope Road--23<br />
Mt House Creek at Mt House Parkway--14<br />
Mud Slough at Gun Club Road--7<br />
Mud Slough at San Luis Dra<strong>in</strong>--28<br />
Mud Slough Upstream of SLD Term<strong>in</strong>us--27<br />
Natomas EMDC at El Cam<strong>in</strong>o Road--29<br />
New Jerusalem Tile Dra<strong>in</strong>--16<br />
Old River at Rancho Del Rio--27<br />
Old River at Tracy Blvd--23<br />
Old River Near Byron--34<br />
Orestimba Creek at River Road--24<br />
Pixley Slough at Davis Road--17<br />
Sacramento River above Bend Bridge--13<br />
Sacramento River above Colusa Bas<strong>in</strong> Dra<strong>in</strong>--6<br />
Sacramento River at Colusa--25<br />
Sacramento River at Freeport--74<br />
Sacramento River at Hamilton City--13<br />
Sacramento River at Hood-Greene's L<strong>and</strong><strong>in</strong>g--181<br />
Sacramento River at Mallard Isl<strong>and</strong>--51<br />
Sacramento River at Veterans Bridge--56<br />
Sacramento River at W_ Sac Intake Structure--44<br />
Sacramento Slough--14<br />
Salt Slough at Hwy 165--33<br />
Salt Slough at Wolfsen Road--6<br />
San Joaqu<strong>in</strong> River at Crows L<strong>and</strong><strong>in</strong>g--127<br />
San Joaqu<strong>in</strong> River at Freemont Ford--118<br />
San Joaqu<strong>in</strong> River at Hills Ferry--21<br />
San Joaqu<strong>in</strong> River at Hwy 132--115<br />
San Joaqu<strong>in</strong> River at Hwy 4--25<br />
San Joaqu<strong>in</strong> River at L<strong>and</strong>er Avenue--119<br />
San Joaqu<strong>in</strong> River at Patterson--119<br />
San Joaqu<strong>in</strong> River at Sack Dam--22<br />
San Joaqu<strong>in</strong> River at Vernalis--255<br />
San Joaqu<strong>in</strong> River Ship Channel @ Light 18--11<br />
San Joaqu<strong>in</strong> River Ship Channel @ Light 24--11<br />
San Joaqu<strong>in</strong> River Ship Channel @ Light 36--11<br />
San Joaqu<strong>in</strong> River Ship Channel @ Light 41--11<br />
San Joaqu<strong>in</strong> River Ship Channel @ Light 45--11<br />
San Luis Dra<strong>in</strong> at Term<strong>in</strong>us2--23<br />
Stanislaus River at Caswell Park2--21<br />
Stanislaus River at Knight's Ferry--7<br />
TID 5 Hard<strong>in</strong>g Dra<strong>in</strong> at Carpenter Road--25<br />
Tom Pa<strong>in</strong>e Slough at Paradise Road--19<br />
Tuolumne River at Shiloh--23<br />
Turner Slough at Fourth Ave--19<br />
Turn<strong>in</strong>g Bas<strong>in</strong> San Joaqu<strong>in</strong> Ship Channel--11<br />
Volta Wasteway at Ingomar Grade--7<br />
Yuba River at Marysville--14<br />
L<strong>in</strong>ear scale<br />
Log scale<br />
Notes:<br />
1) The station<br />
named American<br />
River at Sacramento<br />
Water Plant<br />
represents <strong>the</strong><br />
American River at<br />
E.A. Fairbairn Water<br />
Treatment Plant.<br />
2) L<strong>in</strong>ear scale plot<br />
cut off at 40 mg/l to<br />
show lower values.<br />
0 10 20 30 40<br />
1 10 100<br />
TOC (mg/l)<br />
TOC (mg/l)<br />
Figure 3-5. The range of TOC concentrations observed at different stations <strong>in</strong> <strong>the</strong> Central Valley <strong>and</strong> Delta.<br />
Box widths are proportional to <strong>the</strong> number of data po<strong>in</strong>ts.<br />
April 14, 2006 3-7
Chapter 3.0<br />
Conceptual Model <strong>for</strong> Organic Carbon <strong>in</strong> <strong>the</strong> Central Valley<br />
Number of Data Po<strong>in</strong>ts<br />
Stations <strong>in</strong> Alpahabetical Order<br />
Stations<br />
American River at Discovery Park--131<br />
American River at Sacramento Water Plant--129<br />
American River below Nimbus Dam--42<br />
Barker Slough--108<br />
Battle Creek at Grover Road--25<br />
Bear River at Forty Mile Road--102<br />
Cache Creek at Hwy 113--102<br />
Calaveras River at Hwy 26--86<br />
Calhoun Cut at Hwy 113--55<br />
Colusa Bas<strong>in</strong> Dra<strong>in</strong>--125<br />
Contra Costa PP Number 01--110<br />
Cosumnes River at Tw<strong>in</strong> Cities Road--65<br />
Cottonwood Creek at Cottonwood--25<br />
Cow Creek at Dersch Road--25<br />
Deer Creek at Le<strong>in</strong>iger Road--25<br />
Delta Isl<strong>and</strong> Dra<strong>in</strong>age--1419<br />
Delta Mendona Canal at L<strong>in</strong>deman Road--139<br />
Delta Pump<strong>in</strong>g Plant Headworks--138<br />
Fea<strong>the</strong>r River at Yuba City--102<br />
Fea<strong>the</strong>r River near Nicolaus--22<br />
L<strong>in</strong>dsay Slough at Hast<strong>in</strong>gs Cut--8<br />
Los Banos Creek at Hwy 140--101<br />
Ma<strong>in</strong> Dra<strong>in</strong>age at El Cam<strong>in</strong>o--89<br />
Merced River at River Road--101<br />
Middle River at Union Pt_--123<br />
Mokelumne River at New Hope Road--101<br />
Mud Slough at Gun Club Road--7<br />
Mud Slough at Kesterson--100<br />
Natomas EMDC at El Cam<strong>in</strong>o Road--39<br />
Old River at Rancho Del Rio--99<br />
Old River Near Byron--138<br />
Orestimba Creek at River Road--99<br />
Sacramento River above Bend Bridge--22<br />
Sacramento River above Colusa Bas<strong>in</strong> Dra<strong>in</strong>--6<br />
Sacramento River at Bend Ferry Road--25<br />
Sacramento River at Butte City--25<br />
Sacramento River at Colusa--25<br />
Sacramento River at Court Road--25<br />
Sacramento River at Freeport--172<br />
Sacramento River at Hamilton City--21<br />
Sacramento River at Hood-Greene's L<strong>and</strong><strong>in</strong>g--323<br />
Sacramento River at Knights L<strong>and</strong><strong>in</strong>g--102<br />
Sacramento River at Mallard Isl<strong>and</strong>--170<br />
Sacramento River at Veterans Bridge--63<br />
Sacramento River at W_ Sac Intake Structure--97<br />
Sacramento River at Woodson Bridge--23<br />
Sacramento River below Keswick--8<br />
Sacramento Slough--22<br />
Sacramento Slough at Karnack--25<br />
Salt Slough at Hwy 165--103<br />
Salt Slough at Wolfsen Road--7<br />
San Joaqu<strong>in</strong> River at Crows L<strong>and</strong><strong>in</strong>g--26<br />
San Joaqu<strong>in</strong> River at Hwy 120--89<br />
San Joaqu<strong>in</strong> River at Hwy 132--101<br />
San Joaqu<strong>in</strong> River at Hwy 165--101<br />
San Joaqu<strong>in</strong> River at Hwy 4--48<br />
San Joaqu<strong>in</strong> River at Laird Park--18<br />
San Joaqu<strong>in</strong> River at Patterson--89<br />
San Joaqu<strong>in</strong> River at Vernalis--328<br />
San Joaqu<strong>in</strong> River upstream of Merced--15<br />
San Luis Dra<strong>in</strong> at Term<strong>in</strong>us1--91<br />
Stanislaus River at Caswell Park1--91<br />
Stanislaus River at Road J6--10<br />
Stony Creek at Orl<strong>and</strong>--25<br />
Tuolumne River at Shiloh--101<br />
Volta Wasteway at Ingomar Grade--7<br />
Yuba River at Marysville--23<br />
Yuba River at Simpson Lane--102<br />
L<strong>in</strong>ear scale<br />
Stations<br />
Log scale<br />
Notes:<br />
1) The station<br />
named American<br />
River at Sacramento<br />
Water Plant<br />
represents <strong>the</strong><br />
American River at<br />
E.A. Fairbairn Water<br />
Treatment Plant.<br />
2) L<strong>in</strong>ear scale plot<br />
cut off at 30 mg/l to<br />
show lower values.<br />
0 5 10 15 20 25 30<br />
1 10 100<br />
DOC (mg/l)<br />
DOC (mg/l)<br />
Figure 3-6. The range of DOC concentrations observed at different stations <strong>in</strong> <strong>the</strong> Central Valley <strong>and</strong> Delta.<br />
Box widths are proportional to <strong>the</strong> number of data po<strong>in</strong>ts.<br />
3-8 April 14, 2006
Conceptual Model <strong>for</strong> Organic Carbon <strong>in</strong> <strong>the</strong> Central Valley Chapter 3.0<br />
Figure 3-7. TOC concentrations <strong>in</strong> <strong>the</strong> Central Valley <strong>and</strong> Delta.<br />
April 14, 2006 3-9
Chapter 3.0<br />
Conceptual Model <strong>for</strong> Organic Carbon <strong>in</strong> <strong>the</strong> Central Valley<br />
Figure 3-8. DOC concentrations <strong>in</strong> <strong>the</strong> Central Valley <strong>and</strong> Delta.<br />
3-10 April 14, 2006
Conceptual Model <strong>for</strong> Organic Carbon <strong>in</strong> <strong>the</strong> Central Valley Chapter 3.0<br />
There are good correlations between DOC <strong>and</strong> TOC <strong>and</strong> between DOC <strong>and</strong> UVA254<br />
(Figure 3-9 <strong>and</strong> 3-10) over <strong>the</strong> entire range of concentrations. However, over <strong>the</strong><br />
range of concentrations of most <strong>in</strong>terest <strong>in</strong> surface waters, i.e., less than 20 mg/l, <strong>the</strong><br />
correlations appear weaker, particularly between DOC <strong>and</strong> UVA254. UVA254 has<br />
been has been related to aromaticity of <strong>organic</strong> <strong>carbon</strong> <strong>and</strong> THMFP (see Chapter 2).<br />
These data call <strong>for</strong> measurements of all three parameters wherever possible, <strong>and</strong> are<br />
consistent with past reports that suggest <strong>organic</strong> <strong>carbon</strong> from multiple sources is less<br />
likely to have a clear DOC-UVA254 relationship.<br />
8<br />
DOC <strong>and</strong> UVA 254<br />
6<br />
UVA 254 (1/cm)<br />
4<br />
2<br />
0<br />
0 20 40 60 80 100 120<br />
DOC (mg/l)<br />
2.0<br />
DOC <strong>and</strong> UVA 254<br />
Reduced Scale<br />
1.5<br />
UVA 254 (1/cm)<br />
1.0<br />
0.5<br />
0.0<br />
0 5 10 15 20<br />
DOC (mg/l)<br />
Figure 3-9. DOC <strong>and</strong> UVA254 at all stations <strong>in</strong> <strong>the</strong> database where contemporaneous measurements<br />
were available.<br />
April 14, 2006 3-11
Chapter 3.0<br />
Conceptual Model <strong>for</strong> Organic Carbon <strong>in</strong> <strong>the</strong> Central Valley<br />
140<br />
120<br />
DOC vs TOC at all Stations<br />
100<br />
TOC (mg/l)<br />
80<br />
60<br />
40<br />
20<br />
0<br />
0 20 40 60 80 100 120 140<br />
DOC (mg/l)<br />
20<br />
DOC vs TOC at all Stations<br />
Reduced Scale<br />
15<br />
TOC (mg/l)<br />
10<br />
5<br />
0<br />
0 5 10 15 20<br />
DOC (mg/l)<br />
Figure 3-10. DOC <strong>and</strong> TOC at all stations <strong>in</strong> <strong>the</strong> database where contemporaneous measurements were<br />
available.<br />
3-12 April 14, 2006
Conceptual Model <strong>for</strong> Organic Carbon <strong>in</strong> <strong>the</strong> Central Valley Chapter 3.0<br />
Trends along <strong>the</strong> ma<strong>in</strong> stem of <strong>the</strong> two major rivers were exam<strong>in</strong>ed through box plots.<br />
Figure 3-11 <strong>and</strong> 3-12 show <strong>the</strong> TOC concentrations by station mov<strong>in</strong>g from upstream<br />
to downstream <strong>for</strong> <strong>the</strong> Sacramento <strong>and</strong> San Joaqu<strong>in</strong> Rivers. An <strong>in</strong>terest<strong>in</strong>g <strong>and</strong><br />
contrast<strong>in</strong>g trend emerges. The Sacramento River concentrations <strong>in</strong>crease from<br />
upstream to downstream, possibly due to <strong>the</strong> addition of <strong>organic</strong> <strong>carbon</strong> from<br />
anthropogenic (human) sources. In <strong>the</strong> San Joaqu<strong>in</strong> River (downstream of Sack<br />
Dam), concentrations first <strong>in</strong>crease <strong>the</strong>n decrease as <strong>the</strong> river flows downstream.<br />
Immediately downstream of Sack Dam, <strong>the</strong> river is dom<strong>in</strong>ated by agricultural<br />
dra<strong>in</strong>age which is diluted as <strong>the</strong> river flows downstream by flows from o<strong>the</strong>r sources<br />
with lower concentrations, pr<strong>in</strong>cipally <strong>the</strong> tributaries on <strong>the</strong> east side of <strong>the</strong> <strong>valley</strong>.<br />
10<br />
TOC <strong>in</strong> Sacramento River<br />
8<br />
TOC (mg/l)<br />
6<br />
4<br />
2<br />
0<br />
Sack Dam - 23<br />
L<strong>and</strong>er Avenue - 120<br />
Freemont Ford - 119<br />
Hills Ferry - 22<br />
Crows L<strong>and</strong><strong>in</strong>g - 128<br />
Patterson - 120<br />
Hwy 132 - 116<br />
Vernalis - 256<br />
Hwy 4 - 26<br />
Figure 3-11. TOC at various locations <strong>in</strong> Sacramento River. The number of data po<strong>in</strong>ts is shown after<br />
each station name.<br />
April 14, 2006 3-13
Chapter 3.0<br />
Conceptual Model <strong>for</strong> Organic Carbon <strong>in</strong> <strong>the</strong> Central Valley<br />
30<br />
TOC <strong>in</strong> San Joaqu<strong>in</strong> River<br />
25<br />
20<br />
TOC (mg/l)<br />
15<br />
10<br />
5<br />
0<br />
Sack Dam - 23<br />
L<strong>and</strong>er Avenue - 120<br />
Freemont Ford - 119<br />
Hills Ferry - 22<br />
Crows L<strong>and</strong><strong>in</strong>g - 128<br />
Patterson - 120<br />
Hwy 132 - 116<br />
Vernalis - 256<br />
Hwy 4 - 26<br />
Ship Channel-Light 45 - 12<br />
Ship Channel-Light 41 - 12<br />
Ship Channel-Light 36 - 12<br />
Ship Channel-Light 24 - 12<br />
Ship Channel-Light 18 - 12<br />
San Joaqu<strong>in</strong> River Downstream<br />
Figure 3-12. TOC at various locations <strong>in</strong> San Joaqu<strong>in</strong> River. The number of data po<strong>in</strong>ts is shown after<br />
each station name.<br />
Seasonal patterns <strong>in</strong> concentration can also be explored through box plots as shown <strong>in</strong><br />
Figures 3-13 <strong>and</strong> 3-14. In each of <strong>the</strong> figures, three plots display concentrations at<br />
locations mov<strong>in</strong>g downstream. As with <strong>the</strong> previous set of figures, <strong>the</strong>re are important<br />
differences between <strong>the</strong> Sacramento <strong>and</strong> San Joaqu<strong>in</strong> Bas<strong>in</strong>s. In <strong>the</strong> Sacramento<br />
River, <strong>the</strong> highest concentrations are associated with <strong>the</strong> wet months, with relatively<br />
lower concentrations <strong>in</strong> <strong>the</strong> dry months. Mov<strong>in</strong>g downstream, <strong>the</strong> seasonal variation<br />
of data decreases, as evidenced by greater uni<strong>for</strong>mity of concentrations at Mallard<br />
Isl<strong>and</strong> than at Freeport. In <strong>the</strong> San Joaqu<strong>in</strong> River, <strong>the</strong> highest concentrations are<br />
observed <strong>in</strong> <strong>the</strong> dry months when <strong>the</strong> flows are dom<strong>in</strong>ated by agricultural dra<strong>in</strong>age.<br />
Organic <strong>carbon</strong> concentrations <strong>in</strong> <strong>the</strong> San Joaqu<strong>in</strong> River are substantially higher than<br />
<strong>in</strong> <strong>the</strong> Sacramento River.<br />
3-14 April 14, 2006
Conceptual Model <strong>for</strong> Organic Carbon <strong>in</strong> <strong>the</strong> Central Valley Chapter 3.0<br />
7<br />
6<br />
Sacramento River at Freeport<br />
TOC (mg/l)<br />
5<br />
4<br />
3<br />
2<br />
1<br />
0<br />
Jan (9)<br />
Feb (10)<br />
Mar (5)<br />
Apr (6)<br />
May (7)<br />
Jun (5)<br />
Jul (6)<br />
Aug (7)<br />
Sep (4)<br />
Oct (5)<br />
Nov (6)<br />
Dec (8)<br />
7<br />
6<br />
Sacramento River at Hood-Greene's L<strong>and</strong><strong>in</strong>g<br />
TOC (mg/l)<br />
5<br />
4<br />
3<br />
2<br />
1<br />
0<br />
7<br />
6<br />
Sacramento River at Mallard Isl<strong>and</strong><br />
TOC (mg/l)<br />
Jan (5)<br />
Feb (5)<br />
Mar (5)<br />
Apr (5)<br />
May (5)<br />
Jun (5)<br />
Jul (3)<br />
Aug (3)<br />
Sep (3)<br />
Oct (4)<br />
Nov (4)<br />
Dec (4)<br />
Jan (15)<br />
Feb (26)<br />
Mar (21)<br />
Apr (15)<br />
May (15)<br />
Jun (15)<br />
Jul (12)<br />
Aug (14)<br />
Sep (15)<br />
Oct (12)<br />
Nov (11)<br />
Dec (10)<br />
5<br />
4<br />
3<br />
2<br />
1<br />
0<br />
Month<br />
Figure 3-13. Temporal variation <strong>in</strong> concentrations at key locations <strong>in</strong> <strong>the</strong> Sacramento River. The number<br />
of data po<strong>in</strong>ts is shown after each month.<br />
April 14, 2006 3-15
Chapter 3.0<br />
Conceptual Model <strong>for</strong> Organic Carbon <strong>in</strong> <strong>the</strong> Central Valley<br />
30<br />
25<br />
San Joaqu<strong>in</strong> River at L<strong>and</strong>er Ave<br />
TOC (mg/l)<br />
20<br />
15<br />
10<br />
5<br />
0<br />
San Joaqu<strong>in</strong> River at Crows L<strong>and</strong><strong>in</strong>g<br />
30<br />
25<br />
San Joaqu<strong>in</strong> River at Vernalis<br />
Jan (15)<br />
Feb (18)<br />
Mar (25)<br />
Apr (22)<br />
May (28)<br />
Jun (27)<br />
Jul (18)<br />
Aug (20)<br />
Sep (19)<br />
Oct (23)<br />
Nov (21)<br />
Dec (19)<br />
Jan (4)<br />
Feb (5)<br />
Mar (13)<br />
Apr (12)<br />
TOC (mg/l)<br />
May (16)<br />
Jun (14)<br />
Jul (11)<br />
Aug (13)<br />
Sep (7)<br />
Oct (13)<br />
Nov (10)<br />
Dec (10)<br />
Jan (5)<br />
Feb (6)<br />
Mar (12)<br />
Apr (13)<br />
May (16)<br />
Jun (14)<br />
Jul (9)<br />
Aug (10)<br />
Sep (4)<br />
Oct (10)<br />
Nov (10)<br />
Dec (10)<br />
30<br />
25<br />
20<br />
15<br />
10<br />
5<br />
0<br />
TOC (mg/l)<br />
20<br />
15<br />
10<br />
5<br />
0<br />
Month<br />
Figure 3-14. Temporal variation <strong>in</strong> TOC concentrations at key locations <strong>in</strong> San Joaqu<strong>in</strong> River. The<br />
number of data po<strong>in</strong>ts is shown after each month.<br />
3-16 April 14, 2006
Conceptual Model <strong>for</strong> Organic Carbon <strong>in</strong> <strong>the</strong> Central Valley Chapter 3.0<br />
3.2 ADDITIONAL DATA USED<br />
In addition to <strong>the</strong> values <strong>in</strong> <strong>the</strong> database discussed above, some additional sources of<br />
<strong>in</strong><strong>for</strong>mation were also ga<strong>the</strong>red <strong>for</strong> this analysis. This <strong>in</strong>cludes flow data, which are<br />
used <strong>in</strong> comb<strong>in</strong>ation with concentration data to estimate loads, <strong>and</strong> some additional<br />
chemistry data. The data described below refer specifically to data that were<br />
manipulated <strong>and</strong>/or analyzed <strong>for</strong> <strong>the</strong> purpose of this work. Analyses presented by<br />
o<strong>the</strong>r authors <strong>in</strong> published papers <strong>and</strong> reports are cited throughout this report.<br />
3.2.1 FLOW DATA<br />
The USGS has an extensive network of flow monitor<strong>in</strong>g stations throughout<br />
Cali<strong>for</strong>nia (Figure 3-15). Daily stream discharge data were obta<strong>in</strong>ed from <strong>the</strong> United<br />
States Geological Survey (USGS) from<br />
http://nwis.waterdata.usgs.gov/usa/nwis/discharge at selected locations <strong>for</strong> which<br />
loads were estimated. These locations primarily corresponded to <strong>the</strong> outflow locations<br />
of <strong>the</strong> major tributaries of <strong>the</strong> Sacramento <strong>and</strong> San Joaqu<strong>in</strong> Rivers. A detailed<br />
evaluation of <strong>the</strong> flow data is presented <strong>in</strong> Appendix B. Additional flow data <strong>for</strong> <strong>the</strong><br />
Delta region (<strong>in</strong>clud<strong>in</strong>g outflows <strong>in</strong> municipal/<strong>in</strong>dustrial <strong>in</strong>takes) were obta<strong>in</strong>ed from<br />
a computer <strong>model</strong> called DAYFLOW (supported by Cali<strong>for</strong>nia Department of Water<br />
Resources, <strong>and</strong> available electronically from<br />
http://www.iep.ca.gov/dayflow/<strong>in</strong>dex.html). DAYFLOW uses historical pump<strong>in</strong>g<br />
records where available, <strong>and</strong> this data is <strong>in</strong> <strong>the</strong> most convenient <strong>for</strong>m <strong>for</strong> use <strong>and</strong><br />
manipulation. Load estimates us<strong>in</strong>g <strong>the</strong> USGS <strong>and</strong> DAYFLOW values are presented<br />
<strong>in</strong> Chapters 4 <strong>and</strong> 5.<br />
3.2.2 CHEMISTRY DATA<br />
A major additional source of chemistry data was <strong>the</strong> Municipal Water Quality<br />
Investigations (MWQI) Program, from which data was obta<strong>in</strong>ed electronically <strong>for</strong> this<br />
task from http://wdl10.water.ca.gov/wq/mwqi/mwqimap.cfm. MWQI data through<br />
2000 were <strong>in</strong>cluded <strong>in</strong> <strong>the</strong> Dr<strong>in</strong>k<strong>in</strong>g Water Policy Database; however, data from 2000<br />
to <strong>the</strong> present were entered <strong>in</strong>to DWR’s Water Data Library. The MWQI Program<br />
obta<strong>in</strong>s grab sample data on TOC, DOC, <strong>and</strong> UVA254 at 10 locations around <strong>the</strong><br />
Delta. Limited data were also obta<strong>in</strong>ed from <strong>the</strong> MWQI real time monitor<strong>in</strong>g program<br />
at selected locations around <strong>the</strong> Delta (http://wq.water.ca.gov/mwq/toc/tocpage.htm).<br />
O<strong>the</strong>r chemistry data sources <strong>in</strong>cluded a database of USGS <strong>and</strong> EPA data compiled<br />
<strong>for</strong> <strong>the</strong> purpose of evaluat<strong>in</strong>g <strong>organic</strong> <strong>carbon</strong> loads <strong>in</strong> <strong>the</strong> Central Valley (Saleh, et al.,<br />
2003). Additional data from MWQI <strong>and</strong> Saleh et al. (2003) are <strong>in</strong>cluded <strong>in</strong> <strong>the</strong> data<br />
summary provided <strong>in</strong> Appendix A.<br />
April 14, 2006 3-17
Chapter 3.0<br />
Conceptual Model <strong>for</strong> Organic Carbon <strong>in</strong> <strong>the</strong> Central Valley<br />
Figure 3-15. Stations with cont<strong>in</strong>uous flow records available through <strong>the</strong> USGS (on <strong>the</strong> <strong>in</strong>ternet at<br />
http://nwis.waterdata.usgs.gov/usa/nwis/discharge). Flow records <strong>for</strong> different stations exist<br />
over different time periods.<br />
3-18 April 14, 2006
Conceptual Model <strong>for</strong> Organic Carbon <strong>in</strong> <strong>the</strong> Central Valley Chapter 3.0<br />
3.3 MAJOR FINDINGS<br />
The vast majority of <strong>the</strong> <strong>organic</strong> <strong>carbon</strong> data <strong>in</strong> <strong>the</strong> database, compiled by <strong>the</strong> Central<br />
Valley Dr<strong>in</strong>k<strong>in</strong>g Water Policy Workgroup, consisted of measurements of TOC, DOC,<br />
<strong>and</strong> UVA at 254 nm. Most stations reported one or two of <strong>the</strong>se parameters, with very<br />
few report<strong>in</strong>g all three. Data on o<strong>the</strong>r parameters, such as THMFP, were not present<br />
<strong>in</strong> this database. Po<strong>in</strong>t source data on <strong>organic</strong> <strong>carbon</strong> were limited to three wastewater<br />
treatment plants. Flow data were not part of <strong>the</strong> database <strong>and</strong> were obta<strong>in</strong>ed from<br />
o<strong>the</strong>r publicly available sources.<br />
Most of <strong>the</strong> data are collected <strong>in</strong> <strong>and</strong> near <strong>the</strong> Delta, with relatively limited sampl<strong>in</strong>g<br />
<strong>in</strong> <strong>the</strong> upper portions of <strong>the</strong> watershed. There was very little <strong>in</strong><strong>for</strong>mation on <strong>the</strong><br />
<strong>organic</strong> <strong>carbon</strong> concentrations <strong>in</strong> reservoir releases, although reservoirs <strong>and</strong> <strong>the</strong>ir<br />
upstream watersheds toge<strong>the</strong>r comprise a large portion of <strong>the</strong> overall watershed area.<br />
Box plots provided a quick summary of <strong>the</strong> available data, <strong>and</strong> showed clearly <strong>the</strong><br />
elevated DOC/TOC concentrations <strong>in</strong> <strong>the</strong> San Joaqu<strong>in</strong> Bas<strong>in</strong> <strong>and</strong> <strong>in</strong> <strong>the</strong> Delta<br />
agricultural dra<strong>in</strong>s. At most locations, much of <strong>the</strong> TOC is present as DOC, although<br />
<strong>the</strong> percentage varies by location <strong>and</strong> by season. The Sacramento <strong>and</strong> San Joaqu<strong>in</strong><br />
Rivers show <strong>in</strong>terest<strong>in</strong>g trends, with <strong>the</strong> <strong>for</strong>mer exhibit<strong>in</strong>g <strong>the</strong> highest concentrations<br />
<strong>in</strong> wet months, <strong>and</strong> <strong>the</strong> latter <strong>the</strong> highest concentrations <strong>in</strong> dry months.<br />
April 14, 2006 3-19
CHAPTER 4.0<br />
LOADS TRANSPORTED FROM<br />
SACRAMENTO AND SAN JOAQUIN<br />
RIVER BASINS<br />
Estimation of transported loads of <strong>organic</strong> <strong>carbon</strong> with<strong>in</strong> <strong>the</strong> Central Valley provides<br />
a prelim<strong>in</strong>ary underst<strong>and</strong><strong>in</strong>g of <strong>the</strong> major tributary sources dur<strong>in</strong>g different seasons<br />
<strong>and</strong> dur<strong>in</strong>g wet <strong>and</strong> dry years. The tributary sources mix with o<strong>the</strong>r Delta sources, <strong>and</strong><br />
undergo various trans<strong>for</strong>mation reactions that are reflected <strong>in</strong> <strong>the</strong> observed<br />
concentrations at Delta dr<strong>in</strong>k<strong>in</strong>g water <strong>in</strong>takes. The <strong>in</strong><strong>for</strong>mation on tributary <strong>organic</strong><br />
<strong>carbon</strong> concentrations <strong>and</strong> loads, comb<strong>in</strong>ed with Delta <strong>model</strong>s relat<strong>in</strong>g <strong>the</strong> tributary<br />
sources to <strong>the</strong> dr<strong>in</strong>k<strong>in</strong>g water <strong>in</strong>takes, can be used to evaluate options <strong>for</strong> improv<strong>in</strong>g<br />
<strong>organic</strong> <strong>carbon</strong> concentrations at <strong>the</strong> Delta <strong>in</strong>takes. In<strong>for</strong>mation on tributary <strong>organic</strong><br />
<strong>carbon</strong> loads at various locations <strong>in</strong> <strong>the</strong> Sacramento <strong>and</strong> San Joaqu<strong>in</strong> bas<strong>in</strong>s can be<br />
used to evaluate options <strong>for</strong> improv<strong>in</strong>g <strong>organic</strong> <strong>carbon</strong> concentrations at water <strong>in</strong>takes<br />
upstream of <strong>the</strong> Delta. This chapter presents <strong>the</strong> results of calculations to estimate<br />
loads at various locations <strong>in</strong> <strong>the</strong> Central Valley, us<strong>in</strong>g total <strong>organic</strong> <strong>carbon</strong> or<br />
dissolved <strong>organic</strong> <strong>carbon</strong> concentration data summarized <strong>in</strong> Chapter 3, <strong>and</strong> us<strong>in</strong>g flow<br />
data from USGS stations near <strong>the</strong> concentration monitor<strong>in</strong>g stations.<br />
Evaluation of load at a po<strong>in</strong>t <strong>in</strong> a stream <strong>in</strong>volves estimation of loads transported <strong>in</strong>stream<br />
<strong>and</strong> also <strong>in</strong>volves estimation of <strong>the</strong> watershed contributions. The basic<br />
approach to calculat<strong>in</strong>g loads at a po<strong>in</strong>t <strong>in</strong> a stream is simple: daily flow multiplied by<br />
concentration can provide an estimate of daily flux, which summed over a year or a<br />
season, provides an estimate of <strong>the</strong> transported load. In general, flow data are<br />
available <strong>in</strong> much greater abundance than chemical concentration data, <strong>and</strong> <strong>the</strong><br />
commonly used approach is to estimate concentrations <strong>for</strong> <strong>the</strong> days dur<strong>in</strong>g which<br />
<strong>the</strong>re are no measured concentration values. This is commonly done by develop<strong>in</strong>g a<br />
correlation between flows <strong>and</strong> concentrations <strong>and</strong> sometimes <strong>in</strong>clud<strong>in</strong>g variables <strong>for</strong><br />
time (e.g., Craw<strong>for</strong>d, 1991; Cohn et al., 1992; Haggard et al., 2003; Saleh et al.,<br />
April 14, 2006 4-1
Chapter 4.0<br />
Conceptual Model <strong>for</strong> Organic Carbon <strong>in</strong> <strong>the</strong> Central Valley<br />
2003). This approach could not be used <strong>for</strong> this study because, based on available<br />
data, <strong>the</strong>re were no statistically significant relationships between <strong>organic</strong> <strong>carbon</strong><br />
concentration <strong>and</strong> flow at any of <strong>the</strong> locations monitored <strong>in</strong> <strong>the</strong> watersheds. The<br />
Central Valley <strong>and</strong> Delta system is a highly managed system with flows controlled by<br />
major reservoirs on most rivers.<br />
The method used <strong>for</strong> this study was to multiply average monthly concentration data<br />
by average monthly flows to obta<strong>in</strong> monthly loads, which were <strong>the</strong>n summed to<br />
obta<strong>in</strong> ei<strong>the</strong>r seasonal or annual loads. As described later <strong>in</strong> this chapter, <strong>the</strong> amount<br />
of concentration data varied from location to location, so <strong>the</strong> confidence <strong>in</strong> <strong>the</strong> load<br />
estimates also varies.<br />
The watershed correspond<strong>in</strong>g to any location <strong>in</strong> a stream is typically comprised of<br />
many different l<strong>and</strong> uses (e.g., <strong>for</strong>ested l<strong>and</strong>, urban l<strong>and</strong>, cropl<strong>and</strong>, etc.) <strong>and</strong> a<br />
common approach to estimate <strong>the</strong> watershed load is to attribute a chemical export rate<br />
(measured <strong>in</strong> units of mass per unit area per unit time) <strong>for</strong> each type of l<strong>and</strong> use<br />
(Boyer et al., 2000; Wetzel, 2001). The total load contribution from <strong>the</strong> watershed can<br />
be estimated as <strong>the</strong> contribution of <strong>the</strong> <strong>in</strong>dividual l<strong>and</strong> uses weighted by <strong>the</strong>ir export<br />
rates. This general approach has been employed to develop a summary picture of<br />
<strong>organic</strong> <strong>carbon</strong> loads <strong>in</strong> <strong>the</strong> Central Valley. As discussed later <strong>in</strong> this chapter, <strong>the</strong>re<br />
were limited data on <strong>the</strong> export rates from different l<strong>and</strong> uses so <strong>the</strong>se load estimates<br />
are considered prelim<strong>in</strong>ary <strong>in</strong> nature.<br />
The follow<strong>in</strong>g sections describe <strong>the</strong> division of <strong>the</strong> Central Valley <strong>in</strong>to a set of smaller<br />
subwatersheds, a summary of water flows correspond<strong>in</strong>g to this division, <strong>the</strong><br />
estimation of transported loads <strong>in</strong> streams at key locations throughout <strong>the</strong> Central<br />
Valley, estimation of export rates from key l<strong>and</strong> uses, <strong>and</strong> <strong>the</strong> comparison of<br />
watershed loads with stream transported loads.<br />
4.1 SUBWATERSHEDS<br />
The Central Valley was divided <strong>in</strong>to 22 subwatersheds to represent <strong>the</strong> major<br />
tributaries <strong>and</strong> <strong>the</strong> major reaches of <strong>the</strong> Sacramento <strong>and</strong> San Joaqu<strong>in</strong> Rivers (Figure<br />
4-1). The subwatersheds were del<strong>in</strong>eated based on <strong>the</strong> availability of flow <strong>and</strong><br />
concentration data as well as natural watershed boundaries. The outflow po<strong>in</strong>ts of<br />
<strong>the</strong>se subwatersheds were used to compute loads. The division of <strong>the</strong> 43,300 square<br />
mile Central Valley region <strong>in</strong>to <strong>the</strong>se subwatersheds allows <strong>for</strong> an improved spatial<br />
resolution of <strong>the</strong> sources of loads over a scenario <strong>in</strong> which <strong>the</strong> Sacramento <strong>and</strong> San<br />
Joaqu<strong>in</strong> Rivers were treated as s<strong>in</strong>gle watersheds. Although a f<strong>in</strong>er resolution is<br />
possible, i.e., by consideration of still smaller tributaries <strong>and</strong> smaller subwatersheds,<br />
<strong>the</strong> exist<strong>in</strong>g division shown <strong>in</strong> Figure 4-1 was considered appropriate <strong>for</strong> a <strong>conceptual</strong><br />
<strong>model</strong>, <strong>and</strong> was <strong>the</strong> smallest scale supported by available data. The watershed<br />
del<strong>in</strong>eations shown <strong>in</strong> Figure 4-1 were per<strong>for</strong>med us<strong>in</strong>g Geographic In<strong>for</strong>mation<br />
System (GIS) software (ArcGiS 8, ESRI, Redl<strong>and</strong>s, Cali<strong>for</strong>nia).<br />
4-2 April 14, 2006
Conceptual Model <strong>for</strong> Organic Carbon <strong>in</strong> <strong>the</strong> Central Valley Chapter 4.0<br />
Figure 4-1. Sub-watersheds associated with pr<strong>in</strong>cipal tributaries<br />
April 14, 2006 4-3
Chapter 4.0<br />
Conceptual Model <strong>for</strong> Organic Carbon <strong>in</strong> <strong>the</strong> Central Valley<br />
Ano<strong>the</strong>r approach to <strong>the</strong> watershed del<strong>in</strong>eation would be to consider only <strong>the</strong> portion<br />
of <strong>the</strong> Central Valley below <strong>the</strong> reservoirs, <strong>and</strong> consider <strong>the</strong> reservoirs as def<strong>in</strong><strong>in</strong>g <strong>the</strong><br />
boundary of <strong>the</strong> region of <strong>in</strong>terest. This approach has <strong>the</strong> benefit of implicitly def<strong>in</strong><strong>in</strong>g<br />
reservoir loads as a background source, with o<strong>the</strong>r added downstream loads be<strong>in</strong>g<br />
considered anthropogenic. However, because <strong>the</strong>re are limited data on <strong>the</strong><br />
concentrations of <strong>organic</strong> <strong>carbon</strong> released from <strong>the</strong> reservoirs, this approach was not<br />
used <strong>in</strong> this study. The discussion of loads that follows <strong>in</strong> this chapter is thus based on<br />
<strong>the</strong> watersheds <strong>in</strong> Figure 4-1, although future ref<strong>in</strong>ements of this <strong>conceptual</strong> <strong>model</strong><br />
could consider <strong>the</strong> reservoirs to be upstream boundaries to <strong>the</strong> system.<br />
The l<strong>and</strong> use correspond<strong>in</strong>g to each subwatershed was estimated us<strong>in</strong>g a detailed GISbased<br />
l<strong>and</strong> use map of Cali<strong>for</strong>nia (obta<strong>in</strong>ed from http://gis.ca.gov/). The l<strong>and</strong> use map<br />
was developed by <strong>the</strong> Cali<strong>for</strong>nia Department of Forestry <strong>and</strong> Fire Protection (CDF-<br />
FRAP) by compil<strong>in</strong>g <strong>the</strong> best available l<strong>and</strong> cover data <strong>in</strong>to a s<strong>in</strong>gle data layer.<br />
Typically <strong>the</strong> most current <strong>and</strong> detailed data were collected <strong>for</strong> various regions of <strong>the</strong><br />
state or <strong>for</strong> unique mapp<strong>in</strong>g ef<strong>for</strong>ts (farml<strong>and</strong>, wetl<strong>and</strong>s, riparian vegetation). A view<br />
of <strong>the</strong> l<strong>and</strong> uses <strong>in</strong> <strong>the</strong> Central Valley is shown <strong>in</strong> Figure 4-2. The percent of each<br />
subwatershed area by l<strong>and</strong> use is summarized <strong>in</strong> Table 4-1.<br />
Figure 4-3 illustrates a schematic of <strong>the</strong> Central Valley watershed show<strong>in</strong>g average<br />
TOC concentrations (or DOC concentrations where TOC is not available) whose<br />
magnitude is <strong>in</strong>dicated by arrow size. As discussed earlier <strong>in</strong> Chapter 3, <strong>the</strong> figure<br />
illustrates that <strong>organic</strong> <strong>carbon</strong> concentrations are higher <strong>in</strong> <strong>the</strong> San Joaqu<strong>in</strong> River<br />
Bas<strong>in</strong> than <strong>in</strong> <strong>the</strong> Sacramento River Bas<strong>in</strong>.<br />
4-4 April 14, 2006
Conceptual Model <strong>for</strong> Organic Carbon <strong>in</strong> <strong>the</strong> Central Valley Chapter 4.0<br />
Figure 4-2. L<strong>and</strong> use <strong>in</strong> <strong>the</strong> Central Valley. Data obta<strong>in</strong>ed from obta<strong>in</strong>ed from http://gis.ca.gov/.<br />
April 14, 2006 4-5
Chapter 4.0 Conceptual Model <strong>for</strong> Organic Carbon <strong>in</strong> <strong>the</strong> Central Valley<br />
Table 4-1.<br />
Percentage of l<strong>and</strong> use <strong>in</strong> different categories <strong>for</strong> each subwatershed. L<strong>and</strong> use data of Cali<strong>for</strong>nia obta<strong>in</strong>ed from http://gis.ca.gov/.<br />
ID 1 Watershed Name<br />
1<br />
Sacramento River above Bend<br />
Bridge<br />
Shrub Agriculture Herbaceous Hardwood Barren Conifer Water Urban<br />
22.4% 4.0% 4.8% 15.4% 1.1% 49.8% 1.5% 1.0%<br />
2 Butte Creek 3.2% 41.1% 16.4% 12.3% 0.2% 21.7% 1.6% 3.5%<br />
3 Sacramento River at Colusa 12.4% 23.1% 28.0% 19.2% 0.5% 14.2% 0.9% 1.7%<br />
4 Yuba River 5.7% 1.3% 3.4% 16.1% 3.4% 67.1% 1.8% 1.2%<br />
5 Fea<strong>the</strong>r River 9.8% 9.1% 6.3% 7.8% 0.6% 61.9% 2.8% 1.7%<br />
6 Cache Creek 35.0% 11.4% 10.3% 24.1% 0.4% 10.5% 6.0% 2.3%<br />
7 American River 8.3% 0.8% 5.7% 15.1% 3.1% 54.4% 2.0% 10.6%<br />
8<br />
Sacramento River at<br />
Hood/Greene’s L<strong>and</strong><strong>in</strong>g<br />
0.7% 63.7% 17.5% 8.1% 0.0% 0.2% 1.1% 8.7%<br />
9 Cosumnes River 4.0% 12.0% 29.5% 22.0% 0.1% 28.8% 0.5% 3.0%<br />
10 San Joaqu<strong>in</strong> River at Newman 1.6% 44.1% 42.6% 7.8% 0.0% 0.0% 2.3% 1.7%<br />
11 Stanislaus River 8.6% 11.9% 14.5% 11.1% 6.7% 41.1% 2.4% 3.5%<br />
12 Tuolumne River 10.3% 3.8% 11.5% 13.2% 10.2% 46.7% 2.5% 1.8%<br />
13 Merced River 14.7% 6.7% 11.6% 15.2% 5.8% 44.6% 1.1% 0.4%<br />
14<br />
Bear Cr/Owens Cr/Mariposa<br />
Cr/Deadmans Cr<br />
3.9% 31.5% 43.7% 16.5% 0.0% 0.5% 0.3% 3.7%<br />
15 Chowchilla River 6.9% 16.6% 22.9% 42.7% 0.0% 9.6% 0.3% 1.0%<br />
16<br />
San Joaqu<strong>in</strong> River at Sack<br />
Dam<br />
2.9% 35.1% 17.9% 10.5% 6.2% 22.0% 1.2% 4.2%<br />
17 Mokelumne River 5.9% 16.0% 15.3% 16.3% 3.5% 38.7% 2.2% 2.1%<br />
18 Bear River 1.8% 13.6% 18.6% 33.0% 0.6% 26.1% 1.3% 4.9%<br />
19 Putah Creek 30.0% 9.6% 13.2% 31.9% 0.2% 7.9% 5.1% 2.0%<br />
20 Delta North 1.0% 58.0% 28.3% 2.2% 0.1% 0.0% 2.1% 8.3%<br />
21 Delta South 3.9% 40.0% 29.6% 10.6% 0.1% 6.5% 1.9% 7.4%<br />
22 San Joaqu<strong>in</strong> River at Vernalis 9.6% 51.9% 21.9% 11.9% 0.0% 0.0% 0.1% 4.6%<br />
1 Refer to Figure 4-1 <strong>for</strong> <strong>the</strong> location of subwatersheds.<br />
4-6 April 14, 2006
Conceptual Model <strong>for</strong> Organic Carbon <strong>in</strong> <strong>the</strong> Central Valley Chapter 4.0<br />
Figure 4-3. Average <strong>organic</strong> <strong>carbon</strong> concentrations <strong>in</strong> <strong>the</strong> sub-watersheds (TOC unless noted).<br />
April 14, 2006 4-7
Chapter 4.0<br />
Conceptual Model <strong>for</strong> Organic Carbon <strong>in</strong> <strong>the</strong> Central Valley<br />
4.2 WATER FLOWS IN THE CENTRAL VALLEY<br />
Because loads <strong>in</strong> streams are a product of flow <strong>and</strong> concentration, <strong>and</strong> flows can vary<br />
<strong>in</strong> a given stream by orders of magnitude dur<strong>in</strong>g different seasons of <strong>the</strong> year,<br />
estimated loads are a strong function of flow. As a first step <strong>in</strong> <strong>the</strong> evaluation of<br />
<strong>organic</strong> <strong>carbon</strong> loads, daily flow values were obta<strong>in</strong>ed from nearby USGS stations at<br />
locations correspond<strong>in</strong>g to <strong>the</strong> subwatersheds identified <strong>in</strong> Figure 4-1. Table 4-2<br />
shows <strong>the</strong> USGS stations (names <strong>and</strong> IDs) that correspond with <strong>the</strong> stations <strong>in</strong> <strong>the</strong><br />
database developed <strong>for</strong> this project. Annual <strong>and</strong> seasonal flows were calculated us<strong>in</strong>g<br />
<strong>the</strong>se data. In several subwatersheds, <strong>the</strong>re are no flow <strong>and</strong>/or concentration data. In<br />
<strong>the</strong>se cases, <strong>organic</strong> <strong>carbon</strong> loads were estimated us<strong>in</strong>g watershed export rates<br />
described below.<br />
Detailed descriptions of <strong>the</strong> flows at all locations that were used <strong>for</strong> this work are<br />
provided <strong>in</strong> Appendix B. This <strong>in</strong>cludes classification of years as wet or dry, <strong>and</strong> plots<br />
of flows <strong>in</strong> <strong>the</strong> wet <strong>and</strong> dry seasons of wet <strong>and</strong> dry years. Water years classified by<br />
<strong>the</strong> Cali<strong>for</strong>nia Department of Water Resources as below normal, dry, or critical, are<br />
termed dry, <strong>and</strong> water years termed above normal or wet are termed wet. The wet<br />
season is def<strong>in</strong>ed as October 1 to April 30 <strong>and</strong> <strong>the</strong> dry season is def<strong>in</strong>ed as May 1 to<br />
September 30. Summary <strong>in</strong><strong>for</strong>mation on flows is provided graphically on a schematic<br />
of <strong>the</strong> Central Valley watershed. Flows <strong>in</strong> <strong>the</strong> dry <strong>and</strong> wet season of a typical dry year<br />
(2002) are shown <strong>in</strong> Figure 4-4, <strong>and</strong> flows <strong>in</strong> <strong>the</strong> dry <strong>and</strong> wet season of a wet year<br />
(2003) are shown <strong>in</strong> Figure 4-5. Both figures use <strong>the</strong> same l<strong>in</strong>ear scale to represent<br />
flows <strong>and</strong> can be used to compare values across seasons <strong>and</strong> years. The Sacramento<br />
River flows are substantially higher than <strong>the</strong> San Joaqu<strong>in</strong> River flows, with wet<br />
season flows exceed<strong>in</strong>g dry season flows.<br />
4-8 April 14, 2006
Conceptual Model <strong>for</strong> Organic Carbon <strong>in</strong> <strong>the</strong> Central Valley Chapter 4.0<br />
Table 4-2.<br />
Subdivision of watersheds <strong>in</strong> <strong>the</strong> Central Valley, nearby stations with concentration data <strong>in</strong> <strong>the</strong> Central Valley Dr<strong>in</strong>k<strong>in</strong>g Water Policy Workgroup<br />
database, <strong>and</strong> USGS stations with cont<strong>in</strong>uous flow data<br />
ID Watershed Name Area (km 2 ) Area (mi 2 ) Station Name <strong>in</strong> Dr<strong>in</strong>k<strong>in</strong>g Water Database<br />
1 Sacramento River above Bend Bridge 23,145 8,934 Sacramento River above Bend Bridge 11377100<br />
Nearest<br />
USGS<br />
Gauge<br />
Station 1 Name of USGS Gage Station<br />
SACRAMENTO R AB BEND<br />
BRIDGE NR RED BLUFF CA<br />
2 Butte Creek 2,402 927 -- 11390000 BUTTE C NR CHICO CA<br />
3 Sacramento River at Colusa 11,261 4,347 Sacramento River at Colusa 11389500<br />
SACRAMENTO R A COLUSA<br />
CA<br />
4 Yuba River 3,502 1,352 Yuba River at Marysville 11421000 YUBA R NR MARYSVILLE CA<br />
5 Fea<strong>the</strong>r River 2 9,995 3,858 Fea<strong>the</strong>r River Near Nicolaus 11425000<br />
FEATHER RIVER NEAR<br />
NICOLAUS CA<br />
6 Cache Creek 3,112 1,201 Cache Creek at Hwy 113 11452500 CACHE C A YOLO CA<br />
7 American River 5,528 2,134 American River at Discovery Park 11446500 AMERICAN R A FAIR OAKS CA<br />
8 Sacramento River at Hood/Greene's L<strong>and</strong><strong>in</strong>g 3 4,256 1,643 Sacramento River at Hood<br />
Sacramento River at Greene's L<strong>and</strong><strong>in</strong>g<br />
11447810<br />
9 Cosumnes River 2,390 922 Cosumnes River at Tw<strong>in</strong> Cities Road 11335000<br />
10 San Joaqu<strong>in</strong> River at Newman 4,170 1,610 San Joaqu<strong>in</strong> River at Crows L<strong>and</strong><strong>in</strong>g 11274000<br />
SACRAMENTO R A GREENS<br />
LANDING CA<br />
COSUMNES R A MICHIGAN<br />
BAR CA<br />
SAN JOAQUIN R A NEWMAN<br />
CA<br />
11 Stanislaus River 3,478 1,343 Stanislaus River at Caswell Park 11303000 STANISLAUS R A RIPON CA<br />
12 Tuolumne River 4,586 1,770 Tuolumne River at Shiloh 11290000 TUOLUMNE R A MODESTO CA<br />
13 Merced River 3,290 1,270 Merced River at River Road 11272500 MERCED R A STEVINSON<br />
14 Bear Cr/Owens Cr/Mariposa Cr/Deadmans Cr 2,397 925 -- -- --<br />
15 Chowchilla River 850 328 -- -- --<br />
16 San Joaqu<strong>in</strong> River at Sack Dam 11,667 4,504 San Joaqu<strong>in</strong> River at Sack Dam 11254000<br />
17 Mokelumne River 3,022 1,167 Mokelumne River at New Hope Road 11325500<br />
SAN JOAQUIN R NR MENDOTA<br />
CA<br />
MOKELUMNE R A<br />
WOODBRIDGE CA<br />
18 Bear River 1,229 475 Bear River at Forty Mile Road 11424000 BEAR R NR WHEATLAND CA<br />
19 Putah Creek 1,795 693 -- 11454210<br />
PUTAH SOUTH CN NR<br />
WINTERS CA<br />
20 Delta North 2,148 829 -- -- --<br />
21 Delta South 5,730 2,212 -- -- --<br />
22 San Joaqu<strong>in</strong> River at Vernalis 2,344 905 San Joaqu<strong>in</strong> River at Vernalis 11303500<br />
SAN JOAQUIN R NR VERNALIS<br />
CA<br />
Total Watershed Area 112,297 43,347<br />
1<br />
Flow data USGS website (http://nwis.waterdata.usgs.gov/usa/nwis/discharge), unless o<strong>the</strong>rwise noted.<br />
2<br />
Flow data from Saleh et al., 2003.<br />
3<br />
Flow data from DWR's DAYFLOW <strong>model</strong>.<br />
April 14, 2006 4-9
Chapter 4.0 Conceptual Model <strong>for</strong> Organic Carbon <strong>in</strong> <strong>the</strong> Central Valley<br />
Figure 4-4. Flows <strong>in</strong> <strong>the</strong> dry <strong>and</strong> wet season of 2002 (a dry year) on a schematic representation of <strong>the</strong> San Joaqu<strong>in</strong>-Sacramento River systems.<br />
4-10 April 14, 2006
Conceptual Model <strong>for</strong> Organic Carbon <strong>in</strong> <strong>the</strong> Central Valley Chapter 4.0<br />
Figure 4-5. Flows <strong>in</strong> <strong>the</strong> dry <strong>and</strong> wet season of 2003 (a wet year) on a schematic representation of <strong>the</strong> San Joaqu<strong>in</strong>-Sacramento River systems.<br />
April 14, 2006 4-11
Chapter 4.0<br />
Conceptual Model <strong>for</strong> Organic Carbon <strong>in</strong> <strong>the</strong> Central Valley<br />
4.3 ESTIMATION OF TRANSPORTED LOADS IN STREAMS<br />
Organic <strong>carbon</strong> concentration data were limited at most locations whereas cont<strong>in</strong>uous<br />
records of flow data were often, though not always, available. Organic <strong>carbon</strong> data<br />
were especially limited at many upstream locations.<br />
For this study, <strong>the</strong> average monthly concentration <strong>and</strong> <strong>the</strong> average monthly flow are<br />
multiplied to get monthly <strong>and</strong> annual loads, as <strong>in</strong> Jassby <strong>and</strong> Cloern (2000). If one or<br />
more concentration values were available <strong>for</strong> a specific month of a given year (i.e.,<br />
January 1995), <strong>the</strong> average of data <strong>for</strong> that month was used. If data were not available<br />
<strong>for</strong> a specific month <strong>and</strong> year but were available <strong>for</strong> <strong>the</strong> same month of any year, <strong>the</strong>n<br />
<strong>the</strong> average of that data was used (i.e., <strong>the</strong> average of all January values). If <strong>the</strong>re<br />
were no data at all <strong>for</strong> a given month, <strong>the</strong>n an estimate was made us<strong>in</strong>g data <strong>for</strong><br />
months be<strong>for</strong>e <strong>and</strong> after it (i.e., if <strong>the</strong>re were no January data, <strong>the</strong>n <strong>the</strong> average of<br />
December <strong>and</strong> February data was used). When no TOC data were reported, DOC was<br />
used to approximate TOC. Due to <strong>the</strong> limitations <strong>in</strong> <strong>the</strong> data, <strong>the</strong> load estimates <strong>for</strong> a<br />
number of locations are considered prelim<strong>in</strong>ary. The limited concentration data<br />
<strong>in</strong>troduced a fair amount of uncerta<strong>in</strong>ty <strong>in</strong>to <strong>the</strong> analysis due to <strong>the</strong> follow<strong>in</strong>g factors:<br />
• Grab sample data collected monthly or less frequently do not adequately<br />
characterize <strong>organic</strong> <strong>carbon</strong> concentrations, particularly dur<strong>in</strong>g <strong>the</strong> wet season.<br />
• The assumption that data from a month <strong>in</strong> one year could be used to estimate<br />
<strong>organic</strong> <strong>carbon</strong> concentrations <strong>for</strong> <strong>the</strong> same month <strong>in</strong> ano<strong>the</strong>r year assumes<br />
that <strong>the</strong>re is not year to year variability <strong>in</strong> <strong>the</strong> data. Based on <strong>in</strong>tensive<br />
monitor<strong>in</strong>g <strong>in</strong> <strong>the</strong> Sacramento River at Hood, variability is seen <strong>in</strong> <strong>the</strong> data (as<br />
presented <strong>in</strong> Chapter 5, Figures 5-7 <strong>and</strong> 5-9).<br />
• For months <strong>for</strong> which <strong>the</strong>re are no data, averages of <strong>the</strong> prior <strong>and</strong> next month<br />
were used. This assumes more consistency <strong>in</strong> <strong>the</strong> concentration data than<br />
actually exists, based on <strong>the</strong> <strong>in</strong>tensive monitor<strong>in</strong>g.<br />
Monthly TOC loads were estimated us<strong>in</strong>g <strong>the</strong> entire record of daily flow data at<br />
selected stations, <strong>and</strong> <strong>the</strong> average monthly concentration values generated as<br />
described previously. The monthly loads were used to calculate seasonal <strong>and</strong> annual<br />
loads at <strong>the</strong> outflow po<strong>in</strong>ts of <strong>the</strong> subwatersheds shown <strong>in</strong> Figure 4-1. Loads were<br />
estimated <strong>for</strong> all but five subwatersheds where no concentration data were available:<br />
<strong>the</strong> Bear, Owens, Mariposa Creeks (def<strong>in</strong>ed as one composite subwatershed <strong>in</strong> Figure<br />
4-1), Chowchilla River, Putah Creek, <strong>and</strong> <strong>the</strong> Delta North <strong>and</strong> Delta South<br />
subwatersheds. Figures 4-6 to 4-21 present <strong>the</strong> average monthly <strong>organic</strong> <strong>carbon</strong><br />
concentrations (<strong>in</strong>clud<strong>in</strong>g data count), <strong>the</strong> daily discharge, <strong>and</strong> <strong>the</strong> wet <strong>and</strong> dry season<br />
<strong>organic</strong> <strong>carbon</strong> loads by water year <strong>for</strong> key locations throughout <strong>the</strong> watershed. These<br />
figures illustrate <strong>the</strong> extent of available data <strong>and</strong> <strong>the</strong> time period of <strong>the</strong> record. Data<br />
from water year 1980 <strong>and</strong> beyond were used to reflect l<strong>and</strong> use conditions that are<br />
reasonably representative of current conditions. For ease of comparison across<br />
stations, <strong>the</strong> time scale <strong>in</strong> all figures extends from 1980 to 2005. For <strong>the</strong> stations on<br />
<strong>the</strong> ma<strong>in</strong> stems of <strong>the</strong> Sacramento <strong>and</strong> San Joaqu<strong>in</strong> Rivers, particularly stations near<br />
<strong>the</strong> Delta, both flow <strong>and</strong> concentration data are collected at a reasonable frequency.<br />
Stations on <strong>the</strong> tributaries have more limited concentration data. Most stations have<br />
4-12 April 14, 2006
Conceptual Model <strong>for</strong> Organic Carbon <strong>in</strong> <strong>the</strong> Central Valley Chapter 4.0<br />
enough flow data to allow estimation of loads <strong>for</strong> at least 10 years between 1980 <strong>and</strong><br />
2005 except <strong>for</strong> <strong>the</strong> Fea<strong>the</strong>r River, Mokelumne River, Merced River, <strong>and</strong> San Joaqu<strong>in</strong><br />
River at Sack Dam.<br />
Exports of <strong>organic</strong> <strong>carbon</strong> from <strong>the</strong> Yolo Bypass <strong>and</strong> from <strong>the</strong> Delta to San Francisco<br />
Bay were also computed. Flows were obta<strong>in</strong>ed from <strong>the</strong> DAYFLOW <strong>model</strong> discussed<br />
<strong>in</strong> greater detail <strong>in</strong> Chapter 5. Due to lack of data from any previously discussed<br />
source, concentration data <strong>for</strong> <strong>the</strong> Yolo Bypass was obta<strong>in</strong>ed from Schemel et al.,<br />
2002. Like <strong>the</strong> tributary stations, monthly averages of <strong>the</strong> flows <strong>and</strong> <strong>organic</strong> <strong>carbon</strong><br />
data were calculated, <strong>and</strong> used to estimate monthly, <strong>the</strong>n seasonal <strong>and</strong> annual loads<br />
(Figures 4-22 <strong>and</strong> 4-23 <strong>for</strong> <strong>the</strong> Yolo Bypass <strong>and</strong> Delta outflows, respectively).<br />
April 14, 2006 4-13
Chapter 4.0<br />
Conceptual Model <strong>for</strong> Organic Carbon <strong>in</strong> <strong>the</strong> Central Valley<br />
5<br />
Sacramento River above Bend Bridge<br />
Average TOC (mg/l)<br />
4<br />
3<br />
2<br />
1<br />
0<br />
Jan (1)<br />
Feb (2)<br />
Mar (1)<br />
Apr (1)<br />
May (2)<br />
Jun<br />
Jul (1)<br />
Aug<br />
Sep (2)<br />
Oct (1)<br />
Nov (2)<br />
Dec<br />
Month<br />
140000<br />
120000<br />
Sacramento River above Bend Bridge<br />
Daily Flow, cfs<br />
100000<br />
80000<br />
60000<br />
40000<br />
20000<br />
0<br />
1980 1985 1990 1995 2000 2005<br />
Year<br />
50000<br />
Sacramento River above Bend Bridge<br />
40000<br />
TOC Load, tons<br />
30000<br />
20000<br />
Dry Season<br />
Wet Season<br />
10000<br />
0<br />
1980 1985 1990 1995 2000 2005<br />
Water Year<br />
Figure 4-6. Monthly average concentration, daily discharge, <strong>and</strong> estimated wet <strong>and</strong> dry season loads by<br />
water year <strong>for</strong> Sacramento River above Bend Bridge.<br />
4-14 April 14, 2006
Conceptual Model <strong>for</strong> Organic Carbon <strong>in</strong> <strong>the</strong> Central Valley Chapter 4.0<br />
3.5<br />
3.0<br />
Sacramento River at Colusa<br />
Average TOC (mg/l)<br />
2.5<br />
2.0<br />
1.5<br />
1.0<br />
0.5<br />
0.0<br />
Jan (1)<br />
Feb (8)<br />
Mar (7)<br />
Apr (1)<br />
May (2)<br />
Jun<br />
Jul (1)<br />
Aug<br />
Sep (2)<br />
Oct (1)<br />
Nov (2)<br />
Dec<br />
Month<br />
60000<br />
50000<br />
Sacramento River at Colusa<br />
Daily Flow, cfs<br />
40000<br />
30000<br />
20000<br />
10000<br />
0<br />
1980 1985 1990 1995 2000 2005<br />
Year<br />
50000<br />
Sacramento River at Colusa<br />
TOC Load, tons<br />
40000<br />
30000<br />
20000<br />
Dry Season<br />
Wet Season<br />
10000<br />
0<br />
1980 1985 1990 1995 2000 2005<br />
Water Year<br />
Figure 4-7. Monthly average concentration, daily discharge, <strong>and</strong> estimated wet <strong>and</strong> dry season loads by<br />
water year <strong>for</strong> Sacramento River at Colusa.<br />
April 14, 2006 4-15
Chapter 4.0<br />
Conceptual Model <strong>for</strong> Organic Carbon <strong>in</strong> <strong>the</strong> Central Valley<br />
3.0<br />
Yuba River<br />
2.5<br />
Average TOC (mg/l)<br />
2.0<br />
1.5<br />
1.0<br />
0.5<br />
0.0<br />
Jan (1)<br />
Feb (2)<br />
Mar (2)<br />
Apr (1)<br />
May (2)<br />
Jun<br />
Jul (1)<br />
Aug<br />
Sep (2)<br />
Oct (1)<br />
Nov (2)<br />
Dec<br />
Month<br />
160000<br />
140000<br />
Yuba River<br />
120000<br />
Daily Flow, cfs<br />
100000<br />
80000<br />
60000<br />
40000<br />
20000<br />
0<br />
1980 1985 1990 1995 2000 2005<br />
Year<br />
10000<br />
8000<br />
Yuba River<br />
Dry Season<br />
Wet Season<br />
TOC Load, tons<br />
6000<br />
4000<br />
2000<br />
0<br />
1980 1985 1990 1995 2000 2005<br />
Water Year<br />
Figure 4-8.<br />
Monthly average concentration, daily discharge, <strong>and</strong> estimated wet <strong>and</strong> dry season loads by<br />
water year <strong>for</strong> <strong>the</strong> Yuba River.<br />
4-16 April 14, 2006
Conceptual Model <strong>for</strong> Organic Carbon <strong>in</strong> <strong>the</strong> Central Valley Chapter 4.0<br />
3.5<br />
3.0<br />
Bear River<br />
Average DOC (mg/l)<br />
2.5<br />
2.0<br />
1.5<br />
1.0<br />
0.5<br />
0.0<br />
Jan (8)<br />
Feb (8)<br />
Mar (8)<br />
Apr (10)<br />
May (10)<br />
Jun (8)<br />
Jul (8)<br />
Aug (8)<br />
Sep (8)<br />
Oct (11)<br />
Nov (7)<br />
Dec (8)<br />
Month<br />
40000<br />
Bear River<br />
30000<br />
Daily Flow, cfs<br />
20000<br />
10000<br />
0<br />
1980 1985 1990 1995 2000 2005<br />
Year<br />
3000<br />
2500<br />
Bear River<br />
Dry Season<br />
Wet Season<br />
DOC Load, tons<br />
2000<br />
1500<br />
1000<br />
500<br />
0<br />
1980 1985 1990 1995 2000 2005<br />
Water Year<br />
Figure 4-9. Monthly average concentration, daily discharge, <strong>and</strong> estimated wet <strong>and</strong> dry season loads by<br />
water year <strong>for</strong> <strong>the</strong> Bear River.<br />
April 14, 2006 4-17
Chapter 4.0<br />
Conceptual Model <strong>for</strong> Organic Carbon <strong>in</strong> <strong>the</strong> Central Valley<br />
3.5<br />
3.0<br />
Fea<strong>the</strong>r River<br />
Average TOC (mg/l)<br />
2.5<br />
2.0<br />
1.5<br />
1.0<br />
0.5<br />
0.0<br />
Jan (3)<br />
Feb (4)<br />
Mar (3)<br />
Apr (8)<br />
May (4)<br />
Jun (4)<br />
Jul (3)<br />
Aug (3)<br />
Sep (4)<br />
Oct (4)<br />
Nov (3)<br />
Dec (3)<br />
Month<br />
350000<br />
300000<br />
Fea<strong>the</strong>r River<br />
Daily Flow, cfs<br />
250000<br />
200000<br />
150000<br />
100000<br />
50000<br />
0<br />
1980 1985 1990 1995 2000 2005<br />
Year<br />
40000<br />
Fea<strong>the</strong>r River<br />
TOC Load, tons<br />
30000<br />
20000<br />
10000<br />
Dry Season<br />
Wet Season<br />
0<br />
1980 1985 1990 1995 2000 2005<br />
Water Year<br />
Figure 4-10. Monthly average concentration, daily discharge, <strong>and</strong> estimated wet <strong>and</strong> dry season loads by<br />
water year <strong>for</strong> <strong>the</strong> Fea<strong>the</strong>r River.<br />
4-18 April 14, 2006
Conceptual Model <strong>for</strong> Organic Carbon <strong>in</strong> <strong>the</strong> Central Valley Chapter 4.0<br />
5<br />
American River<br />
Average TOC (mg/l)<br />
4<br />
3<br />
2<br />
1<br />
0<br />
Jan (4)<br />
Feb (4)<br />
Mar (4)<br />
Apr (3)<br />
May (3)<br />
Jun (3)<br />
Jul (1)<br />
Aug (4)<br />
Sep (3)<br />
Oct (2)<br />
Nov (3)<br />
Dec (4)<br />
Month<br />
140000<br />
120000<br />
American River<br />
Daily Flow, cfs<br />
100000<br />
80000<br />
60000<br />
40000<br />
20000<br />
0<br />
1980 1985 1990 1995 2000 2005<br />
Year<br />
TOC Load, tons<br />
20000<br />
18000<br />
16000<br />
14000<br />
12000<br />
10000<br />
8000<br />
6000<br />
4000<br />
2000<br />
American River<br />
Dry Season<br />
Wet Season<br />
0<br />
1980 1985 1990 1995 2000 2005<br />
Water Year<br />
Figure 4-11. Monthly average concentration, daily discharge, <strong>and</strong> estimated wet <strong>and</strong> dry season loads by<br />
water year <strong>for</strong> <strong>the</strong> American River.<br />
April 14, 2006 4-19
Chapter 4.0<br />
Conceptual Model <strong>for</strong> Organic Carbon <strong>in</strong> <strong>the</strong> Central Valley<br />
4<br />
Sacramento River at Hood/Greene's L<strong>and</strong><strong>in</strong>g<br />
Average TOC (mg/l)<br />
3<br />
2<br />
1<br />
0<br />
Jan (47)<br />
Feb (64)<br />
Mar (69)<br />
Apr (67)<br />
May (72)<br />
Jun (73)<br />
Jul (45)<br />
Aug (50)<br />
Sep (55)<br />
Oct (47)<br />
Nov (35)<br />
Dec (36)<br />
Month<br />
140000<br />
120000<br />
Sacramento River at Hood/Greene's L<strong>and</strong><strong>in</strong>g<br />
Daily Flow, cfs<br />
100000<br />
80000<br />
60000<br />
40000<br />
20000<br />
0<br />
1980 1985 1990 1995 2000 2005<br />
Year<br />
100000<br />
Sacramento River at Hood/Greene's L<strong>and</strong><strong>in</strong>g<br />
TOC Load, tons<br />
80000<br />
60000<br />
40000<br />
Dry Season<br />
Wet Season<br />
20000<br />
0<br />
1980 1985 1990 1995 2000 2005<br />
Water Year<br />
Figure 4-12. Monthly average concentration, daily discharge, <strong>and</strong> estimated wet <strong>and</strong> dry season loads by<br />
water year <strong>for</strong> Sacramento River at Hood/Greene’s L<strong>and</strong><strong>in</strong>g.<br />
4-20 April 14, 2006
Conceptual Model <strong>for</strong> Organic Carbon <strong>in</strong> <strong>the</strong> Central Valley Chapter 4.0<br />
4<br />
Cache Creek<br />
Average DOC (mg/l)<br />
3<br />
2<br />
1<br />
0<br />
Jan (8)<br />
Feb (8)<br />
Mar (9)<br />
Apr (9)<br />
May (10)<br />
Jun (8)<br />
Jul (8)<br />
Aug (8)<br />
Sep (8)<br />
Oct (11)<br />
Nov (7)<br />
Dec (8)<br />
Month<br />
30000<br />
25000<br />
Cache Creek<br />
Daily Flow, cfs<br />
20000<br />
15000<br />
10000<br />
5000<br />
0<br />
1980 1985 1990 1995 2000 2005<br />
Year<br />
6000<br />
5000<br />
Cache Creek<br />
Dry Season<br />
Wet Season<br />
DOC Load, tons<br />
4000<br />
3000<br />
2000<br />
1000<br />
0<br />
1980 1985 1990 1995 2000 2005<br />
Water Year<br />
Figure 4-13. Monthly average concentration, daily discharge, <strong>and</strong> estimated wet <strong>and</strong> dry season loads by<br />
water year <strong>for</strong> Cache Creek.<br />
April 14, 2006 4-21
Chapter 4.0<br />
Conceptual Model <strong>for</strong> Organic Carbon <strong>in</strong> <strong>the</strong> Central Valley<br />
7<br />
6<br />
San Joaqu<strong>in</strong> River at Sack Dam<br />
Average TOC (mg/l)<br />
5<br />
4<br />
3<br />
2<br />
1<br />
0<br />
Jan (2)<br />
Feb (1)<br />
Mar (1)<br />
Apr (2)<br />
May (3)<br />
Jun (3)<br />
Jul (1)<br />
Aug (1)<br />
Sep (1)<br />
Oct (2)<br />
Nov (2)<br />
Dec (2)<br />
Month<br />
700<br />
600<br />
San Joaqu<strong>in</strong> River at Sack Dam<br />
Daily Flow, cfs<br />
500<br />
400<br />
300<br />
200<br />
100<br />
0<br />
1980 1985 1990 1995 2000 2005<br />
Year<br />
TOC Load, tons<br />
1200<br />
1000<br />
800<br />
600<br />
400<br />
San Joaqu<strong>in</strong> River at Sack Dam<br />
Dry Season<br />
Wet Season<br />
200<br />
0<br />
1980 1985 1990 1995 2000 2005<br />
Water Year<br />
Figure 4-14. Monthly average concentration, daily discharge, <strong>and</strong> estimated wet <strong>and</strong> dry season loads by<br />
water year <strong>for</strong> San Joaqu<strong>in</strong> River at Sack Dam.<br />
4-22 April 14, 2006
Conceptual Model <strong>for</strong> Organic Carbon <strong>in</strong> <strong>the</strong> Central Valley Chapter 4.0<br />
3.5<br />
3.0<br />
Merced River<br />
Average TOC (mg/l)<br />
2.5<br />
2.0<br />
1.5<br />
1.0<br />
0.5<br />
0.0<br />
Jan<br />
Feb<br />
Mar (1)<br />
Apr (1)<br />
May (3)<br />
Jun (3)<br />
Jul<br />
Aug<br />
Sep<br />
Oct (1)<br />
Nov (1)<br />
Dec (2)<br />
Month<br />
1600<br />
1400<br />
Merced River<br />
1200<br />
Daily Flow, cfs<br />
1000<br />
800<br />
600<br />
400<br />
200<br />
0<br />
1980 1985 1990 1995 2000 2005<br />
Year<br />
800<br />
Merced River<br />
TOC Load, tons<br />
600<br />
400<br />
200<br />
Dry Season<br />
Wet Season<br />
0<br />
1980 1985 1990 1995 2000 2005<br />
Water Year<br />
Figure 4-15. Monthly average concentration, daily discharge, <strong>and</strong> estimated wet <strong>and</strong> dry season loads by<br />
water year <strong>for</strong> Merced River.<br />
April 14, 2006 4-23
Chapter 4.0<br />
Conceptual Model <strong>for</strong> Organic Carbon <strong>in</strong> <strong>the</strong> Central Valley<br />
10<br />
San Joaqu<strong>in</strong> River Near Newman<br />
Average TOC (mg/l)<br />
8<br />
6<br />
4<br />
2<br />
0<br />
Jan (4)<br />
Feb (5)<br />
Mar (11)<br />
Apr (7)<br />
May (12)<br />
Jun (11)<br />
Jul (6)<br />
Aug (9)<br />
Sep (7)<br />
Oct (13)<br />
Nov (8)<br />
Dec (10)<br />
Month<br />
40000<br />
San Joaqu<strong>in</strong> River Near Newman<br />
30000<br />
Daily Flow, cfs<br />
20000<br />
10000<br />
0<br />
1980 1985 1990 1995 2000 2005<br />
Year<br />
80000<br />
San Joaqu<strong>in</strong> River Near Newman<br />
Dry Season<br />
Wet Season<br />
60000<br />
TOC Load, tons<br />
40000<br />
20000<br />
0<br />
1980 1985 1990 1995 2000 2005<br />
Water Year<br />
Figure 4-16. Monthly average concentration, daily discharge, <strong>and</strong> estimated wet <strong>and</strong> dry season loads by<br />
water year <strong>for</strong> San Joaqu<strong>in</strong> River near Newman.<br />
4-24 April 14, 2006
Conceptual Model <strong>for</strong> Organic Carbon <strong>in</strong> <strong>the</strong> Central Valley Chapter 4.0<br />
7<br />
6<br />
Tuolumne River<br />
Average TOC (mg/l)<br />
5<br />
4<br />
3<br />
2<br />
1<br />
0<br />
Jan (1)<br />
Feb (2)<br />
Mar<br />
Apr (3)<br />
May (4)<br />
Jun (4)<br />
Jul (1)<br />
Aug (1)<br />
Sep (1)<br />
Oct (1)<br />
Nov (1)<br />
Dec (3)<br />
Month<br />
60000<br />
50000<br />
Tuolumne River<br />
Daily Flow, cfs<br />
40000<br />
30000<br />
20000<br />
10000<br />
0<br />
1980 1985 1990 1995 2000 2005<br />
Year<br />
TOC Load, tons<br />
18000<br />
16000<br />
14000<br />
12000<br />
10000<br />
8000<br />
6000<br />
4000<br />
2000<br />
Tuolumne River<br />
Dry Season<br />
Wet Season<br />
0<br />
1980 1985 1990 1995 2000 2005<br />
Water Year<br />
Figure 4-17. Monthly average concentration, daily discharge, <strong>and</strong> estimated wet <strong>and</strong> dry season loads by<br />
water year <strong>for</strong> Tuolumne River.<br />
April 14, 2006 4-25
Chapter 4.0<br />
Conceptual Model <strong>for</strong> Organic Carbon <strong>in</strong> <strong>the</strong> Central Valley<br />
7<br />
6<br />
Stanislaus River<br />
Average TOC (mg/l)<br />
5<br />
4<br />
3<br />
2<br />
1<br />
0<br />
Jan<br />
Feb<br />
Mar<br />
Apr (3)<br />
May (4)<br />
Jun (4)<br />
Jul (1)<br />
Aug (1)<br />
Sep (1)<br />
Oct (2)<br />
Nov (1)<br />
Dec (3)<br />
Month<br />
8000<br />
Stanislaus River<br />
6000<br />
Daily Flow, cfs<br />
4000<br />
2000<br />
0<br />
1980 1985 1990 1995 2000 2005<br />
Year<br />
7000<br />
6000<br />
Stanislaus River<br />
Dry Season<br />
Wet Season<br />
TOC Load, tons<br />
5000<br />
4000<br />
3000<br />
2000<br />
1000<br />
0<br />
1980 1985 1990 1995 2000 2005<br />
Water Year<br />
Figure 4-18. Monthly average concentration, daily discharge, <strong>and</strong> estimated wet <strong>and</strong> dry season loads by<br />
water year <strong>for</strong> Stanislaus River.<br />
4-26 April 14, 2006
Conceptual Model <strong>for</strong> Organic Carbon <strong>in</strong> <strong>the</strong> Central Valley Chapter 4.0<br />
5<br />
San Joaqu<strong>in</strong> River at Vernalis<br />
Average TOC (mg/l)<br />
4<br />
3<br />
2<br />
1<br />
0<br />
Jan (15)<br />
Feb (18)<br />
Mar (23)<br />
Apr (18)<br />
May (24)<br />
Jun (24)<br />
Jul (14)<br />
Aug (18)<br />
Sep (20)<br />
Oct (23)<br />
Nov (19)<br />
Dec (19)<br />
Month<br />
60000<br />
50000<br />
San Joaqu<strong>in</strong> River at Vernalis<br />
Daily Flow, cfs<br />
40000<br />
30000<br />
20000<br />
10000<br />
0<br />
1980 1985 1990 1995 2000 2005<br />
Year<br />
100000<br />
80000<br />
San Joaqu<strong>in</strong> River at Vernalis<br />
Dry Season<br />
Wet Season<br />
TOC Load, tons<br />
60000<br />
40000<br />
20000<br />
0<br />
1980 1985 1990 1995 2000 2005<br />
Water Year<br />
Figure 4-19. Monthly average concentration, daily discharge, <strong>and</strong> estimated wet <strong>and</strong> dry season loads by<br />
water year <strong>for</strong> San Joaqu<strong>in</strong> River at Vernalis.<br />
April 14, 2006 4-27
Chapter 4.0<br />
Conceptual Model <strong>for</strong> Organic Carbon <strong>in</strong> <strong>the</strong> Central Valley<br />
Average TOC (mg/l)<br />
12<br />
10<br />
8<br />
6<br />
4<br />
2<br />
Consumnes River<br />
0<br />
Jan (1)<br />
Feb (1)<br />
Mar (2)<br />
Apr (2)<br />
May (2)<br />
Jun (2)<br />
Jul<br />
Aug<br />
Sep<br />
Oct (1)<br />
Nov (1)<br />
Dec (2)<br />
Month<br />
70000<br />
60000<br />
Cosumnes River<br />
Daily Flow, cfs<br />
50000<br />
40000<br />
30000<br />
20000<br />
10000<br />
0<br />
1980 1985 1990 1995 2000 2005<br />
Year<br />
6000<br />
5000<br />
Cosumnes River<br />
Dry Season<br />
Wet Season<br />
TOC Load, tons<br />
4000<br />
3000<br />
2000<br />
1000<br />
0<br />
1980 1985 1990 1995 2000 2005<br />
Water Year<br />
Figure 4-20. Monthly average concentration, daily discharge, <strong>and</strong> estimated wet <strong>and</strong> dry season loads by<br />
water year <strong>for</strong> Cosumnes River.<br />
4-28 April 14, 2006
Conceptual Model <strong>for</strong> Organic Carbon <strong>in</strong> <strong>the</strong> Central Valley Chapter 4.0<br />
5<br />
Mokelumne River<br />
Average TOC (mg/l)<br />
4<br />
3<br />
2<br />
1<br />
0<br />
Jan (1)<br />
Feb<br />
Mar (2)<br />
Apr (2)<br />
May (2)<br />
Jun (4)<br />
Jul (1)<br />
Aug (2)<br />
Sep (2)<br />
Oct (2)<br />
Nov (3)<br />
Dec (2)<br />
Month<br />
6000<br />
5000<br />
Mokelumne River<br />
Daily Flow, cfs<br />
4000<br />
3000<br />
2000<br />
1000<br />
0<br />
1980 1985 1990 1995 2000 2005<br />
Year<br />
4000<br />
Mokelumne River<br />
TOC Load, tons<br />
3000<br />
2000<br />
1000<br />
Dry Season<br />
Wet Season<br />
0<br />
1980 1985 1990 1995 2000 2005<br />
Water Year<br />
Figure 4-21. Monthly average concentration, daily discharge, <strong>and</strong> estimated wet <strong>and</strong> dry season loads by<br />
water year <strong>for</strong> Mokelumne River.<br />
April 14, 2006 4-29
Chapter 4.0<br />
Conceptual Model <strong>for</strong> Organic Carbon <strong>in</strong> <strong>the</strong> Central Valley<br />
8<br />
Yolo Bypass<br />
Average DOC (mg/l)<br />
6<br />
4<br />
2<br />
0<br />
Jan (2)<br />
Feb (3)<br />
Mar (6)<br />
Apr (3)<br />
May (4)<br />
Jun<br />
Jul<br />
Aug<br />
Sep<br />
Oct<br />
Nov<br />
Dec<br />
Month<br />
600000<br />
500000<br />
Yolo Bypass<br />
Daily Flow, cfs<br />
400000<br />
300000<br />
200000<br />
100000<br />
0<br />
1980 1985 1990 1995 2000 2005<br />
Year<br />
100000<br />
80000<br />
Yolo Bypass<br />
Dry Season<br />
Wet Season<br />
DOC Load, tons<br />
60000<br />
40000<br />
20000<br />
0<br />
1980 1985 1990 1995 2000 2005<br />
Water Year<br />
Figure 4-22. Monthly average concentration, daily discharge, <strong>and</strong> estimated wet <strong>and</strong> dry season loads by<br />
water year <strong>for</strong> <strong>the</strong> Yolo Bypass.<br />
4-30 April 14, 2006
Conceptual Model <strong>for</strong> Organic Carbon <strong>in</strong> <strong>the</strong> Central Valley Chapter 4.0<br />
3.5<br />
3.0<br />
Delta Outflow<br />
Average TOC (mg/l)<br />
2.5<br />
2.0<br />
1.5<br />
1.0<br />
0.5<br />
0.0<br />
Jan (5)<br />
Feb (5)<br />
Mar (5)<br />
Apr (5)<br />
May (5)<br />
Jun (5)<br />
Jul (3)<br />
Aug (3)<br />
Sep (3)<br />
Oct (4)<br />
Nov (4)<br />
Dec (4)<br />
Month<br />
700000<br />
600000<br />
Delta Outflow<br />
Daily Flow, cfs<br />
500000<br />
400000<br />
300000<br />
200000<br />
100000<br />
0<br />
1980 1985 1990 1995 2000 2005<br />
Year<br />
TOC Load, tons<br />
180000<br />
160000<br />
140000<br />
120000<br />
100000<br />
80000<br />
60000<br />
40000<br />
20000<br />
Delta Outflow<br />
Dry Season<br />
Wet Season<br />
0<br />
1980 1985 1990 1995 2000 2005<br />
Water Year<br />
Figure 4-23. Monthly average concentration, daily discharge, <strong>and</strong> estimated wet <strong>and</strong> dry season loads by<br />
water year <strong>for</strong> Delta outflows.<br />
April 14, 2006 4-31
Chapter 4.0<br />
Conceptual Model <strong>for</strong> Organic Carbon <strong>in</strong> <strong>the</strong> Central Valley<br />
The loads calculated <strong>for</strong> <strong>the</strong> key subwatersheds are summarized <strong>in</strong> Table 4-3 <strong>for</strong> <strong>the</strong><br />
dry <strong>and</strong> wet season of wet <strong>and</strong> dry years. Loads of <strong>organic</strong> <strong>carbon</strong> <strong>in</strong> <strong>the</strong> dry <strong>and</strong> wet<br />
season of wet years are shown graphically <strong>in</strong> Figure 4-24. The graphical<br />
representation uses arrow thickness to scale loads, <strong>and</strong> can be used to compare across<br />
seasons <strong>and</strong> locations. The loads closely follow <strong>the</strong> pattern <strong>for</strong> flows shown <strong>in</strong><br />
Figure 4-5, with <strong>the</strong> Sacramento River be<strong>in</strong>g <strong>the</strong> dom<strong>in</strong>ant source. This is true even<br />
though concentrations <strong>in</strong> <strong>the</strong> San Joaqu<strong>in</strong> River are generally much higher than <strong>in</strong> <strong>the</strong><br />
Sacramento River (Chapter 3). Tributary loads <strong>and</strong> Delta exports to <strong>the</strong> Bay dur<strong>in</strong>g<br />
wet years are several times higher than dur<strong>in</strong>g dry years.<br />
Estimated loads from this study compare favorably with loads estimated <strong>in</strong> previous<br />
studies, as shown <strong>in</strong> Table 4-4. At <strong>the</strong> Sacramento River (ei<strong>the</strong>r Freeport or Greene’s<br />
L<strong>and</strong><strong>in</strong>g), loads from Saleh et al. (2003) <strong>for</strong> wet years <strong>and</strong> Woodard (2000) <strong>for</strong> wet<br />
<strong>and</strong> dry years are with<strong>in</strong> 15% of <strong>the</strong> estimates from this study. At <strong>the</strong> San Joaqu<strong>in</strong><br />
River at Vernalis, wet <strong>and</strong> dry year loads from Woodard (2000) are with<strong>in</strong> 30% of<br />
current estimates.<br />
4-32 April 14, 2006
Conceptual Model <strong>for</strong> Organic Carbon <strong>in</strong> <strong>the</strong> Central Valley Chapter 4.0<br />
Table 4-3.<br />
Loads transported at locations correspond<strong>in</strong>g to <strong>the</strong> outflow po<strong>in</strong>ts of <strong>the</strong> subwatersheds <strong>in</strong> Table 4-1.<br />
ID Watershed Name<br />
1<br />
Sacramento River<br />
above Bend Bridge<br />
Upstream<br />
Area (km 2 )<br />
Dry<br />
Season<br />
Dry Years (tons) Wet Years (tons)<br />
Wet<br />
Season<br />
Total<br />
Dry<br />
Season<br />
Wet<br />
Season<br />
Total<br />
Export Rates<br />
(tons/km 2 )<br />
23,144 5,384 6,858 12,242 6,648 20,069 26,717 0.53 1.15<br />
2 Butte Creek 2,402 - - - - - - - -<br />
3<br />
Sacramento River at<br />
Colusa<br />
36,807 4,782 11,612 16,394 6,960 23,530 30,490 0.45 0.83<br />
4 Yuba River 3,502 328 1,096 1,424 1,374 4,530 5,904 0.41 1.69<br />
5 Fea<strong>the</strong>r River 9,994 - - - 5,975 21,462 27,437 2.75<br />
6 Cache Creek 3,112 9 295 304 131 2,442 2,574 0.10 0.83<br />
7 American River 5,528 2,002 1,876 3,878 3,761 7,320 11,081 0.70 2.00<br />
8<br />
Sacramento River at<br />
Hood/Greene's<br />
61,316 9,958 29,355 39,313 18,215 54,382 72,598 0.64 1.18<br />
9 Cosumnes River 2,390 132 339 471 845 1,710 2,555 0.20 1.07<br />
10<br />
San Joaqu<strong>in</strong> River at<br />
Newman<br />
19,085 1,136 2,307 3,444 7,117 15,031 22,148 0.18 1.16<br />
11 Stanislaus River 3,478 636 664 1,301 1,367 2,220 3,587 0.37 1.03<br />
12 Tuolumne River 4,586 428 719 1,147 3,057 3,555 6,612 0.25 1.44<br />
13 Merced River 3,289 218 436 653 0.20 -<br />
14<br />
Bear Cr/Owens<br />
Cr/Mariposa<br />
Cr/Deadmans Cr<br />
2,397 - - - - - - - -<br />
15 Chowchilla River 850 - - - - - - - -<br />
16<br />
San Joaqu<strong>in</strong> River at<br />
Sack Dam<br />
11,667 673 384 1,057 - - - 0.09 -<br />
17 Mokelumne River 3,022 238 311 550 776 1,716 2,492 0.18 0.82<br />
18 Bear River 1,229 19 223 242 105 1,598 1,703 0.20 1.39<br />
19 Putah Creek 1,795 - - - - - - - -<br />
20 Delta North 2,148 - - - - - - - -<br />
21 Delta South 5,730 - - - - - - - -<br />
22<br />
San Joaqu<strong>in</strong> River at<br />
Vernalis<br />
32,782 2,222 4,908 7,130 9,237 20,821 30,059 0.22 0.92<br />
- Yolo Bypass - 328 2,621 2,949 1,347 37,965 39,312 - -<br />
Dry<br />
year<br />
Wet<br />
Year<br />
- Delta Outflow Loads - 4,612 19,869 24,481 17,741 85,861 103,601 - -<br />
Note: Loads <strong>for</strong> watersheds without data <strong>in</strong> this table are presented <strong>in</strong> Tables 4-9 <strong>and</strong> 4-10 <strong>for</strong> dry <strong>and</strong> wet years, respectively, as estimated us<strong>in</strong>g export rates.<br />
April 14, 2006 4-33
Chapter 4.0 Conceptual Model <strong>for</strong> Organic Carbon <strong>in</strong> <strong>the</strong> Central Valley<br />
Figure 4-24. Organic <strong>carbon</strong> loads <strong>for</strong> <strong>the</strong> dry <strong>and</strong> wet season of an average wet year on a schematic representation of <strong>the</strong> San Joaqu<strong>in</strong>-Sacramento<br />
River systems. In-Delta nutrient sources <strong>and</strong> s<strong>in</strong>ks are presented <strong>in</strong> Chapter 5.<br />
4-34 April 14, 2006
Conceptual Model <strong>for</strong> Organic Carbon <strong>in</strong> <strong>the</strong> Central Valley Chapter 4.0<br />
Table 4-4.<br />
Estimated Loads from this study compared with o<strong>the</strong>r published studies (Saleh et al., 2003; Woodard, 2000)<br />
Woodard, 2000; Data<br />
from 1980-1999<br />
(tons)<br />
Saleh et al.,<br />
This Study (tons) 2003 1 (tons)<br />
Wet Years<br />
Dry Wet (Sac: 95-98; Dry<br />
ID Watershed Name Years Years SJ: 86-94) Years<br />
Sacramento River<br />
1 above Bend Bridge 12,242 26,717 30,564 - -<br />
2 Butte Creek - - - - -<br />
Sacramento River at<br />
Colusa 16,394 30,490 32,687 - -<br />
3<br />
4 Yuba River 1,424 5,904 7,247 - -<br />
5 Fea<strong>the</strong>r River - 27,437 40,614 - -<br />
6 Cache Creek 304 2,574 - -<br />
7 American River 3,878 11,081 9,996 - -<br />
Wet<br />
Years<br />
Sacramento River at<br />
8 Hood/Greene's 39,313 72,598 82,658 2 34,697 72,966<br />
9 Cosumnes River 471 2,555 - - -<br />
San Joaqu<strong>in</strong> River at<br />
Newman 3,444 22,148 - - -<br />
10<br />
11 Stanislaus River 1,301 3,587 4,180 - -<br />
12 Tuolumne River 1,147 6,612 3,904 - -<br />
13 Merced River 653 - 5,206 - -<br />
14<br />
Bear Cr/Owens<br />
Cr/Mariposa<br />
Cr/Deadmans Cr - - - - -<br />
15 Chowchilla River - - - -<br />
San Joaqu<strong>in</strong> River at<br />
Sack Dam 1,057 - - - -<br />
16<br />
17 Mokelumne River 550 2,492 - - -<br />
18 Bear River 242 1,703 - - -<br />
19 Putah Creek - - - - -<br />
20 Delta North - - - - -<br />
21 Delta South - - - - -<br />
22<br />
San Joaqu<strong>in</strong> River at<br />
Vernalis 7,130 30,059 17,284 4,844 23,633<br />
Yolo Bypass 2,949 39,312 - - -<br />
1 Actual loads <strong>in</strong> this column are based on a personal communication from C. Kratzer, 2005.<br />
2 Data from Sacramento River at Freeport.<br />
4.4 ALTERNATE METHODS FOR LOAD ESTIMATION<br />
The USGS, <strong>in</strong> <strong>the</strong> LOADEST <strong>model</strong> <strong>for</strong> comput<strong>in</strong>g flux <strong>in</strong> streams, provides options<br />
<strong>for</strong> alternate <strong>for</strong>mulations <strong>for</strong> regression equations, n<strong>in</strong>e of which are shown <strong>in</strong> Table<br />
4-5. Because this general approach has been used <strong>in</strong> several published reports<br />
(Craw<strong>for</strong>d, 1991; Cohn et al., 1992), it was applied <strong>in</strong> this work to compare results<br />
with those presented <strong>in</strong> Table 4-3. Regression <strong>model</strong>s with multiple fitted coefficients<br />
April 14, 2006 4-35
Chapter 4.0<br />
Conceptual Model <strong>for</strong> Organic Carbon <strong>in</strong> <strong>the</strong> Central Valley<br />
are most appropriate when <strong>the</strong>re are sufficient data to fit. A station with adequate<br />
data, <strong>the</strong> Hood/Greene’s L<strong>and</strong><strong>in</strong>g station on <strong>the</strong> Sacramento River, was <strong>the</strong>re<strong>for</strong>e<br />
employed <strong>for</strong> this comparison.<br />
Loads were computed us<strong>in</strong>g <strong>the</strong> 9 <strong>model</strong>s <strong>in</strong> Table 4-5 that were applicable to <strong>the</strong><br />
Hood/Greene’s L<strong>and</strong><strong>in</strong>g station data, <strong>and</strong> calculations were per<strong>for</strong>med <strong>in</strong> a manner<br />
consistent with that presented <strong>in</strong> Section 4-3, i.e., loads were computed <strong>for</strong> all years<br />
<strong>and</strong> <strong>for</strong> wet <strong>and</strong> dry seasons. The results, <strong>in</strong>clud<strong>in</strong>g <strong>the</strong> upper <strong>and</strong> lower confidence<br />
<strong>in</strong>tervals of <strong>the</strong> load estimates (5 th <strong>and</strong> 95 th percentile), are presented <strong>in</strong> Table 4-6.<br />
The mean loads <strong>for</strong> all years (39,000 – 53,000 tons/year) is <strong>in</strong> <strong>the</strong> middle to low end<br />
of <strong>the</strong> range of <strong>the</strong> wet <strong>and</strong> dry year loads <strong>for</strong> <strong>the</strong> Hood/Greene’s L<strong>and</strong><strong>in</strong>g station on<br />
<strong>the</strong> Sacramento River computed <strong>in</strong> Section 4-3 (39,300 tons <strong>for</strong> dry years <strong>and</strong> 72,600<br />
tons <strong>for</strong> wet years). This comparison lends credence to <strong>the</strong> relatively simple method<br />
used <strong>in</strong> <strong>the</strong> previous section of us<strong>in</strong>g <strong>the</strong> monthly average concentrations <strong>and</strong> flows. It<br />
is recognized, however, that <strong>for</strong> sites with enough flow <strong>and</strong> concentration data, <strong>the</strong><br />
LOADEST approach may provide additional <strong>in</strong><strong>for</strong>mation that is useful, especially <strong>the</strong><br />
upper <strong>and</strong> lower confidence limits.<br />
Table 4-5.<br />
Regression equations from <strong>the</strong> LOADEST program (Runkel et al., 2004).<br />
LoadEst Model<br />
Regression Model of Load<br />
1 a 0<br />
a1LnQ<br />
2<br />
2<br />
a<br />
0<br />
+ a1LnQ<br />
+ a2LnQ<br />
3 a0 + a1LnQ<br />
+ a2dtime<br />
4 a0 + a1LnQ<br />
+ a2S<strong>in</strong><br />
( 2π dtime ) + a3Cos<br />
( 2π<br />
d time<br />
)<br />
5<br />
2<br />
a0 + a1LnQ<br />
+ a2LnQ<br />
+ a3d time<br />
π dtime + a4Cos<br />
π d time<br />
7 a0 + a1LnQ<br />
+ a2S<strong>in</strong>( 2 π dtime<br />
) + a3Cos<br />
( 2π<br />
dtime<br />
) + a4dtime<br />
6<br />
2<br />
a0 + a1LnQ<br />
+ a2LnQ<br />
+ a3S<strong>in</strong>( 2 ) ( 2 )<br />
8<br />
2<br />
a0 + a1LnQ<br />
+ a2LnQ<br />
+ a3S<strong>in</strong>( 2 π dtime<br />
) + a4Cos<br />
( 2π<br />
dtime<br />
) + a5dtime<br />
a<br />
2<br />
+ a LnQ + a LnQ + a S<strong>in</strong> π d + a Cos π d + a d + a d<br />
9 ( ) ( )<br />
2<br />
0 1<br />
2<br />
3<br />
2<br />
time 4<br />
2<br />
time 5 time 6 time<br />
a<br />
0<br />
, a1,...<br />
a6<br />
= unknown regression coefficients<br />
Q<br />
= streamflow<br />
d<br />
time<br />
= decimal time<br />
4-36 April 14, 2006
Conceptual Model <strong>for</strong> Organic Carbon <strong>in</strong> <strong>the</strong> Central Valley Chapter 4.0<br />
Table 4-6.<br />
Calculated loads at Sacramento River at Hood/Greene’s L<strong>and</strong><strong>in</strong>g (mean <strong>and</strong> upper <strong>and</strong> lower confidence<br />
<strong>in</strong>tervals - 5% <strong>and</strong> 95%), us<strong>in</strong>g <strong>the</strong> 9 regression equations <strong>in</strong> Table 4-5.<br />
All Years (tons)<br />
Dry Season Wet Season Total<br />
Lower 15,878 33,818 49,906<br />
Model 1 Mean 16,574 35,586 52,169<br />
Upper 17,295 37,422 54,505<br />
Lower 15,875 34,579 50,702<br />
Model 2 Mean 16,568 36,604 53,181<br />
Upper 17,286 38,715 55,746<br />
Lower 13,354 28,849 42,293<br />
Model 3 Mean 14,846 32,044 46,895<br />
Upper 16,457 35,493 51,859<br />
Lower 12,921 37,473 50,907<br />
Model 4 Mean 13,603 39,360 52,976<br />
Upper 14,313 41,319 55,108<br />
Lower 13,117 29,356 42,599<br />
Model 5 Mean 14,570 32,567 47,143<br />
Upper 16,140 36,029 52,038<br />
Lower 12,942 37,535 50,976<br />
Model 6 Mean 13,635 39,510 53,159<br />
Upper 14,356 41,563 55,407<br />
Lower 10,993 32,163 43,373<br />
Model 7 Mean 12,170 35,406 47,585<br />
Upper 13,435 38,885 52,093<br />
Lower 10,976 32,218 43,409<br />
Model 8 Mean 12,148 35,457 47,618<br />
Upper 13,412 38,932 52,115<br />
Lower 8,170 23,456 31,715<br />
Model 9 Mean 10,012 28,777 38,796<br />
Upper 12,144 34,942 46,986<br />
This Study (Dry Years) 9,958 29,355 39,313<br />
This Study (Wet Years) 18,215 54,382 72,598<br />
April 14, 2006 4-37
Chapter 4.0<br />
Conceptual Model <strong>for</strong> Organic Carbon <strong>in</strong> <strong>the</strong> Central Valley<br />
4.5 ESTIMATION OF WATERSHED LOADS<br />
Stream loads calculated above can be compared with loads orig<strong>in</strong>at<strong>in</strong>g <strong>in</strong> <strong>the</strong><br />
watershed that <strong>in</strong>clude non-po<strong>in</strong>t sources (pr<strong>in</strong>cipally different l<strong>and</strong> uses, such as<br />
agriculture, urban l<strong>and</strong>, wetl<strong>and</strong>s, <strong>and</strong> o<strong>the</strong>r natural l<strong>and</strong>s), <strong>and</strong> po<strong>in</strong>t sources<br />
(pr<strong>in</strong>cipally wastewater treatment, although o<strong>the</strong>r sources may be contributors). The<br />
sections below discuss <strong>the</strong> approach used to estimate <strong>the</strong>se contributions. These are<br />
prelim<strong>in</strong>ary estimates due to <strong>the</strong> limited data that were available on export rates from<br />
<strong>in</strong>dividual l<strong>and</strong> uses.<br />
4.5.1 ESTIMATION OF ORGANIC CARBON EXPORT RATES FROM NON-POINT SOURCES<br />
Non-po<strong>in</strong>t source contributions of <strong>organic</strong> <strong>carbon</strong> loads to streams are expressed as<br />
mass of <strong>carbon</strong> delivered to <strong>the</strong> stream per unit area per unit time. The stream outflow<br />
represents <strong>the</strong> load contributions <strong>in</strong> surface runoff as well as baseflow (i.e., through<br />
groundwater). The export rate calculations are similar to <strong>the</strong> load estimates from<br />
streams except that <strong>for</strong> <strong>the</strong> rates to be applicable to one type of l<strong>and</strong> use, <strong>the</strong><br />
watershed <strong>in</strong> consideration must conta<strong>in</strong> only that l<strong>and</strong> use. Thus, an urban l<strong>and</strong><br />
<strong>organic</strong> <strong>carbon</strong> export rate is obta<strong>in</strong>ed from a watershed that is entirely urban l<strong>and</strong>,<br />
<strong>and</strong> a background export rate is obta<strong>in</strong>ed from a watershed with m<strong>in</strong>imal<br />
development. In practice, f<strong>in</strong>d<strong>in</strong>g watersheds with only one type of l<strong>and</strong> use is very<br />
difficult, although <strong>in</strong> some <strong>in</strong>stances small <strong>in</strong>dicator watersheds may be found that fit<br />
this criterion. Export rates from specific l<strong>and</strong> uses, weighted by <strong>the</strong> area of that l<strong>and</strong><br />
use <strong>in</strong> a watershed, can be used to compute <strong>the</strong> non-po<strong>in</strong>t source contribution, as<br />
shown schematically <strong>in</strong> Figure 4-25.<br />
Organic <strong>carbon</strong> export rates were estimated <strong>for</strong> urban l<strong>and</strong> <strong>and</strong> agricultural l<strong>and</strong> <strong>in</strong> <strong>the</strong><br />
San Joaqu<strong>in</strong> <strong>and</strong> Sacramento Bas<strong>in</strong>s, background loads from a mix of <strong>for</strong>est <strong>and</strong><br />
shrubl<strong>and</strong> (or rangel<strong>and</strong>), <strong>and</strong> from wetl<strong>and</strong>s. Fur<strong>the</strong>r stratification of l<strong>and</strong> use-based<br />
export rates (e.g., by crop type <strong>for</strong> agricultural l<strong>and</strong>) was not possible given <strong>the</strong><br />
exist<strong>in</strong>g data. This is an area that will benefit greatly through collection of additional<br />
data <strong>in</strong> small <strong>in</strong>dicator watersheds as described <strong>in</strong> Chapter 6.<br />
The follow<strong>in</strong>g locations were used to develop prelim<strong>in</strong>ary export rates:<br />
• The Colusa Bas<strong>in</strong> Dra<strong>in</strong> was used <strong>for</strong> estimat<strong>in</strong>g agricultural loads <strong>in</strong> <strong>the</strong><br />
Sacramento River Bas<strong>in</strong> as shown <strong>in</strong> Figure 4-26. Although <strong>the</strong> Colusa Bas<strong>in</strong><br />
Dra<strong>in</strong> watershed <strong>in</strong>cludes non-agricultural l<strong>and</strong>, it was <strong>the</strong> best station based<br />
on <strong>the</strong> exist<strong>in</strong>g data. Hard<strong>in</strong>g Dra<strong>in</strong> was used <strong>for</strong> agricultural loads <strong>in</strong> <strong>the</strong> San<br />
Joaqu<strong>in</strong> Bas<strong>in</strong> as shown <strong>in</strong> Figure 4-27.<br />
• Mud Slough <strong>and</strong> Salt Slough were used <strong>for</strong> estimat<strong>in</strong>g wetl<strong>and</strong> loads <strong>in</strong> <strong>the</strong><br />
San Joaqu<strong>in</strong> Bas<strong>in</strong> as shown <strong>in</strong> Figures 4-28 <strong>and</strong> 4-29.<br />
4-38 April 14, 2006
Conceptual Model <strong>for</strong> Organic Carbon <strong>in</strong> <strong>the</strong> Central Valley Chapter 4.0<br />
Figure 4-25. Export rates from specific l<strong>and</strong> uses, weighted by <strong>the</strong> area of that l<strong>and</strong> use <strong>in</strong> a watershed, can be used to compute <strong>the</strong> non-po<strong>in</strong>t source<br />
contribution <strong>for</strong> a mixed l<strong>and</strong> use watershed.<br />
April 14, 2006 4-39
Chapter 4.0<br />
Conceptual Model <strong>for</strong> Organic Carbon <strong>in</strong> <strong>the</strong> Central Valley<br />
Average TOC (mg/l)<br />
12<br />
10<br />
8<br />
6<br />
4<br />
2<br />
Colusa Bas<strong>in</strong> Dra<strong>in</strong><br />
0<br />
Jan (3)<br />
Feb (4)<br />
Mar (3)<br />
Apr (5)<br />
May (2)<br />
Jun (3)<br />
Jul (3)<br />
Aug (2)<br />
Sep (3)<br />
Oct (3)<br />
Nov (3)<br />
Dec (3)<br />
Month<br />
25000<br />
Colusa Bas<strong>in</strong> Dra<strong>in</strong><br />
20000<br />
Daily Flow, cfs<br />
15000<br />
10000<br />
5000<br />
0<br />
1980 1985 1990 1995 2000 2005<br />
Year<br />
TOC Load, tons<br />
12000<br />
10000<br />
8000<br />
6000<br />
4000<br />
Colusa Bas<strong>in</strong> Dra<strong>in</strong><br />
Dry Season<br />
Wet Season<br />
2000<br />
0<br />
1980 1985 1990 1995 2000 2005<br />
Water Year<br />
Figure 4-26. Monthly average concentration, daily discharge, <strong>and</strong> estimated wet <strong>and</strong> dry season loads by<br />
water year <strong>for</strong> <strong>the</strong> Colusa Bas<strong>in</strong> Dra<strong>in</strong>. These data were used to estimate <strong>the</strong> <strong>organic</strong> <strong>carbon</strong><br />
export rate from agriculture <strong>in</strong> <strong>the</strong> Sacramento River bas<strong>in</strong>.<br />
4-40 April 14, 2006
Conceptual Model <strong>for</strong> Organic Carbon <strong>in</strong> <strong>the</strong> Central Valley Chapter 4.0<br />
18<br />
16<br />
Hard<strong>in</strong>g Dra<strong>in</strong><br />
Average TOC (mg/l)<br />
14<br />
12<br />
10<br />
8<br />
6<br />
4<br />
2<br />
0<br />
Jan<br />
Feb (2)<br />
Mar (1)<br />
Apr (2)<br />
May (3)<br />
Jun (2)<br />
Jul (3)<br />
Aug (2)<br />
Sep (2)<br />
Oct (1)<br />
Nov (1)<br />
Dec (2)<br />
Month<br />
160<br />
140<br />
Hard<strong>in</strong>g Dra<strong>in</strong><br />
120<br />
Daily Flow, cfs<br />
100<br />
80<br />
60<br />
40<br />
20<br />
0<br />
1980 1985 1990 1995 2000 2005<br />
Year<br />
700<br />
600<br />
Hard<strong>in</strong>g Dra<strong>in</strong><br />
TOC Load, tons<br />
500<br />
400<br />
300<br />
200<br />
Dry Season<br />
Wet Season<br />
100<br />
0<br />
1980 1985 1990 1995 2000<br />
Water Year<br />
Figure 4-27. Monthly average concentration, daily discharge, <strong>and</strong> estimated wet <strong>and</strong> dry season loads by<br />
water year <strong>for</strong> <strong>the</strong> Hard<strong>in</strong>g Dra<strong>in</strong>. These data were used to estimate <strong>the</strong> <strong>organic</strong> <strong>carbon</strong><br />
export rate from agriculture <strong>in</strong> <strong>the</strong> San Joaqu<strong>in</strong> River bas<strong>in</strong>.<br />
April 14, 2006 4-41
Chapter 4.0<br />
Conceptual Model <strong>for</strong> Organic Carbon <strong>in</strong> <strong>the</strong> Central Valley<br />
Average DOC (mg/l)<br />
12<br />
10<br />
8<br />
6<br />
4<br />
2<br />
Mud Slough<br />
0<br />
Jan (8)<br />
Feb (8)<br />
Mar (9)<br />
Apr (9)<br />
May (10)<br />
Jun (8)<br />
Jul (8)<br />
Aug (8)<br />
Sep (8)<br />
Oct (8)<br />
Nov (9)<br />
Dec (7)<br />
Month<br />
1200<br />
1000<br />
Mud Slough<br />
Daily Flow, cfs<br />
800<br />
600<br />
400<br />
200<br />
0<br />
1980 1985 1990 1995 2000 2005<br />
Year<br />
2500<br />
Mud Slough<br />
DOC Load, tons<br />
2000<br />
1500<br />
1000<br />
Dry Season<br />
Wet Season<br />
500<br />
0<br />
1980 1985 1990 1995 2000 2005<br />
Water Year<br />
Figure 4-28. Monthly average concentration, daily discharge, <strong>and</strong> estimated wet <strong>and</strong> dry season loads by<br />
water year <strong>for</strong> <strong>the</strong> Mud Slough. These data were used to estimate <strong>the</strong> <strong>organic</strong> <strong>carbon</strong> export<br />
rate from wetl<strong>and</strong>s <strong>in</strong> <strong>the</strong> San Joaqu<strong>in</strong> bas<strong>in</strong>.<br />
4-42 April 14, 2006
Conceptual Model <strong>for</strong> Organic Carbon <strong>in</strong> <strong>the</strong> Central Valley Chapter 4.0<br />
10<br />
Salt Slough<br />
Average TOC (mg/l)<br />
8<br />
6<br />
4<br />
2<br />
0<br />
Jan (2)<br />
Feb (1)<br />
Mar (1)<br />
Apr (3)<br />
May (3)<br />
Jun (6)<br />
Jul (3)<br />
Aug (3)<br />
Sep (3)<br />
Oct (3)<br />
Nov (2)<br />
Dec (2)<br />
Month<br />
1000<br />
Salt Slough<br />
800<br />
Daily Flow, cfs<br />
600<br />
400<br />
200<br />
0<br />
1980 1985 1990 1995 2000 2005<br />
Year<br />
TOC Load, tons<br />
2000<br />
1500<br />
1000<br />
500<br />
Salt Slough<br />
Dry Season<br />
Wet Season<br />
0<br />
1980 1985 1990 1995 2000 2005<br />
Water Year<br />
Figure 4-29. Monthly average concentration, daily discharge, <strong>and</strong> estimated wet <strong>and</strong> dry season loads by<br />
water year <strong>for</strong> <strong>the</strong> Salt Slough. These data were used to estimate <strong>the</strong> <strong>organic</strong> <strong>carbon</strong> export<br />
rate from wetl<strong>and</strong>s <strong>in</strong> <strong>the</strong> San Joaqu<strong>in</strong> bas<strong>in</strong>.<br />
April 14, 2006 4-43
Chapter 4.0<br />
Conceptual Model <strong>for</strong> Organic Carbon <strong>in</strong> <strong>the</strong> Central Valley<br />
• The urban runoff export rate <strong>for</strong> <strong>organic</strong> <strong>carbon</strong> was estimated us<strong>in</strong>g USGS<br />
data collected at Arcade Creek (Saleh et al., 2003). Arcade Creek has a small,<br />
entirely urban, watershed (Figure 4-30) <strong>and</strong> is a good choice <strong>for</strong> <strong>the</strong> export<br />
rate calculation. Data collected at <strong>the</strong> Natomas East Ma<strong>in</strong> Dra<strong>in</strong>age Canal<br />
(NEMDC) may also be used <strong>for</strong> estimat<strong>in</strong>g urban runoff loads. Although this<br />
watershed is rapidly urbaniz<strong>in</strong>g, it still conta<strong>in</strong>s some agricultural l<strong>and</strong>. The<br />
Arcade Creek watershed was considered <strong>the</strong> best choice <strong>for</strong> this analysis s<strong>in</strong>ce<br />
it is an entirely urbanized watershed. O<strong>the</strong>r urban runoff data <strong>in</strong> <strong>the</strong> Dr<strong>in</strong>k<strong>in</strong>g<br />
Water Policy Database from <strong>the</strong> cities of Sacramento <strong>and</strong> Stockton could not<br />
be used because <strong>the</strong>se data were not accompanied by flow measurements. The<br />
urban runoff data from Sacramento, Stockton, <strong>and</strong> <strong>the</strong> NEMDC (Figure 4-31)<br />
were compared to <strong>the</strong> data collected on Arcade Creek. NEMDC data were<br />
obta<strong>in</strong>ed from <strong>the</strong> MWQI website <strong>for</strong> <strong>the</strong> period 1997 to 2004. The monthly<br />
average concentrations <strong>for</strong> TOC <strong>in</strong> Arcade Creek ranged from 7 to 12 mg/L.<br />
The Sacramento <strong>and</strong> Stockton stormwater TOC data show a great deal of<br />
variability with concentrations rang<strong>in</strong>g from 3 to 60 mg/L <strong>and</strong> with an average<br />
concentration of 15 mg/L, somewhat higher than <strong>the</strong> Arcade Creek data. The<br />
NEMDC TOC data vary from 3 mg/l to 50 mg/l with an average concentration<br />
of approximately 8 mg/l, comparable to <strong>the</strong> Arcade Creek data. In general, dry<br />
wea<strong>the</strong>r concentrations are marg<strong>in</strong>ally higher than <strong>the</strong> wet wea<strong>the</strong>r<br />
concentrations, although <strong>the</strong> actual impact on delivered loads may be<br />
dom<strong>in</strong>ated by relative magnitudes of flow.<br />
• No station could be clearly identified as a background station with<br />
<strong>in</strong>significant anthropogenic activity. As a first approximation, <strong>the</strong> Yuba River<br />
watershed was used to estimate background loads <strong>for</strong> <strong>the</strong> Sacramento River<br />
Bas<strong>in</strong>. Of <strong>the</strong> major tributaries, <strong>the</strong> Yuba River watershed has <strong>the</strong> least amount<br />
of urban <strong>and</strong> agricultural l<strong>and</strong>. Although <strong>the</strong> TOC concentrations are low <strong>in</strong><br />
<strong>the</strong> watershed, <strong>the</strong> occasional high flows result <strong>in</strong> an export rate virtually<br />
identical to that calculated <strong>for</strong> <strong>the</strong> Colusa Bas<strong>in</strong> Dra<strong>in</strong>. This may also be an<br />
expression of <strong>the</strong> <strong>in</strong>applicability of <strong>the</strong> Yuba River Watershed <strong>for</strong> determ<strong>in</strong><strong>in</strong>g<br />
background export rates. The Yuba River bas<strong>in</strong> wet <strong>and</strong> dry year export rates<br />
of 1.7 <strong>and</strong> 0.41 tons/km 2 /yr may be compared with an estimate of 0.96<br />
tons/km 2 /yr <strong>for</strong> an relatively undeveloped watershed <strong>in</strong> <strong>the</strong> Rocky Mounta<strong>in</strong>s<br />
(Boyer et al., 2000).<br />
4-44 April 14, 2006
Conceptual Model <strong>for</strong> Organic Carbon <strong>in</strong> <strong>the</strong> Central Valley Chapter 4.0<br />
Average TOC (mg/l)<br />
14<br />
12<br />
10<br />
8<br />
6<br />
4<br />
2<br />
0<br />
Arcade Creek<br />
Jan (3)<br />
Feb (4)<br />
Mar (4)<br />
Apr (4)<br />
May (2)<br />
Jun (3)<br />
Jul (3)<br />
Aug (3)<br />
Sep (3)<br />
Oct (3)<br />
Nov (3)<br />
Dec (2)<br />
Month<br />
2500<br />
Arcade Creek<br />
2000<br />
Daily Flow, cfs<br />
1500<br />
1000<br />
500<br />
0<br />
1980 1985 1990 1995 2000 2005<br />
Year<br />
350<br />
300<br />
Arcade Creek<br />
Dry Season<br />
Wet Season<br />
TOC Load, tons<br />
250<br />
200<br />
150<br />
100<br />
50<br />
0<br />
1980 1985 1990 1995 2000 2005<br />
Water Year<br />
Figure 4-30. Monthly average concentration, daily discharge, <strong>and</strong> estimated wet <strong>and</strong> dry season loads by<br />
water year <strong>for</strong> Arcade Creek, used to estimate <strong>the</strong> urban runoff export rate <strong>for</strong> <strong>organic</strong><br />
<strong>carbon</strong> from <strong>the</strong> Sacramento River bas<strong>in</strong>.<br />
April 14, 2006 4-45
Chapter 4.0<br />
Conceptual Model <strong>for</strong> Organic Carbon <strong>in</strong> <strong>the</strong> Central Valley<br />
60<br />
DOC or TOC Concentration (mg/l)<br />
50<br />
40<br />
30<br />
20<br />
10<br />
Sac Dry Wea<strong>the</strong>r-TOC<br />
Sac Dry Wea<strong>the</strong>r-DOC<br />
Sac Stormwater-TOC<br />
Sac Stormwater-DOC<br />
Stockton Dry Wea<strong>the</strong>r-TOC<br />
Stockton Stormwater-TOC<br />
NEMDC - TOC<br />
NEMDC - DOC<br />
0<br />
Box Plot Description<br />
Upper <strong>and</strong> lower box: 25th <strong>and</strong> 75th percentile; Whiskers: 10 <strong>and</strong> 90th percentile<br />
Symbols: Outliers; Solid l<strong>in</strong>e: Median; Dashed l<strong>in</strong>e: Mean<br />
Figure 4-31. Urban runoff <strong>organic</strong> <strong>carbon</strong> concentration data from Sacramento, Stockton, <strong>and</strong> <strong>the</strong><br />
Natomas East Ma<strong>in</strong> Dra<strong>in</strong>age Canal (NEMDC).<br />
The summary of export rates <strong>for</strong> various l<strong>and</strong> uses <strong>in</strong> <strong>the</strong> Central Valley is presented<br />
<strong>in</strong> Table 4-7. Although it would be preferable to obta<strong>in</strong> separate export rates <strong>for</strong> <strong>the</strong><br />
Sacramento <strong>and</strong> San Joaqu<strong>in</strong> Bas<strong>in</strong>s because of <strong>the</strong> dist<strong>in</strong>ct differences <strong>in</strong> ra<strong>in</strong>fall, this<br />
was not possible with exist<strong>in</strong>g data. Ra<strong>in</strong>fall dur<strong>in</strong>g water years 2002 <strong>and</strong> 2003<br />
measure at three stations <strong>in</strong> <strong>the</strong> Sacramento Valley averaged 23.7 <strong>in</strong>ches <strong>and</strong><br />
measured at three stations <strong>in</strong> <strong>the</strong> San Joaqu<strong>in</strong> Valley averaged 11.7 <strong>in</strong>ches (MWQI,<br />
2005), which is a factor of two difference. There<strong>for</strong>e, when a rate from <strong>the</strong><br />
Sacramento Bas<strong>in</strong> was applied to <strong>the</strong> San Joaqu<strong>in</strong> Bas<strong>in</strong> (<strong>for</strong> urban runoff <strong>and</strong> <strong>for</strong><br />
<strong>for</strong>est/shrubl<strong>and</strong>), <strong>the</strong> export rate was divided by two to account <strong>for</strong> <strong>the</strong> lower ra<strong>in</strong>fall<br />
<strong>in</strong> <strong>the</strong> San Joaqu<strong>in</strong> Bas<strong>in</strong>. When a rate from <strong>the</strong> San Joaqu<strong>in</strong> Bas<strong>in</strong> was applied to <strong>the</strong><br />
Sacramento Bas<strong>in</strong> (<strong>for</strong> wetl<strong>and</strong>s), <strong>the</strong> rate was multiplied by two to account <strong>for</strong> <strong>the</strong><br />
higher ra<strong>in</strong>fall <strong>in</strong> <strong>the</strong> Sacramento Bas<strong>in</strong>. For agricultural l<strong>and</strong>, separate values were<br />
used <strong>for</strong> <strong>the</strong> Sacramento <strong>and</strong> San Joaqu<strong>in</strong> Bas<strong>in</strong>s.<br />
4-46 April 14, 2006
Conceptual Model <strong>for</strong> Organic Carbon <strong>in</strong> <strong>the</strong> Central Valley Chapter 4.0<br />
Table 4-7.<br />
Export rates of <strong>organic</strong> <strong>carbon</strong> from major l<strong>and</strong> uses <strong>in</strong> <strong>the</strong> Central Valley.<br />
L<strong>and</strong> Use<br />
Dry Year Loads<br />
(tons/km 2 /yr)<br />
Sacramento<br />
San<br />
Joaqu<strong>in</strong><br />
Wet Year Loads<br />
(tons/km 2 /yr)<br />
Sacramento<br />
San<br />
Joaqu<strong>in</strong><br />
Sacramento<br />
Source<br />
San Joaqu<strong>in</strong><br />
Agriculture 1 0.56 1.9 1.6 2.6 Colusa Bas<strong>in</strong> Dra<strong>in</strong> Hard<strong>in</strong>g Dra<strong>in</strong> 2<br />
Urban Runoff 1.3 0.67 2.4 1.2 Arcade Creek<br />
Forest/Rangel<strong>and</strong> 0.41 0.21 1.7 0.85 Yuba River<br />
Calculated from<br />
Wetl<strong>and</strong>-Dom<strong>in</strong>ated 3 1.4 0.69 2.0 1.0 San Joaqu<strong>in</strong> value<br />
1 Available data do not allow separation <strong>in</strong>to crop types.<br />
2 May <strong>in</strong>clude a small POTW <strong>in</strong>fluence.<br />
3 Wetl<strong>and</strong>-dom<strong>in</strong>ated l<strong>and</strong> may <strong>in</strong>clude a portion that is agricultural l<strong>and</strong>.<br />
Calculated from<br />
Sacramento value<br />
Calculated from<br />
Sacramento value<br />
Average of Salt <strong>and</strong><br />
Mud Slough<br />
4.5.2 POINT SOURCES<br />
Po<strong>in</strong>t source discharges <strong>in</strong> <strong>the</strong> Central Valley watershed <strong>in</strong>clude municipal<br />
wastewater treatment plants, <strong>in</strong>dustries, <strong>and</strong> fish hatcheries. There are no data on<br />
<strong>organic</strong> <strong>carbon</strong> concentrations <strong>in</strong> discharges from fish hatcheries or <strong>in</strong>dustries <strong>in</strong> <strong>the</strong><br />
watershed. The major municipal wastewater dischargers are shown <strong>in</strong> Table 4-8 <strong>and</strong><br />
on Figure 4-32. Municipal wastewater dischargers are not generally required to<br />
monitor <strong>organic</strong> <strong>carbon</strong> <strong>in</strong> <strong>the</strong>ir effluent as a condition of <strong>the</strong>ir National Pollutant<br />
Discharge Elim<strong>in</strong>ation System (NPDES) permits. Concentration <strong>and</strong> flow data were<br />
available <strong>for</strong> <strong>the</strong> cities of Davis <strong>and</strong> Vacaville, <strong>and</strong> <strong>for</strong> <strong>the</strong> Sacramento Regional<br />
Wastewater Treatment Plant, which serves all of <strong>the</strong> cities <strong>and</strong> much of <strong>the</strong><br />
un<strong>in</strong>corporated urban area of <strong>the</strong> County of Sacramento (Figure 4-33). TOC<br />
concentrations were four times higher at Davis than Vacaville, <strong>and</strong> concentrations at<br />
Sacramento Regional were even higher.<br />
Wastewater effluent concentrations from <strong>the</strong>se three plants do not show any strong<br />
seasonal patterns (Figure 4-34) so <strong>the</strong> average annual concentration was multiplied by<br />
<strong>the</strong> average effluent flow rate to estimate <strong>the</strong> total load from each plant. The total load<br />
was divided by <strong>the</strong> population served by <strong>the</strong>se wastewater treatment plants (Davis,<br />
60,300; Vacaville, 88,200; Sacramento, 1,128,000), to obta<strong>in</strong> <strong>the</strong> TOC load per<br />
person per year (1.7, 0.6, <strong>and</strong> 3.77 kg/year <strong>for</strong> Davis, Vacaville, <strong>and</strong> Sacramento,<br />
respectively). To obta<strong>in</strong> <strong>the</strong> load from urban areas <strong>for</strong> which no data are available,<br />
<strong>the</strong> urban population <strong>in</strong> <strong>the</strong> specified watershed was determ<strong>in</strong>ed from Census Bureau<br />
data, <strong>and</strong> <strong>the</strong> population multiplied by an average per person TOC load<strong>in</strong>g of 2<br />
kg/person/year (average of 1.7, 0.6, <strong>and</strong> 3.77 kg/person/year from <strong>the</strong> plants above).<br />
April 14, 2006 4-47
Chapter 4.0<br />
Conceptual Model <strong>for</strong> Organic Carbon <strong>in</strong> <strong>the</strong> Central Valley<br />
Table 4-8.<br />
Wastewater treatment plants <strong>in</strong> <strong>the</strong> Central Valley <strong>and</strong> Delta.<br />
Wastewater Treatment Plant Treatment Design Flow (MGD)<br />
Sacramento Bas<strong>in</strong><br />
Sacramento Regional Secondary 181<br />
Roseville-Dry Creek Tertiary 18<br />
Roseville-Pleasant Grove<br />
Tertiary 12<br />
Creek<br />
Vacaville Secondary 10<br />
Chico Secondary 9<br />
Redd<strong>in</strong>g Clear Creek Secondary 9<br />
Woodl<strong>and</strong> Secondary 8<br />
West Sacramento Secondary 8<br />
Davis Secondary 8<br />
Yuba City Secondary 7<br />
Redd<strong>in</strong>g Stillwater Advanced Secondary 4<br />
Total Flow to Sacramento 273<br />
San Joaqu<strong>in</strong><br />
Bas<strong>in</strong><br />
Modesto Secondary 70<br />
Stockton (Nov-Jun) Secondary 55<br />
Stockton (July-Oct) Advanced Secondary 55<br />
Turlock Secondary 20<br />
Merced Secondary 10<br />
Manteca Secondary 10<br />
Total Flow to San Joaqu<strong>in</strong> 165<br />
Delta<br />
Tracy Secondary 9<br />
Lodi Advanced Secondary 7<br />
Brentwood Advanced Secondary 5<br />
Discovery Bay Secondary 2<br />
Total Flow to Delta 23<br />
Total Watershed Flow 461<br />
4-48 April 14, 2006
Conceptual Model <strong>for</strong> Organic Carbon <strong>in</strong> <strong>the</strong> Central Valley Chapter 4.0<br />
Figure 4-32. Po<strong>in</strong>t source discharge locations <strong>in</strong> <strong>the</strong> database developed by Central Valley Dr<strong>in</strong>k<strong>in</strong>g Water<br />
Policy Workgroup.<br />
April 14, 2006 4-49
Chapter 4.0<br />
Conceptual Model <strong>for</strong> Organic Carbon <strong>in</strong> <strong>the</strong> Central Valley<br />
50<br />
TOC <strong>in</strong> Effluent<br />
40<br />
TOC (mg/l)<br />
30<br />
20<br />
10<br />
0<br />
Davis Sacramento Regional Vacaville<br />
300<br />
Effluent Flow Rate<br />
1 mgd = 1.55 cfs<br />
200<br />
Flow (mgd)<br />
100<br />
20<br />
15<br />
10<br />
5<br />
0<br />
Davis Sacramento Regional Vacaville<br />
WWTP Name<br />
Box Plot Description<br />
Upper <strong>and</strong> lower box: 25th <strong>and</strong> 75th percentile; Whiskers: 10 <strong>and</strong> 90th percentile<br />
Symbols: Outliers; Solid l<strong>in</strong>e: Median; Dashed l<strong>in</strong>e: Mean<br />
Figure 4-33. Organic <strong>carbon</strong> concentration <strong>and</strong> flow data <strong>for</strong> Davis, Sacramento, <strong>and</strong> Vacaville. These<br />
are <strong>the</strong> only po<strong>in</strong>t sources that monitor <strong>organic</strong> <strong>carbon</strong> <strong>in</strong> <strong>the</strong>ir outflows.<br />
4-50 April 14, 2006
Conceptual Model <strong>for</strong> Organic Carbon <strong>in</strong> <strong>the</strong> Central Valley Chapter 4.0<br />
10<br />
8<br />
Vacaville Effluent<br />
TOC (mg/l)<br />
6<br />
4<br />
2<br />
0<br />
60<br />
50<br />
Jan Feb Mar Apr May Jun Jul Aug Sep Oct Nov Dec<br />
Sacramento Regional Effluent<br />
TOC (mg/l)<br />
40<br />
30<br />
20<br />
10<br />
0<br />
Jan Feb Mar Apr May Jun Jul Aug Sep Oct Nov Dec<br />
Figure 4-34. Seasonal patterns <strong>in</strong> wastewater effluent concentrations at Vacaville <strong>and</strong> Sacramento<br />
Regional Wastewater Treatment Plant. Data at Davis were <strong>in</strong>sufficient <strong>for</strong> a comparison<br />
across months.<br />
Month<br />
4.5.3 COMPARISON OF WATERSHED AND OUTFLOW LOADS<br />
The relationship between upstream loads, watershed loads correspond<strong>in</strong>g to a stream<br />
reach, <strong>and</strong> downstream exported loads is shown schematically <strong>in</strong> Figure 4-35. If<br />
<strong>in</strong>stream trans<strong>for</strong>mation processes are not dom<strong>in</strong>ant, <strong>the</strong> sum of <strong>the</strong> upstream loads<br />
<strong>and</strong> <strong>the</strong> watershed loads should be approximately equal to <strong>the</strong> downstream exported<br />
loads. Because <strong>in</strong>stream loads <strong>and</strong> export rate based watershed loads were computed<br />
<strong>in</strong>dependently <strong>in</strong> <strong>the</strong> previous sections, <strong>the</strong> comparison of <strong>the</strong>se loads provides a<br />
useful check on <strong>the</strong> calculations so far, <strong>and</strong> discrepancies are one <strong>in</strong>dication of<br />
uncerta<strong>in</strong>ties or <strong>in</strong>accuracies <strong>in</strong> <strong>the</strong> load calculations.<br />
In Figures 4-36 <strong>and</strong> 4-37, <strong>organic</strong> <strong>carbon</strong> load estimates based on <strong>in</strong>-stream<br />
measurements of flow <strong>and</strong> concentration are compared with <strong>the</strong> export rate estimate<br />
of loads <strong>for</strong> each subwatershed. The upper portion of each figure illustrates <strong>the</strong> loads<br />
estimated us<strong>in</strong>g export rates <strong>for</strong> each of <strong>the</strong> l<strong>and</strong>use categories <strong>for</strong> each subwatershed.<br />
The lower portion of each figure compares <strong>the</strong> sum of <strong>the</strong> watershed loads as<br />
presented <strong>in</strong> <strong>the</strong> upper portion (watershed loads), <strong>the</strong>se watershed loads added to <strong>the</strong><br />
upstream <strong>in</strong>stream component (watershed loads + upstream <strong>in</strong>puts), <strong>and</strong> <strong>the</strong> outflow<br />
loads as computed us<strong>in</strong>g <strong>in</strong>stream data, previously presented <strong>in</strong> Table 4-3 (outflows).<br />
Tables 4-9 <strong>and</strong> 4-10 tabulate this <strong>in</strong><strong>for</strong>mation. In several cases, <strong>in</strong>clud<strong>in</strong>g tributary<br />
April 14, 2006 4-51
Chapter 4.0<br />
Conceptual Model <strong>for</strong> Organic Carbon <strong>in</strong> <strong>the</strong> Central Valley<br />
stations near <strong>the</strong> Delta, <strong>the</strong> loads estimated by two very different approaches are<br />
comparable. In o<strong>the</strong>r cases, such as <strong>the</strong> San Joaqu<strong>in</strong> River at Sack Dam (dur<strong>in</strong>g dry<br />
years), <strong>the</strong> estimates are off by a factor of 9. In general, <strong>the</strong> greatest discrepancies<br />
occur at <strong>the</strong> locations that have <strong>the</strong> least amount of <strong>organic</strong> <strong>carbon</strong> concentration data.<br />
Total watershed loads enter<strong>in</strong>g <strong>the</strong> Delta at <strong>the</strong> major tributary <strong>in</strong>put locations,<br />
Sacramento River at Hood/Greene’s L<strong>and</strong><strong>in</strong>g <strong>and</strong> San Joaqu<strong>in</strong> River at Vernalis, are<br />
presented <strong>in</strong> Figure 4-38. These load components are based solely on export rates as<br />
applied to <strong>the</strong> entire watersheds upstream of each location, <strong>and</strong> thus will be different<br />
from loads presented on <strong>the</strong> top portion of Figures 4-36 <strong>and</strong> 4-37 <strong>for</strong> Hood/Greene’s<br />
L<strong>and</strong><strong>in</strong>g <strong>and</strong> Vernalis, which present loads from <strong>the</strong> <strong>in</strong>dividual subwatersheds <strong>for</strong><br />
<strong>the</strong>se locations (i.e., subwatersheds 8 <strong>and</strong> 22). The watershed <strong>and</strong> outflow loads are<br />
shown <strong>in</strong> a graphical schematic <strong>in</strong> Figures 4-39 <strong>and</strong> 4-40 <strong>for</strong> average wet <strong>and</strong> dry<br />
years.<br />
A key observation from <strong>the</strong>se calculations is that <strong>the</strong> background loads, primarily<br />
from l<strong>and</strong> uses such as <strong>for</strong>ests <strong>and</strong> shrubl<strong>and</strong>, dom<strong>in</strong>ate <strong>in</strong> <strong>the</strong> overall annual loads <strong>in</strong><br />
<strong>the</strong> Sacramento Bas<strong>in</strong>. This occurs because <strong>the</strong> annual loads are dom<strong>in</strong>ated by <strong>the</strong><br />
high wet wea<strong>the</strong>r flows, which orig<strong>in</strong>ate <strong>in</strong> large part from <strong>the</strong> less-developed<br />
watersheds <strong>in</strong> <strong>the</strong> Sacramento River bas<strong>in</strong>. Agricultural loads dom<strong>in</strong>ate <strong>in</strong> <strong>the</strong> San<br />
Joaqu<strong>in</strong> Bas<strong>in</strong>, particularly <strong>in</strong> dry years. A key data gap <strong>in</strong> <strong>the</strong>se calculations is <strong>the</strong><br />
limited quantity of directly measured <strong>organic</strong> <strong>carbon</strong> from background areas. The<br />
importance of this source <strong>in</strong> <strong>the</strong> overall load calculation highlights <strong>the</strong> need <strong>for</strong> this<br />
export rate to be better quantified. Additionally, better characterization of agricultural<br />
export rates, particularly <strong>in</strong> <strong>the</strong> San Joaqu<strong>in</strong> Bas<strong>in</strong>, would help reduce <strong>the</strong> uncerta<strong>in</strong>ty<br />
of this load<strong>in</strong>g source.<br />
Figure 4-35. The relationship between upstream loads, watershed loads correspond<strong>in</strong>g to a stream reach,<br />
<strong>and</strong> downstream exported loads. These three load values are compared <strong>in</strong> Figures 4-36 <strong>and</strong><br />
4-37.<br />
4-52 April 14, 2006
Conceptual Model <strong>for</strong> Organic Carbon <strong>in</strong> <strong>the</strong> Central Valley Chapter 4.0<br />
12000<br />
10000<br />
8000<br />
6000<br />
4000<br />
2000<br />
Distribution of Inflow Loads by Watershed, Dry Years<br />
Agriculture<br />
Urban Runoff<br />
Forest/Rangel<strong>and</strong><br />
Wetl<strong>and</strong>s<br />
Po<strong>in</strong>t Sources<br />
TOC Load (tons/year)<br />
0<br />
100000<br />
10000<br />
1000<br />
Inflow <strong>and</strong> Outflow Loads by Watershed, Dry Years<br />
Watershed Loads<br />
Watershed Loads +<br />
Upstream Inputs<br />
Outflows<br />
* Outflows equal <strong>in</strong>flows;<br />
no <strong>in</strong>dependent measurements<br />
Sacramento R. at Bend Bridge<br />
Butte Cr. *<br />
Sacramento R. at Colusa<br />
Yuba R.<br />
Bear R.<br />
Fea<strong>the</strong>r R. *<br />
American R.<br />
Sacramento R. at Hood/Gr. L<strong>and</strong><strong>in</strong>g<br />
Cache Cr.<br />
Putah Cr. *<br />
San Joaqu<strong>in</strong> R. at Sack Dam<br />
Chowchilla R. *<br />
Bear Cr. *<br />
Merced R.<br />
San Joaqu<strong>in</strong> R. at Newman<br />
Tuolumne R.<br />
Stanislaus R.<br />
San Joaqu<strong>in</strong> R. at Vernalis<br />
Cosumnes R.<br />
Mokelumne R.<br />
Delta North *<br />
Delta South *<br />
TOC Load (tons/year)<br />
100<br />
Figure 4-36. Distribution of <strong>organic</strong> <strong>carbon</strong> watershed loads by source, <strong>and</strong> loads flow<strong>in</strong>g out of stream locations are compared with <strong>the</strong> loads<br />
orig<strong>in</strong>at<strong>in</strong>g from <strong>the</strong>ir watersheds <strong>for</strong> dry years.<br />
April 14, 2006 4-53
Chapter 4.0 Conceptual Model <strong>for</strong> Organic Carbon <strong>in</strong> <strong>the</strong> Central Valley<br />
40000<br />
30000<br />
20000<br />
10000<br />
Distribution of Inflow Loads by Watershed, Wet Years<br />
Agriculture<br />
Urban Runoff<br />
Forest/Rangel<strong>and</strong><br />
Wetl<strong>and</strong>s<br />
Po<strong>in</strong>t Sources<br />
TOC Load (tons/year)<br />
0<br />
1000000<br />
100000<br />
10000<br />
1000<br />
Inflow <strong>and</strong> Outflow Loads by Watershed, Wet Years<br />
Watershed Loads<br />
Watershed Loads +<br />
Upstream Inputs<br />
Outflows<br />
* Outflows equal <strong>in</strong>flows;<br />
no <strong>in</strong>dependent measurements<br />
Sacramento R. at Bend Bridge<br />
Butte Cr. *<br />
Sacramento R. at Colusa<br />
Yuba R.<br />
Bear R.<br />
Fea<strong>the</strong>r R.<br />
American R.<br />
Sacramento R. at Hood/Gr. L<strong>and</strong><strong>in</strong>g<br />
Cache Cr.<br />
Putah Cr. *<br />
San Joaqu<strong>in</strong> R. at Sack Dam *<br />
Chowchilla R. *<br />
Bear Cr. *<br />
Merced R. *<br />
San Joaqu<strong>in</strong> R. at Newman<br />
Tuolumne R.<br />
Stanislaus R.<br />
San Joaqu<strong>in</strong> R. at Vernalis<br />
Cosumnes R.<br />
Mokelumne R.<br />
Delta North *<br />
Delta South *<br />
TOC Load (tons/year)<br />
100<br />
Figure 4-37. Distribution of <strong>organic</strong> <strong>carbon</strong> watershed loads by source, <strong>and</strong> loads flow<strong>in</strong>g out of stream locations are compared with <strong>the</strong> loads<br />
orig<strong>in</strong>at<strong>in</strong>g from <strong>the</strong>ir watersheds <strong>for</strong> wet years.<br />
4-54 April 14, 2006
Conceptual Model <strong>for</strong> Organic Carbon <strong>in</strong> <strong>the</strong> Central Valley Chapter 4.0<br />
Table 4-9.<br />
Comparison of upstream load, watershed loads, <strong>and</strong> downstream exports <strong>for</strong> dry years.<br />
Watershed<br />
ID Watershed Name Agriculture<br />
Urban<br />
Runoff<br />
Forest /<br />
Rangel<strong>and</strong> Wetl<strong>and</strong>s<br />
Load (tons/year)<br />
Po<strong>in</strong>t<br />
Sources<br />
Sum of<br />
Watershed<br />
Loads<br />
Watershed<br />
Loads +<br />
Upstream<br />
Inflows Outflows<br />
1<br />
Sacramento River above<br />
Bend Bridge<br />
528 299 6,747 156 99 7,829 7,829 12,242<br />
2 Butte Creek 556 113 499 106 54 1,327 1,327 *<br />
3 Sacramento River at Colusa 1,469 250 2,858 13 100 4,689 16,932 16,394<br />
4 Yuba River 25 55 1,292 0 17 1,389 1,389 1,424<br />
5 Fea<strong>the</strong>r River 514 224 3,138 132 88 4,097 5,762 *<br />
6 Cache Creek 199 95 578 0 27 899 899 304<br />
7 American River 25 786 1,775 0 2,585 2,585 3,878<br />
Sacramento River at<br />
Hood/Greene's L<strong>and</strong><strong>in</strong>g<br />
1,528 495 450 14 2,147 4,634 31,994 39,313<br />
8<br />
9 Cosumnes River 161 98 788 0 38 1,085 1,085 471<br />
San Joaqu<strong>in</strong> River at<br />
Newman<br />
10<br />
3,400 47 431 246 59 4,183 7,501 3,444<br />
11 Stanislaus River 769 82 524 7 164 1,546 1,546 1,301<br />
12 Tuolumne River 319 57 767 0 94 1,237 1,237 1,147<br />
13 Merced River 407 9 520 0 1 937 937 653<br />
Bear Cr/Owens Cr/Mariposa<br />
Cr/Deadmans Cr<br />
14<br />
1,397 59 298 20 83 1,857 1,857 *<br />
15 Chowchilla River 261 6 131 0 5 403 403 *<br />
San Joaqu<strong>in</strong> River at Sack<br />
Dam<br />
16<br />
7,586 325 1,354 124 561 9,950 9,950 1,057<br />
17 Mokelumne River 273 83 914 0 33 1,303 1,303 550<br />
18 Bear River 94 81 395 0 26 596 596 242<br />
19 Putah Creek 97 48 392 0 27 564 564 *<br />
20 Delta North 702 239 269 37 237 1,485 1,485 *<br />
21 Delta South 1,293 565 1,100 27 415 3,399 3,399 *<br />
22 San Joaqu<strong>in</strong> River at Vernalis 2,250 72 163 21 114 2,620 8,511 7,130<br />
* Flow <strong>and</strong> concentration data are not available to calculate an outflow load.<br />
April 14, 2006 4-55
Chapter 4.0 Conceptual Model <strong>for</strong> Organic Carbon <strong>in</strong> <strong>the</strong> Central Valley<br />
Table 4-10.<br />
Comparison of upstream load, watershed loads, <strong>and</strong> downstream exports <strong>for</strong> wet years.<br />
Watershed<br />
ID Watershed Name Agriculture<br />
Urban<br />
Runoff<br />
Forest /<br />
Rangel<strong>and</strong> Wetl<strong>and</strong>s<br />
Load (tons/year)<br />
Po<strong>in</strong>t<br />
Sources<br />
Sum of<br />
Watershed<br />
Loads<br />
Watershed<br />
Loads +<br />
Upstream<br />
Inflows Outflows<br />
1<br />
Sacramento River above<br />
Bend Bridge<br />
1,474 542 27,812 230 138 30,196 30,196 26,717<br />
2 Butte Creek 1,553 204 2,055 156 75 4,044 4,044 *<br />
3 Sacramento River at Colusa 4,100 453 11,779 19 140 16,492 43,209 30,490<br />
4 Yuba River 70 100 5,327 0 23 5,520 5,520 5,904<br />
5 Fea<strong>the</strong>r River 1,434 406 12,935 195 124 15,095 22,702 27,437<br />
6 Cache Creek 556 172 2,382 0 38 3,148 3,148 2,574<br />
7 American River 69 1,424 7,315 0 8,808 8,808 11,081<br />
Sacramento River at<br />
Hood/Greene's L<strong>and</strong><strong>in</strong>g<br />
4,265 897 1,855 20 3,034 10,072 83,124 72,598<br />
8<br />
9 Cosumnes River 450 177 3,248 0 53 3,929 3,929 2,555<br />
San Joaqu<strong>in</strong> River at<br />
Newman<br />
10<br />
4,816 86 1,776 363 83 7,123 29,395 22,148<br />
11 Stanislaus River 1,090 149 2,159 10 230 3,637 3,637 3,587<br />
12 Tuolumne River 452 102 3,163 0 132 3,849 3,849 6,612<br />
13 Merced River 577 16 2,144 0 1 2,738 2,738 *<br />
Bear Cr/Owens Cr/Mariposa<br />
Cr/Deadmans Cr<br />
1,979 106 1,229 30 116 3,461 3,461 *<br />
14<br />
15 Chowchilla River 370 11 541 0 7 928 928 *<br />
San Joaqu<strong>in</strong> River at Sack<br />
Dam<br />
16<br />
10,744 589 5,581 182 787 17,883 17,883 *<br />
17 Mokelumne River 761 150 3,769 0 47 4,727 4,727 2,492<br />
18 Bear River 263 147 1,626 0 37 2,074 2,074 1,703<br />
19 Putah Creek 271 87 1,614 0 38 2,010 2,010 *<br />
20 Delta North 1,961 433 1,110 55 332 3,891 3,891 *<br />
21 Delta South 3,608 1,023 4,533 40 581 9,785 9,785 *<br />
22 San Joaqu<strong>in</strong> River at Vernalis 3,187 130 671 30 160 4,179 36,526 30,059<br />
* Flow <strong>and</strong> concentration data are not available to calculate an outflow load.<br />
4-56 April 14, 2006
Conceptual Model <strong>for</strong> Organic Carbon <strong>in</strong> <strong>the</strong> Central Valley Chapter 4.0<br />
100000<br />
Dry Year Loads<br />
TOC Load (tons/year)<br />
80000<br />
60000<br />
40000<br />
20000<br />
Agriculture<br />
Urban Runoff<br />
Forest/Rangel<strong>and</strong><br />
Wetl<strong>and</strong>s<br />
Po<strong>in</strong>t Sources<br />
0<br />
100000<br />
Wet Year Loads<br />
Sacramento at Hood/Greene's<br />
TOC Load (tons/year)<br />
San Joaqu<strong>in</strong> at Vernalis<br />
80000<br />
60000<br />
40000<br />
20000<br />
0<br />
Figure 4-38. Distribution of <strong>organic</strong> <strong>carbon</strong> watershed loads by source <strong>for</strong> <strong>the</strong> Sacramento <strong>and</strong> San<br />
Joaqu<strong>in</strong> Rivers.<br />
April 14, 2006 4-57
Chapter 4.0<br />
Conceptual Model <strong>for</strong> Organic Carbon <strong>in</strong> <strong>the</strong> Central Valley<br />
Figure 4-39. Watershed <strong>and</strong> outflow loads <strong>for</strong> <strong>the</strong> Central Valley <strong>and</strong> Delta <strong>for</strong> average dry years. This<br />
figure <strong>and</strong> <strong>the</strong> next use <strong>the</strong> same l<strong>in</strong>ear scales to represent stream loads. Watershed loads<br />
are shown with a different scale to show some of <strong>the</strong> smaller load contributions.<br />
4-58 April 14, 2006
Conceptual Model <strong>for</strong> Organic Carbon <strong>in</strong> <strong>the</strong> Central Valley Chapter 4.0<br />
Figure 4-40. Watershed <strong>and</strong> outflow loads <strong>for</strong> <strong>the</strong> Central Valley <strong>and</strong> Delta <strong>for</strong> average wet years. This<br />
figure <strong>and</strong> <strong>the</strong> preced<strong>in</strong>g one use <strong>the</strong> same l<strong>in</strong>ear scales to represent stream loads.<br />
Watershed loads are shown with a different scale to show some of <strong>the</strong> smaller load<br />
contributions.<br />
April 14, 2006 4-59
Chapter 4.0<br />
Conceptual Model <strong>for</strong> Organic Carbon <strong>in</strong> <strong>the</strong> Central Valley<br />
4.6 MAJOR FINDINGS<br />
Flows <strong>in</strong> Central Valley rivers are highly variable, especially <strong>in</strong> w<strong>in</strong>ter months, even<br />
though <strong>the</strong>y are controlled by a large number of reservoirs At most stream sampl<strong>in</strong>g<br />
locations <strong>the</strong>re are limited concentration data, whereas <strong>the</strong>re are daily flow data,<br />
Loads are <strong>the</strong>re<strong>for</strong>e estimated us<strong>in</strong>g monthly average concentration <strong>and</strong> flow values.<br />
At <strong>the</strong> Sacramento River at Hood/Greene’s L<strong>and</strong><strong>in</strong>g, where daily flow <strong>and</strong><br />
concentration data were available, <strong>the</strong> load estimated by this approach was<br />
comparable to loads estimated <strong>in</strong> previous studies.<br />
Tributary <strong>organic</strong> <strong>carbon</strong> loads are substantially greater <strong>in</strong> <strong>the</strong> wet season than <strong>in</strong> <strong>the</strong><br />
dry season. Tributary loads were found to vary significantly between wet <strong>and</strong> dry<br />
years. Although <strong>the</strong> <strong>organic</strong> <strong>carbon</strong> concentrations <strong>in</strong> <strong>the</strong> Sacramento River are lower<br />
than <strong>the</strong> concentrations <strong>in</strong> <strong>the</strong> San Joaqu<strong>in</strong> River, <strong>the</strong> Sacramento River load to <strong>the</strong><br />
Delta exceeds <strong>the</strong> San Joaqu<strong>in</strong> River load by a factor of more than two.<br />
It was not possible to calculate export rates <strong>for</strong> each type of l<strong>and</strong> use present <strong>in</strong> <strong>the</strong><br />
Central Valley <strong>and</strong> Delta. A limited amount of <strong>organic</strong> <strong>carbon</strong> data have been<br />
collected from watersheds with one particular type of l<strong>and</strong> use. Most of <strong>the</strong> data<br />
available <strong>for</strong> this analysis were collected at locations that have mixed l<strong>and</strong> uses.<br />
Export rates of <strong>organic</strong> <strong>carbon</strong> (mass of <strong>carbon</strong> exported per unit area per year) were<br />
estimated <strong>for</strong> several l<strong>and</strong> uses: urban l<strong>and</strong>, agricultural l<strong>and</strong>, wetl<strong>and</strong>s, <strong>and</strong> natural<br />
areas (<strong>in</strong>clud<strong>in</strong>g <strong>for</strong>ests, shrubl<strong>and</strong>, <strong>and</strong> rangel<strong>and</strong>) based on <strong>the</strong> limited data. The<br />
calculated total watershed exports are comparable to <strong>the</strong> stream loads at key locations<br />
(such as Sacramento River at Hood/Greene’s L<strong>and</strong><strong>in</strong>g <strong>and</strong> San Joaqu<strong>in</strong> River at<br />
Vernalis). There were considerable differences <strong>in</strong> <strong>the</strong> estimated loads derived from<br />
<strong>the</strong> two methods at locations where <strong>the</strong>re were limited <strong>organic</strong> <strong>carbon</strong> concentration<br />
data. Export rates, as currently approximated, could be improved through focused<br />
flow <strong>and</strong> concentration data collection <strong>in</strong> small, relatively homogenous watersheds.<br />
4-60 April 14, 2006
CHAPTER 5.0<br />
ORGANIC CARBON CONCENTRATIONS<br />
AND LOADS IN THE DELTA<br />
Over <strong>the</strong> past three decades, <strong>the</strong> Sacramento-San Joaqu<strong>in</strong> Delta has been <strong>the</strong> focus of<br />
monitor<strong>in</strong>g <strong>and</strong> computer <strong>model</strong><strong>in</strong>g studies of <strong>organic</strong> <strong>carbon</strong>. Organic <strong>carbon</strong> data<br />
have been collected at numerous locations <strong>in</strong> <strong>the</strong> Delta <strong>and</strong> its tributary watersheds.<br />
Assessment studies, <strong>in</strong>clud<strong>in</strong>g computer <strong>model</strong><strong>in</strong>g, have used <strong>the</strong>se data to improve<br />
<strong>the</strong> underst<strong>and</strong><strong>in</strong>g of <strong>organic</strong> <strong>carbon</strong> concentrations at dr<strong>in</strong>k<strong>in</strong>g water <strong>in</strong>takes <strong>and</strong> <strong>the</strong><br />
role of <strong>organic</strong> <strong>carbon</strong> quantity <strong>and</strong> quality <strong>in</strong> both dis<strong>in</strong>fection byproduct <strong>for</strong>mation<br />
<strong>and</strong> <strong>in</strong> Delta ecosystem function. Recent computer <strong>model</strong><strong>in</strong>g techniques allow<br />
track<strong>in</strong>g of tributary <strong>and</strong> <strong>in</strong>-Delta sources of <strong>organic</strong> <strong>carbon</strong> <strong>and</strong> relate <strong>the</strong>m to<br />
concentrations at <strong>the</strong> dr<strong>in</strong>k<strong>in</strong>g water <strong>in</strong>takes.<br />
The key issues perta<strong>in</strong><strong>in</strong>g to <strong>organic</strong> <strong>carbon</strong> chemistry <strong>and</strong> ecological processes,<br />
summarized from recent research, are presented <strong>in</strong> Chapter 2. This chapter is focused<br />
on evaluat<strong>in</strong>g <strong>the</strong> sources of <strong>organic</strong> <strong>carbon</strong> <strong>in</strong> <strong>the</strong> Delta <strong>in</strong> a manner similar to that<br />
used <strong>for</strong> <strong>the</strong> tributaries <strong>in</strong> Chapter 4 <strong>and</strong> summariz<strong>in</strong>g key f<strong>in</strong>d<strong>in</strong>gs of source-<strong>in</strong>take<br />
relationships from a published numerical <strong>model</strong> of <strong>the</strong> Delta. Recent research has<br />
emphasized <strong>the</strong> range of reactivity of <strong>organic</strong> <strong>carbon</strong> from different sources, as<br />
discussed <strong>in</strong> Chapter 2; however, detailed <strong>organic</strong> <strong>carbon</strong> characterization is only<br />
available at very limited spatial <strong>and</strong> temporal resolution. Until better data are<br />
available, <strong>the</strong> loads of <strong>organic</strong> <strong>carbon</strong> from <strong>the</strong> tributary <strong>and</strong> <strong>in</strong>-Delta sources,<br />
comb<strong>in</strong>ed with <strong>the</strong> <strong>model</strong><strong>in</strong>g studies that relate loads to concentrations at <strong>the</strong> dr<strong>in</strong>k<strong>in</strong>g<br />
water <strong>in</strong>takes, provide a useful measure of <strong>the</strong> relative importance of different<br />
sources. This <strong>in</strong><strong>for</strong>mation will be ref<strong>in</strong>ed <strong>in</strong> future ef<strong>for</strong>ts to quantify sources <strong>and</strong><br />
potential dr<strong>in</strong>k<strong>in</strong>g water impacts based on additional data.<br />
April 14, 2006 5-1
Chapter 5.0<br />
Conceptual Model <strong>for</strong> Organic Carbon <strong>in</strong> <strong>the</strong> Central Valley<br />
5.1 DELTA INFLOWS AND OUTFLOWS<br />
Characterization of flows is <strong>central</strong> to estimat<strong>in</strong>g loads of constituents <strong>in</strong> mov<strong>in</strong>g<br />
water bodies. Daily water flows enter<strong>in</strong>g <strong>and</strong> exit<strong>in</strong>g <strong>the</strong> Delta at various locations,<br />
shown <strong>in</strong> Figure 5-1, were obta<strong>in</strong>ed from <strong>the</strong> DAYFLOW <strong>model</strong>. DAYFLOW is a<br />
computer program developed <strong>in</strong> 1978 as an account<strong>in</strong>g tool <strong>for</strong> determ<strong>in</strong><strong>in</strong>g historical<br />
<strong>and</strong> current Delta hydrology at <strong>the</strong> boundaries. Inflows <strong>in</strong> all tributaries, outflows to<br />
<strong>the</strong> San Francisco Bay <strong>and</strong> diversion by <strong>the</strong> water supply <strong>in</strong>takes are represented <strong>in</strong><br />
<strong>the</strong> <strong>model</strong>. However, DAYFLOW does not characterize <strong>in</strong>ternal flows <strong>in</strong> <strong>the</strong> channels<br />
of <strong>the</strong> Delta <strong>and</strong> cannot be used to underst<strong>and</strong> <strong>the</strong> mix<strong>in</strong>g processes of different<br />
tributary <strong>and</strong> <strong>in</strong>ternal sources of <strong>in</strong>dividual constituents. DAYFLOW output is used<br />
extensively <strong>in</strong> studies conducted by <strong>the</strong> Department of Water Resources (DWR), <strong>the</strong><br />
Department of Fish <strong>and</strong> Game (DFG), <strong>and</strong> o<strong>the</strong>r agencies. Model output is available<br />
electronically at http://www.iep.ca.gov/dayflow/<strong>in</strong>dex.html.<br />
Annual water supply diversions at <strong>the</strong> Banks Pump<strong>in</strong>g Plant (SWP), Tracy Pump<strong>in</strong>g<br />
Plant (CVP), Contra Costa Water District’s Rock Slough <strong>and</strong> Old River pump<strong>in</strong>g<br />
plants (CCC), <strong>and</strong> <strong>the</strong> North Bay Aqueduct’s Barker Slough Pump<strong>in</strong>g Plant (NBAQ)<br />
are shown <strong>in</strong> Figure 5-2. The nam<strong>in</strong>g conventions on this figure are consistent with<br />
<strong>the</strong> DAYFLOW <strong>model</strong> diversion names shown <strong>in</strong> Figure 5-1. Over 95% of <strong>the</strong> water<br />
diverted from <strong>the</strong> Delta is diverted at <strong>the</strong> Banks <strong>and</strong> Tracy pump<strong>in</strong>g plants. The sum<br />
of water diversions from <strong>the</strong> Delta is shown as a percentage of annual flows from <strong>the</strong><br />
major tributaries (Sacramento <strong>and</strong> San Joaqu<strong>in</strong> Rivers) <strong>in</strong> Figure 5-3. Over <strong>the</strong> water<br />
years 1983-2004, <strong>the</strong> average amount of water diverted was 5.2 million acre feet,<br />
vary<strong>in</strong>g between 3.1 <strong>and</strong> 6.3 million acre feet. Compared to <strong>the</strong> variability of tributary<br />
flows <strong>in</strong>to <strong>the</strong> Delta, <strong>the</strong> diversion volumes are relatively uni<strong>for</strong>m. In dry years, such<br />
as <strong>the</strong> late 1980s <strong>and</strong> <strong>the</strong> early 1990s, diversions by <strong>the</strong> projects can be nearly 50% of<br />
Delta <strong>in</strong>flows. In more recent years, because of higher tributary <strong>in</strong>flows, <strong>the</strong><br />
diversions have been a smaller fraction of <strong>the</strong> <strong>in</strong>flows, but even so, diversions of 30-<br />
40% are common.<br />
5-2 April 14, 2006
Conceptual Model <strong>for</strong> Organic Carbon <strong>in</strong> <strong>the</strong> Central Valley Chapter 5.0<br />
LEGEND<br />
QSJR<br />
QMISC<br />
QMOKE<br />
QCSMR<br />
QSAC<br />
QYOLO<br />
GGCD<br />
QPREC<br />
QOUT<br />
QEXP<br />
QCCC<br />
QMISDV<br />
San Joaqu<strong>in</strong> River flow<br />
Miscellaneous streamflow<br />
Mokelumne River flow<br />
Cosumnes River flow<br />
Sacramento River flow<br />
Yolo Bypass flow<br />
Gross channel depletion<br />
Precipitation runoff<br />
Delta outflow<br />
Exports<br />
Contra Costa Water District Diversions at<br />
Rock Slough <strong>and</strong> Old River<br />
Flooded isl<strong>and</strong> <strong>and</strong> isl<strong>and</strong> storage diversion<br />
State Water Project exports at Banks<br />
QSWP<br />
Pump<strong>in</strong>g Plant<br />
QCVP Central Valley Project pump<strong>in</strong>g at Tracy<br />
QNBAQ North Bay Aqueduct export<br />
Note: In DAYFLOW equations, QMISDV replaced with<br />
QNBAQ. Updated figure not available.<br />
Figure 5-1. Delta locations with daily flow data reported <strong>in</strong> <strong>the</strong> DAYFLOW <strong>model</strong>. (Figure reproduced<br />
from http://wwwiep.water.ca.gov/dayflow/documentation/fig2.jpg).<br />
8<br />
Exports <strong>in</strong> Million Acre Feet<br />
6<br />
4<br />
2<br />
SWP<br />
CVP<br />
CCC<br />
NBAQ<br />
0<br />
1985 1990 1995 2000 2005<br />
Figure 5-2. Annual water supply diversions (Banks Pump<strong>in</strong>g Plant (SWP), Tracy Pump<strong>in</strong>g Plant (CVP),<br />
Contra Costa Water District’s Rock Slough <strong>and</strong> Old River pump<strong>in</strong>g plants (CCC), <strong>and</strong> <strong>the</strong><br />
North Bay Aqueduct’s Barker Slough Pump<strong>in</strong>g Plant (NBAQ) as reported <strong>in</strong> <strong>the</strong> DAYFLOW<br />
<strong>model</strong>.<br />
April 14, 2006 5-3
Chapter 5.0<br />
Conceptual Model <strong>for</strong> Organic Carbon <strong>in</strong> <strong>the</strong> Central Valley<br />
Flow <strong>in</strong> Million Acre-Feet<br />
60<br />
50<br />
40<br />
30<br />
20<br />
10<br />
Sacramento Runoff WY sum<br />
San Joaqu<strong>in</strong> Runoff WY sum<br />
Export % of Total Inflow<br />
60<br />
50<br />
40<br />
30<br />
20<br />
10<br />
Export as Percent of<br />
Sacramento <strong>and</strong> San Joaqu<strong>in</strong> Inflow<br />
0<br />
0<br />
1985 1990 1995 2000 2005<br />
Water Year<br />
Figure 5-3. The sum of project diversions as a percentage of annual flows from <strong>the</strong> major tributaries<br />
(Sacramento <strong>and</strong> San Joaqu<strong>in</strong> Rivers) to <strong>the</strong> Delta.<br />
5.2 PATTERNS IN ORGANIC CARBON CONCENTRATIONS<br />
This discussion of <strong>organic</strong> <strong>carbon</strong> concentrations is based on data collected by <strong>the</strong><br />
MWQI Program. This program obta<strong>in</strong>s grab sample data on TOC, DOC, <strong>and</strong><br />
UVA254 at 10 locations around <strong>the</strong> Delta. In previous years, MWQI also collected<br />
data from Delta agricultural dra<strong>in</strong>s. Dissolved <strong>and</strong> total <strong>organic</strong> <strong>carbon</strong> concentrations<br />
from all sources to <strong>the</strong> Delta are well correlated, with most of <strong>the</strong> <strong>organic</strong> <strong>carbon</strong><br />
be<strong>in</strong>g <strong>in</strong> <strong>the</strong> dissolved <strong>for</strong>m. This is true of both tributaries <strong>and</strong> agricultural dra<strong>in</strong>s on<br />
Delta isl<strong>and</strong>s (Figure 5-4). UVA254 data, a general measure of <strong>organic</strong> <strong>carbon</strong><br />
reactivity as discussed <strong>in</strong> Chapter 2, are also well correlated with DOC concentrations<br />
over <strong>the</strong> range of concentrations obta<strong>in</strong>ed <strong>in</strong> <strong>the</strong> tributaries <strong>and</strong> agricultural dra<strong>in</strong>s.<br />
However, this relationship is dom<strong>in</strong>ated by <strong>the</strong> agricultural dra<strong>in</strong> data, especially at<br />
high concentrations. Over a narrower range of concentrations, more typical of what is<br />
seen <strong>in</strong> <strong>the</strong> Sacramento <strong>and</strong> San Joaqu<strong>in</strong> Rivers, <strong>the</strong> relationship is far more noisy<br />
(Figure 5-5 upper <strong>and</strong> lower panels). These data are <strong>in</strong> agreement with past work<br />
(e.g., Fujii et al., 1998 <strong>and</strong> o<strong>the</strong>rs discussed <strong>in</strong> Chapter 2) that suggests locations with<br />
vary<strong>in</strong>g sources of <strong>organic</strong> matter are more likely to have variable UVA responses<br />
than locations with a relatively homogeneous source of <strong>organic</strong> matter.<br />
5-4 April 14, 2006
Conceptual Model <strong>for</strong> Organic Carbon <strong>in</strong> <strong>the</strong> Central Valley Chapter 5.0<br />
120<br />
DOC/TOC Expressed as Percent<br />
100<br />
80<br />
60<br />
40<br />
Sacramento River San Joaqu<strong>in</strong> River Delta Ag Dra<strong>in</strong>s<br />
Sources<br />
Figure 5-4. Relationship between dissolved <strong>and</strong> total <strong>organic</strong> <strong>carbon</strong> concentrations at key Delta<br />
locations.<br />
April 14, 2006 5-5
Chapter 5.0<br />
Conceptual Model <strong>for</strong> Organic Carbon <strong>in</strong> <strong>the</strong> Central Valley<br />
5<br />
UV Absorbance at 254 nm<br />
4<br />
3<br />
2<br />
1<br />
Hood/Greene's L<strong>and</strong><strong>in</strong>g<br />
Vernalis<br />
Banks Intake<br />
Delta Isl<strong>and</strong>s<br />
0<br />
0 20 40 60 80 100 120<br />
DOC (mg/l)<br />
0.5<br />
UV Absorbance at 254 nm<br />
0.4<br />
0.3<br />
0.2<br />
0.1<br />
Hood/Greene's L<strong>and</strong><strong>in</strong>g<br />
Vernalis<br />
Banks Intake<br />
Delta Isl<strong>and</strong>s<br />
0.0<br />
0 2 4 6 8 10 12<br />
DOC (mg/l)<br />
Figure 5-5. Dissolved <strong>organic</strong> <strong>carbon</strong> concentrations <strong>and</strong> UVA at 254 nm at key Delta locations.<br />
The SUVA254 values (where <strong>the</strong> UVA is normalized by <strong>the</strong> DOC concentration) <strong>for</strong><br />
<strong>the</strong> Sacramento River at Hood are similar to <strong>the</strong> SUVA values <strong>for</strong> <strong>the</strong> San Joaqu<strong>in</strong><br />
River at Vernalis (Figure 5-6). This <strong>in</strong>dicates, albeit at a gross level, little systematic<br />
difference <strong>in</strong> <strong>the</strong> DOC structure between <strong>the</strong> two sources. However, <strong>the</strong> values at <strong>the</strong><br />
Banks Pump<strong>in</strong>g Plant are somewhat higher, <strong>in</strong>dicat<strong>in</strong>g a marg<strong>in</strong>ally more reactive<br />
source that is consistent with <strong>in</strong>-Delta supplies of more labile <strong>organic</strong> matter from<br />
primary production.<br />
5-6 April 14, 2006
Conceptual Model <strong>for</strong> Organic Carbon <strong>in</strong> <strong>the</strong> Central Valley Chapter 5.0<br />
0.10<br />
0.08<br />
SUVA-254 (L/mg-cm)<br />
0.06<br />
0.04<br />
0.02<br />
0.00<br />
Hood Vernalis Banks<br />
Station<br />
Figure 5-6. SUVA254 values (UVA normalized by <strong>the</strong> concentration of <strong>organic</strong> <strong>carbon</strong>) at Sacramento<br />
River (Hood), San Joaqu<strong>in</strong> River (Vernalis) <strong>and</strong> Banks Pump<strong>in</strong>g Plant.<br />
Some of <strong>the</strong> longest records of <strong>organic</strong> <strong>carbon</strong> concentrations exist at <strong>the</strong> Sacramento<br />
River at Greene’s L<strong>and</strong><strong>in</strong>g/Hood, San Joaqu<strong>in</strong> River at Vernalis, <strong>and</strong> <strong>the</strong> Banks<br />
Pump<strong>in</strong>g Plant. The two river locations are important because <strong>the</strong>y constitute <strong>the</strong><br />
majority of <strong>the</strong> flow <strong>in</strong>to <strong>the</strong> Delta, <strong>and</strong> <strong>the</strong> Banks Pump<strong>in</strong>g Plant is <strong>the</strong> largest water<br />
diversion from <strong>the</strong> Delta. Figure 5-7 presents water column concentrations of DOC at<br />
<strong>the</strong>se locations from 1990 to 2005. Several <strong>in</strong>terest<strong>in</strong>g observations result:<br />
• Concentrations <strong>in</strong> <strong>the</strong> Sacramento River are almost always substantially lower<br />
than <strong>in</strong> <strong>the</strong> San Joaqu<strong>in</strong> River.<br />
• Concentrations <strong>in</strong> <strong>the</strong> Sacramento River rarely fall below 1.5 mg/l, <strong>and</strong> those<br />
<strong>in</strong> <strong>the</strong> San Joaqu<strong>in</strong> River rarely fall below 2 mg/l.<br />
• Concentrations at <strong>the</strong> Banks Pump<strong>in</strong>g Plant are almost always higher than <strong>in</strong><br />
<strong>the</strong> Sacramento River, <strong>and</strong> are usually similar to <strong>the</strong> concentrations <strong>in</strong> <strong>the</strong> San<br />
Joaqu<strong>in</strong> River.<br />
April 14, 2006 5-7
Chapter 5.0 Conceptual Model <strong>for</strong> Organic Carbon <strong>in</strong> <strong>the</strong> Central Valley<br />
12<br />
10<br />
Sacramento R at Hood/Greene's<br />
L<strong>and</strong><strong>in</strong>g<br />
San Joaqu<strong>in</strong> River at Vernalis Banks Intake<br />
Dry Year Wet Year<br />
8<br />
6<br />
DOC (mg/l)<br />
4<br />
2<br />
0<br />
1/90 1/91 1/92 1/93 1/94 1/95 1/96 1/97 1/98 1/99 1/00 1/01 1/02 1/03 1/04 1/05<br />
Date<br />
Figure 5-7. DOC concentrations at Sacramento River (Hood), San Joaqu<strong>in</strong> River (Vernalis) <strong>and</strong> Banks Pump<strong>in</strong>g Plant.<br />
5-8 April 14, 2006
Conceptual Model <strong>for</strong> Organic Carbon <strong>in</strong> <strong>the</strong> Central Valley Chapter 5.0<br />
A fur<strong>the</strong>r plot of DOC at <strong>the</strong> tributaries <strong>and</strong> DOC at Banks (Figure 5-8) shows a<br />
somewhat stronger correlation between San Joaqu<strong>in</strong> <strong>and</strong> Banks concentrations than<br />
between Sacramento <strong>and</strong> Banks concentrations. However, <strong>the</strong> correlation coefficients<br />
<strong>in</strong> Figure 5-8 are not high enough to suggest that ei<strong>the</strong>r of <strong>the</strong> tributary concentrations<br />
can adequately expla<strong>in</strong> what is observed at <strong>the</strong> Banks <strong>in</strong>take. The higher coefficient<br />
<strong>for</strong> <strong>the</strong> San Joaqu<strong>in</strong> flows, as compared to <strong>the</strong> Sacramento River flows, may <strong>in</strong> part be<br />
due to <strong>the</strong> proximity of <strong>the</strong> two locations <strong>and</strong>/or preferential flow paths. The<br />
occasional elevations of concentrations at <strong>the</strong> Banks Intake even above <strong>the</strong> San<br />
Joaqu<strong>in</strong> River concentrations, are <strong>in</strong>dicative of <strong>in</strong>-Delta sources, although <strong>the</strong> data <strong>in</strong><br />
Figures 5-7 <strong>and</strong> 5-8 alone are <strong>in</strong>sufficient to quantify <strong>the</strong>ir significance. The<br />
concentrations at <strong>the</strong> Banks Pump<strong>in</strong>g Plant, <strong>and</strong> at o<strong>the</strong>r diversions <strong>in</strong> <strong>the</strong> Delta, are<br />
due to a complex mixture of <strong>the</strong> Sacramento River, <strong>the</strong> San Joaqu<strong>in</strong> River, <strong>and</strong> <strong>in</strong>-<br />
Delta sources. The relative contribution of each of <strong>the</strong>se sources is discussed <strong>in</strong> more<br />
detail <strong>in</strong> Section 5.5.2.<br />
8<br />
r 2 = 0.18<br />
DOC at Banks Intake (mg/l)<br />
6<br />
4<br />
r 2 = 0.41<br />
2<br />
Hood/Greene's L<strong>and</strong><strong>in</strong>g<br />
Vernalis<br />
0<br />
0 2 4 6 8<br />
DOC at Hood/Greene's L<strong>and</strong><strong>in</strong>g or Vernalis (mg/l)<br />
Figure 5-8. Correlation between DOC at <strong>the</strong> tributaries <strong>and</strong> DOC at Banks Pump<strong>in</strong>g Plant.<br />
April 14, 2006 5-9
Chapter 5.0<br />
Conceptual Model <strong>for</strong> Organic Carbon <strong>in</strong> <strong>the</strong> Central Valley<br />
Automatic <strong>organic</strong> <strong>carbon</strong> analyzers have recently been <strong>in</strong>stalled <strong>in</strong> <strong>the</strong> Sacramento<br />
River at Hood, <strong>the</strong> San Joaqu<strong>in</strong> River at Vernalis, <strong>and</strong> at <strong>the</strong> Banks Pump<strong>in</strong>g Plant.<br />
The analyzers measure TOC <strong>and</strong> DOC by a combustion method <strong>and</strong> <strong>the</strong> Hood<br />
location also has a wet-oxidation method analyzer. Real time data <strong>for</strong> Hood <strong>and</strong><br />
Banks are plotted with grab sample monitor<strong>in</strong>g data <strong>for</strong> comparison <strong>in</strong> Figure 5-9. In<br />
<strong>the</strong> future, <strong>the</strong> real time data will provide a more comprehensive underst<strong>and</strong><strong>in</strong>g of<br />
<strong>organic</strong> <strong>carbon</strong> concentrations <strong>and</strong> will allow a more ref<strong>in</strong>ed estimate of loads dur<strong>in</strong>g<br />
<strong>the</strong> wet season when concentrations change rapidly. Ano<strong>the</strong>r goal of real time<br />
monitor<strong>in</strong>g is to <strong>in</strong><strong>for</strong>m water utility managers so <strong>the</strong>y can adjust <strong>the</strong>ir operations to<br />
adapt to <strong>carbon</strong> fluctuations <strong>and</strong> spikes.<br />
12<br />
10<br />
H.O. Banks Intake<br />
Autosampler<br />
Grab Samples<br />
TOC (mg/l)<br />
8<br />
6<br />
4<br />
2<br />
0<br />
10/03 2/04 6/04 10/04 2/05 6/05<br />
Date<br />
10<br />
8<br />
Sacramento River at Hood<br />
Autosampler<br />
Grab Samples<br />
TOC (mg/l)<br />
6<br />
4<br />
2<br />
0<br />
10/03 2/04 6/04 10/04 2/05 6/05<br />
Date<br />
Figure 5-9. Real-time TOC data compared with grab sample data at Sacramento River (Hood) <strong>and</strong> Banks<br />
Pump<strong>in</strong>g Plant.<br />
5-10 April 14, 2006
Conceptual Model <strong>for</strong> Organic Carbon <strong>in</strong> <strong>the</strong> Central Valley Chapter 5.0<br />
5.3 ORGANIC CARBON LOADS<br />
To account <strong>for</strong> <strong>the</strong> various <strong>in</strong>flows <strong>and</strong> outflows of <strong>organic</strong> <strong>carbon</strong> <strong>in</strong> <strong>the</strong> Delta, <strong>the</strong><br />
<strong>in</strong>puts from tributary <strong>and</strong> <strong>in</strong>-Delta sources <strong>and</strong> <strong>the</strong> exports to San Francisco Bay <strong>and</strong><br />
water supply diversions were quantified. The tributary <strong>in</strong>puts <strong>and</strong> <strong>the</strong> exports to <strong>the</strong><br />
Bay were estimated <strong>in</strong> Chapter 4. This chapter describes <strong>the</strong> approach used to<br />
estimate <strong>organic</strong> <strong>carbon</strong> exported <strong>in</strong> water supply diversions <strong>and</strong> <strong>in</strong> loads generated<br />
with<strong>in</strong> <strong>the</strong> Delta.<br />
5.3.1 EXPORT IN WATER SUPPLY DIVERSIONS<br />
Organic <strong>carbon</strong> concentration data from four of <strong>the</strong> water supply diversions <strong>in</strong> <strong>the</strong><br />
Delta (expressed as TOC <strong>in</strong> three out of four cases), are paired with flow rates to<br />
estimate <strong>the</strong> exported <strong>organic</strong> <strong>carbon</strong> loads. Loads are calculated <strong>in</strong> <strong>the</strong> same manner<br />
as described <strong>in</strong> Chapter 4 <strong>for</strong> <strong>the</strong> stream loads, us<strong>in</strong>g monthly average concentration<br />
<strong>and</strong> flow data. The monthly average <strong>organic</strong> <strong>carbon</strong> concentrations <strong>for</strong> <strong>the</strong> water<br />
supply diversions, along with <strong>the</strong> data count, are shown <strong>in</strong> Figure 5-10. These<br />
concentrations were used to estimate monthly loads of <strong>organic</strong> <strong>carbon</strong> us<strong>in</strong>g<br />
DAYFLOW flow data. The annual <strong>organic</strong> <strong>carbon</strong> exports over <strong>the</strong> water years 1984-<br />
2004 are shown <strong>in</strong> Figure 5-11. Because <strong>the</strong> flow volumes <strong>in</strong> <strong>the</strong> exports are<br />
relatively uni<strong>for</strong>m, <strong>the</strong> estimated annual loads vary over a fairly narrow range, 20,000<br />
to 35,000 tons/year.<br />
April 14, 2006 5-11
Chapter 5.0<br />
Conceptual Model <strong>for</strong> Organic Carbon <strong>in</strong> <strong>the</strong> Central Valley<br />
8<br />
Contra Costa Water District (CCC)<br />
Jan (9)<br />
Feb (8)<br />
Mar (5)<br />
Apr (10)<br />
May (7)<br />
Jun (10)<br />
Jul (5)<br />
Aug (6)<br />
Sep (5)<br />
Oct (10)<br />
Nov (11)<br />
Dec (9)<br />
Average TOC (mg/l)<br />
6<br />
4<br />
2<br />
0<br />
Month<br />
8<br />
Banks Pump<strong>in</strong>g Plant (SWP)<br />
Jan (6)<br />
Feb (7)<br />
Mar (5)<br />
Apr (5)<br />
May (5)<br />
Jun (4)<br />
Jul (11)<br />
Aug (14)<br />
Sep (15)<br />
Oct (10)<br />
Nov (10)<br />
Dec (8)<br />
Average TOC (mg/l)<br />
6<br />
4<br />
2<br />
0<br />
Month<br />
8<br />
Tracy Pump<strong>in</strong>g Plant (CVP)<br />
Jan (14)<br />
Feb (10)<br />
Mar (14)<br />
Apr (13)<br />
May (12)<br />
Jun (11)<br />
Jul (16)<br />
Aug (16)<br />
Sep (17)<br />
Oct (17)<br />
Nov (7)<br />
Dec (9)<br />
Average DOC (mg/l)<br />
6<br />
4<br />
2<br />
0<br />
Month<br />
18<br />
16<br />
Barker Slough Pump<strong>in</strong>g Plant (NBAQ)<br />
Jan (39)<br />
Feb (25)<br />
Mar (22)<br />
Apr (10)<br />
May (7)<br />
Jun (5)<br />
Jul (5)<br />
Aug (7)<br />
Sep (9)<br />
Oct (7)<br />
Nov (19)<br />
Average TOC (mg/l)<br />
Dec (27)<br />
14<br />
12<br />
10<br />
8<br />
6<br />
4<br />
2<br />
0<br />
Month<br />
Figure 5-10. Organic <strong>carbon</strong> concentrations at water supply diversions. The number of data po<strong>in</strong>ts is<br />
shown after each month.<br />
5-12 April 14, 2006
Conceptual Model <strong>for</strong> Organic Carbon <strong>in</strong> <strong>the</strong> Central Valley Chapter 5.0<br />
40000<br />
Organic Carbon Exports<br />
SWP<br />
CVP<br />
CCC<br />
NBAQ<br />
Organic Carbon Export <strong>in</strong> Tons<br />
30000<br />
20000<br />
10000<br />
D<br />
D D D<br />
W<br />
D<br />
W<br />
W<br />
D D<br />
D<br />
W W W<br />
W W<br />
W<br />
D<br />
D<br />
W<br />
D<br />
0<br />
1985 1990 1995 2000 2005<br />
Water Year<br />
Figure 5-11. Annual <strong>organic</strong> <strong>carbon</strong> exports over <strong>the</strong> water years 1984-2004.<br />
5.3.2 ORGANIC CARBON SOURCES IN THE DELTA<br />
The Delta conta<strong>in</strong>s three major known sources of <strong>organic</strong> <strong>carbon</strong>: primary production<br />
<strong>in</strong> <strong>the</strong> water column, export from agriculture on Delta Isl<strong>and</strong>s, <strong>and</strong> export from tidal<br />
marshes. In addition, urban areas are rapidly develop<strong>in</strong>g along <strong>the</strong> fr<strong>in</strong>ges of <strong>the</strong><br />
Delta. At this time <strong>the</strong>re are <strong>in</strong>sufficient data to characterize <strong>the</strong> load of <strong>organic</strong><br />
<strong>carbon</strong> from urban runoff <strong>and</strong> wastewater discharged <strong>in</strong>to Delta channels.<br />
Primary productivity <strong>in</strong> <strong>the</strong> Delta was estimated us<strong>in</strong>g direct measurements of<br />
productivity on a small number of dates (Jassby et al. 2002). The direct measurements<br />
of primary productivity were related to a <strong>model</strong> of productivity that was a function of<br />
water turbidity <strong>and</strong> solar radiation. A long-term record of radiation <strong>and</strong> light<br />
attenuation was used to estimate an average primary production of 70 g C/m2/yr.<br />
With a Delta water area of 24,000 acres this translates to roughly 7,000 tons/year of<br />
<strong>carbon</strong> due to <strong>in</strong>ternal primary productivity <strong>in</strong> <strong>the</strong> waters of <strong>the</strong> Delta. While this<br />
estimate is useful <strong>for</strong> comparison with o<strong>the</strong>r sources of <strong>organic</strong> <strong>carbon</strong> <strong>in</strong> <strong>the</strong> system,<br />
<strong>the</strong>re was also a significant year-to-year variation <strong>in</strong> primary productivity reported,<br />
with <strong>the</strong> highest estimate five times <strong>the</strong> lowest estimate. In addition <strong>the</strong>re is a<br />
generally decl<strong>in</strong><strong>in</strong>g trend <strong>in</strong> primary productivity <strong>in</strong> <strong>the</strong> Delta. There are several<br />
hypo<strong>the</strong>ses <strong>for</strong> this <strong>in</strong>ter-annual variability <strong>and</strong> long-term decl<strong>in</strong>e. Changes <strong>in</strong> water<br />
residence time due to variability <strong>in</strong> <strong>the</strong> flows of <strong>the</strong> Sacramento <strong>and</strong> San Joaqu<strong>in</strong><br />
Rivers, changes <strong>in</strong> populations of primary consumers (such as <strong>the</strong> exotic clam,<br />
Potamocorbula amurensis after 1987 as well as o<strong>the</strong>r filter feed<strong>in</strong>g primary<br />
consumers), <strong>and</strong> reductions of suspended solids concentrations due to dam<br />
construction may all be factors affect<strong>in</strong>g productivity.<br />
April 14, 2006 5-13
Chapter 5.0<br />
Conceptual Model <strong>for</strong> Organic Carbon <strong>in</strong> <strong>the</strong> Central Valley<br />
Tidal marsh <strong>organic</strong> <strong>carbon</strong> export rates have not been estimated directly <strong>in</strong> <strong>the</strong> Delta.<br />
Based on a review of <strong>the</strong> literature, Jassby <strong>and</strong> Cloern (2000) estimated an export rate<br />
of 150 g C/m 2 /yr (150 tons C/km2/yr), a value far greater than <strong>the</strong> export rates of any<br />
of <strong>the</strong> l<strong>and</strong> uses considered <strong>in</strong> Chapter 4. USGS is conduct<strong>in</strong>g a study on Twitchell<br />
Isl<strong>and</strong> <strong>in</strong> <strong>the</strong> Delta <strong>and</strong> has estimated an export rate of 110 gC/m 2 /yr (Personal<br />
Communication, Roger Fujii). Us<strong>in</strong>g <strong>the</strong> literature values <strong>and</strong> assum<strong>in</strong>g a marsh area<br />
of 8150 acres (Jassby <strong>and</strong> Cloern,2000), this translates to 4950 tons of <strong>organic</strong> <strong>carbon</strong><br />
released from <strong>the</strong> Delta tidal marshes to <strong>the</strong> surround<strong>in</strong>g waters. Additional research<br />
is needed on Delta tidal marshes to better quantify <strong>the</strong>se export rates.<br />
Contributions from Delta agriculture were estimated us<strong>in</strong>g agricultural dra<strong>in</strong><br />
concentration data <strong>and</strong> total flow approximations from <strong>the</strong> Delta Isl<strong>and</strong> Consumptive<br />
Use (DICU) computer <strong>model</strong>. There are substantial DOC data from Delta agricultural<br />
dra<strong>in</strong>s collected by MWQI, as shown <strong>in</strong> Figure 5-12. There are less TOC data on<br />
Delta agricultural dra<strong>in</strong>s so DOC was used to approximate TOC loads. In general,<br />
MWQI data show that DOC represents approximately 90 percent of TOC. The Delta<br />
agricultural dra<strong>in</strong>age concentrations are substantially higher than <strong>the</strong> agricultural<br />
dra<strong>in</strong>age concentrations from <strong>the</strong> Sacramento River watershed (Colusa Bas<strong>in</strong> Dra<strong>in</strong>)<br />
<strong>and</strong> <strong>the</strong> San Joaqu<strong>in</strong> River watershed (Hard<strong>in</strong>g Dra<strong>in</strong>) discussed <strong>in</strong> Chapter 4. As<br />
shown <strong>in</strong> Figure 5-13, <strong>the</strong> highest concentrations occur dur<strong>in</strong>g <strong>the</strong> wet months.<br />
The DICU <strong>model</strong> was developed to estimate <strong>the</strong> diversions <strong>and</strong> return flows of Delta<br />
waters <strong>in</strong>to agricultural l<strong>and</strong> on Delta isl<strong>and</strong>s. The <strong>model</strong> is calibrated from a detailed<br />
hydrologic study on Twitchell Isl<strong>and</strong> conducted <strong>in</strong> 1960. DICU estimates of flow <strong>for</strong><br />
each month were coupled with mean monthly DOC concentration data observed at all<br />
isl<strong>and</strong> dra<strong>in</strong>s from Figure 5-12, to estimate <strong>the</strong> load of <strong>organic</strong> <strong>carbon</strong> from Delta<br />
agricultural dra<strong>in</strong>age. The average annual load is estimated to be 14,800 tons/year. As<br />
shown <strong>in</strong> Figure 5-14, <strong>the</strong> highest concentrations of DOC occur <strong>in</strong> <strong>the</strong> wet w<strong>in</strong>ter<br />
months (January through March) which correspond with a peak <strong>in</strong> calculated<br />
discharge from <strong>the</strong> isl<strong>and</strong>s. Flows are also elevated <strong>in</strong> June through July, although<br />
<strong>the</strong>se are associated with lower concentrations. Exist<strong>in</strong>g <strong>in</strong><strong>for</strong>mation does not allow<br />
consideration of year-to-year variability.<br />
It is important to note that aqueous export of <strong>organic</strong> <strong>carbon</strong> from Delta isl<strong>and</strong>s<br />
constitutes less than 1% of <strong>the</strong> <strong>carbon</strong> loss from <strong>the</strong>se isl<strong>and</strong>s, with much of <strong>the</strong> rest<br />
be<strong>in</strong>g exported as gaseous <strong>carbon</strong> dioxide (Deverel <strong>and</strong> Rojstaczer, 1996).<br />
5-14 April 14, 2006
Conceptual Model <strong>for</strong> Organic Carbon <strong>in</strong> <strong>the</strong> Central Valley Chapter 5.0<br />
100<br />
80<br />
DOC (mg/l)<br />
60<br />
40<br />
20<br />
0<br />
Bacon Isl<strong>and</strong><br />
Bould<strong>in</strong> Tract<br />
Brannan Isl<strong>and</strong><br />
Dra<strong>in</strong> on Clifton Court<br />
Egbert Tract<br />
Gr<strong>and</strong> Isl<strong>and</strong><br />
Holl<strong>and</strong> Tract<br />
Jersey Isl<strong>and</strong><br />
K<strong>in</strong>g Isl<strong>and</strong><br />
Lower Jones Tract<br />
M<strong>and</strong>eville Isl<strong>and</strong><br />
McCormack/Williams Tr<br />
Moss Tract<br />
Mossdale Tract<br />
Ne<strong>the</strong>rl<strong>and</strong> Tract<br />
Orwood Tract<br />
Palm Tract<br />
Pescadero Tract<br />
Pierson Tract<br />
Prospect Isl<strong>and</strong><br />
R<strong>in</strong>dge Tract<br />
Rio Blanco Tract<br />
Shima Tract<br />
Staten Isl<strong>and</strong><br />
Term<strong>in</strong>ous Tract<br />
Twitchell Isl<strong>and</strong><br />
Tyler Isl<strong>and</strong><br />
Upper Egbert Tract<br />
Upper Jones Tract<br />
Venice Isl<strong>and</strong><br />
Webb Tract<br />
Woodward Isl<strong>and</strong><br />
Delta Isl<strong>and</strong> Name<br />
Figure 5-12. DOC concentrations <strong>in</strong> Delta agricultural dra<strong>in</strong>age.<br />
100<br />
Seasonal Variation <strong>in</strong> Delta Isl<strong>and</strong> Ag<br />
Dra<strong>in</strong> DOC Concentrations<br />
80<br />
DOC (mg/l)<br />
60<br />
40<br />
20<br />
0<br />
Jan Feb Mar Apr May Jun Jul Aug Sep Oct Nov Dec<br />
Month<br />
Figure 5-13. Seasonal variation <strong>in</strong> Delta agricultural dra<strong>in</strong>age DOC concentrations.<br />
April 14, 2006 5-15
Chapter 5.0<br />
Conceptual Model <strong>for</strong> Organic Carbon <strong>in</strong> <strong>the</strong> Central Valley<br />
Estimated Flow (cfs) or Estimated Load (tons)<br />
3500<br />
3000<br />
2500<br />
2000<br />
1500<br />
1000<br />
500<br />
0<br />
Flow (DICU Estimate)<br />
Calculated DOC Load<br />
DOC Concentration<br />
Annual Load = 14,757 tons<br />
Jan Feb Mar Apr May Jun Jul Aug Sep Oct Nov Dec<br />
30<br />
28<br />
26<br />
24<br />
22<br />
20<br />
18<br />
16<br />
14<br />
12<br />
10<br />
DOC (mg/l)<br />
Month<br />
Figure 5-14. DICU estimates of flow <strong>for</strong> each month coupled with mean monthly concentration data<br />
observed at all isl<strong>and</strong> dra<strong>in</strong>s from Figure 5-13, used to estimate <strong>the</strong> contribution of DOC<br />
from agriculture on Delta isl<strong>and</strong>s.<br />
5.3.3 SUMMARY OF ORGANIC CARBON LOADS IN THE DELTA<br />
Figure 5-15 presents annual averages of <strong>the</strong> tributary loads estimated <strong>in</strong> Chapter 4 <strong>and</strong><br />
<strong>the</strong> <strong>in</strong>-Delta loads estimated <strong>in</strong> this chapter, illustrat<strong>in</strong>g that <strong>the</strong> tributary loads are<br />
substantially greater than <strong>the</strong> <strong>in</strong>-Delta loads dur<strong>in</strong>g wet years. In wet years <strong>the</strong> <strong>in</strong>-Delta<br />
sources contribute approximately 15% of <strong>the</strong> total load. Year to year variations may be<br />
significant, <strong>and</strong> <strong>in</strong> dry years when <strong>the</strong> tributary loads are smaller, <strong>the</strong> <strong>in</strong>-Delta loads<br />
are approximately 33% of <strong>the</strong> total load. The <strong>in</strong>-Delta loads are based on far less data<br />
than <strong>the</strong> tributary loads <strong>and</strong> additional monitor<strong>in</strong>g is needed to provide a better<br />
estimate of <strong>in</strong>-Delta loads, particularly <strong>the</strong> loads due to primary productivity <strong>and</strong> tidal<br />
marshes.<br />
Figure 5-15 shows that dur<strong>in</strong>g wet years <strong>the</strong> load of <strong>organic</strong> <strong>carbon</strong> to <strong>the</strong> Delta<br />
(tributaries <strong>and</strong> <strong>in</strong>-Delta sources) exceeds <strong>the</strong> exports from <strong>the</strong> Delta (to <strong>the</strong> Bay <strong>and</strong><br />
<strong>the</strong> water diversions) by 50,000 tons. Dur<strong>in</strong>g dry years this drops to 28,000 tons. These<br />
are not precise numbers due to <strong>the</strong> uncerta<strong>in</strong>ty <strong>in</strong> <strong>the</strong> load estimates, particularly <strong>for</strong> <strong>the</strong><br />
<strong>in</strong>-Delta sources; however, some of this <strong>carbon</strong> is available as a food source <strong>for</strong> Delta<br />
organisms. Current work on ecosystem processes shows that although <strong>the</strong> tributary<br />
loads of <strong>organic</strong> <strong>carbon</strong> are much greater than <strong>the</strong> <strong>in</strong>-Delta primary production, it is <strong>the</strong><br />
latter that is more bioavailable <strong>and</strong> a more important food source to <strong>the</strong> biota <strong>in</strong> <strong>the</strong><br />
Delta.<br />
5-16 April 14, 2006
Conceptual Model <strong>for</strong> Organic Carbon <strong>in</strong> <strong>the</strong> Central Valley Chapter 5.0<br />
Figure 5-15. The tributary loads calculated <strong>in</strong> Chapter 4, along with <strong>the</strong> <strong>in</strong>ternal loads estimated <strong>in</strong><br />
Chapter 5.<br />
April 14, 2006 5-17
Chapter 5.0<br />
Conceptual Model <strong>for</strong> Organic Carbon <strong>in</strong> <strong>the</strong> Central Valley<br />
5.4 RELATING ORGANIC CARBON SOURCES AND CONCENTRATIONS AT INTAKES<br />
Estimates of <strong>organic</strong> <strong>carbon</strong> loads provide <strong>in</strong><strong>for</strong>mation on <strong>the</strong> major sources of<br />
<strong>organic</strong> <strong>carbon</strong> <strong>in</strong> <strong>the</strong> watersheds. The concentration of <strong>organic</strong> <strong>carbon</strong> <strong>in</strong> <strong>the</strong> source<br />
waters <strong>and</strong> <strong>the</strong> quality of <strong>the</strong> <strong>organic</strong> <strong>carbon</strong> are also of <strong>in</strong>terest. This <strong>in</strong>terest is driven<br />
by both regulatory requirements that base dr<strong>in</strong>k<strong>in</strong>g water treatment on <strong>the</strong><br />
concentration of <strong>organic</strong> <strong>carbon</strong> <strong>in</strong> <strong>the</strong> source water <strong>and</strong> on <strong>the</strong> goal of water suppliers<br />
to protect source water quality. To evaluate source water improvement strategies <strong>in</strong> a<br />
system as complicated as <strong>the</strong> Delta, <strong>the</strong> sources that are contribut<strong>in</strong>g to elevated<br />
<strong>organic</strong> <strong>carbon</strong> concentrations at <strong>the</strong> <strong>in</strong>takes must be identified.<br />
Detailed studies of <strong>organic</strong> <strong>carbon</strong> chemistry at various locations (reviewed <strong>in</strong><br />
Chapter 2) <strong>and</strong> monitor<strong>in</strong>g of various potential sources assist <strong>in</strong> identify<strong>in</strong>g <strong>and</strong><br />
characteriz<strong>in</strong>g <strong>the</strong> quantity <strong>and</strong> quality of <strong>organic</strong> <strong>carbon</strong> sources. Some studies<br />
“f<strong>in</strong>gerpr<strong>in</strong>t” sources based on <strong>organic</strong> <strong>carbon</strong> chemistry <strong>and</strong> use this f<strong>in</strong>gerpr<strong>in</strong>t to<br />
trace <strong>the</strong>m to dr<strong>in</strong>k<strong>in</strong>g water <strong>in</strong>takes. Ano<strong>the</strong>r method of f<strong>in</strong>gerpr<strong>in</strong>t<strong>in</strong>g is <strong>the</strong> use of<br />
numerical hydrodynamic <strong>model</strong>s. The two parallel l<strong>in</strong>es of <strong>in</strong>vestigation provide an<br />
<strong>in</strong>dependent verification of key f<strong>in</strong>d<strong>in</strong>gs, <strong>and</strong> over time, may lead to a comprehensive<br />
underst<strong>and</strong><strong>in</strong>g of <strong>organic</strong> <strong>carbon</strong> processes <strong>in</strong> <strong>the</strong> Delta.<br />
The Delta Simulation Model, Version II, or DSM2, is a river, estuary, <strong>and</strong> l<strong>and</strong><br />
<strong>model</strong><strong>in</strong>g framework that represents hydrodynamics <strong>and</strong> water quality processes<br />
throughout <strong>the</strong> Delta. DSM2 consists of two separate modules <strong>for</strong> hydrodynamics <strong>and</strong><br />
water quality, DSM2-Hydro <strong>and</strong> DSM2-Qual. Calculations are per<strong>for</strong>med us<strong>in</strong>g<br />
hydrology <strong>for</strong> a base period from 1976 to 1991, which conta<strong>in</strong>s a mix of wet <strong>and</strong> dry<br />
years. Us<strong>in</strong>g flow results from DSM2-Hydro, DOC concentrations at <strong>the</strong> Delta<br />
boundaries, <strong>and</strong> DOC concentrations <strong>in</strong> agricultural dra<strong>in</strong>age, DSM2 computes DOC<br />
at various locations throughout <strong>the</strong> Delta.<br />
DSM2 has also been used to <strong>in</strong>vestigate <strong>the</strong> contribution of flow <strong>and</strong> DOC by source<br />
at <strong>the</strong> Banks <strong>in</strong>take. Figure 5-16 presents <strong>the</strong> percent contribution of water at <strong>the</strong><br />
Banks Pump<strong>in</strong>g Plant from <strong>the</strong> Sacramento <strong>and</strong> San Joaqu<strong>in</strong> rivers <strong>and</strong> o<strong>the</strong>r sources<br />
from 1990 to 2004. This figure illustrates that <strong>in</strong> dry years <strong>the</strong> majority of water at <strong>the</strong><br />
Banks Pump<strong>in</strong>g Plant comes from <strong>the</strong> Sacramento River. Dur<strong>in</strong>g wet years, <strong>the</strong> San<br />
Joaqu<strong>in</strong> River contributes <strong>the</strong> majority of water <strong>for</strong> many months of <strong>the</strong> year. Long<br />
term f<strong>in</strong>gerpr<strong>in</strong>ts of <strong>organic</strong> <strong>carbon</strong> have not yet been completed.<br />
Figures 5-17 <strong>and</strong> 5-18 illustrate <strong>the</strong> percentage contribution of flow <strong>and</strong> <strong>the</strong><br />
contribution of DOC concentration by source at <strong>the</strong> Banks Pump<strong>in</strong>g Plant,<br />
respectively, <strong>for</strong> <strong>the</strong> period July 2005 to January 2006. Beg<strong>in</strong>n<strong>in</strong>g <strong>in</strong> August,<br />
Sacramento River flows dom<strong>in</strong>ate all o<strong>the</strong>r flows, while by January, San Joaqu<strong>in</strong><br />
River flows beg<strong>in</strong> to dom<strong>in</strong>ate at <strong>the</strong> <strong>in</strong>take (Figure 5-17). Similarly <strong>for</strong><br />
concentration, by August <strong>the</strong> Sacramento River contribution to DOC concentration<br />
has become larger than <strong>the</strong> San Joaqu<strong>in</strong> River contribution. In January, <strong>the</strong> San<br />
Joaqu<strong>in</strong> River contribution to DOC concentration dom<strong>in</strong>ates all o<strong>the</strong>r contributions to<br />
<strong>the</strong> concentration at Banks (Figure 5-18). This type of analysis can be used to<br />
identify <strong>the</strong> major sources of <strong>organic</strong> <strong>carbon</strong> at <strong>the</strong> Delta pump<strong>in</strong>g plants. This<br />
5-18 April 14, 2006
Conceptual Model <strong>for</strong> Organic Carbon <strong>in</strong> <strong>the</strong> Central Valley Chapter 5.0<br />
<strong>in</strong><strong>for</strong>mation, comb<strong>in</strong>ed with <strong>in</strong><strong>for</strong>mation on <strong>the</strong> periods of time when <strong>organic</strong> <strong>carbon</strong><br />
concentrations at <strong>the</strong> pump<strong>in</strong>g plants are problematic <strong>for</strong> dr<strong>in</strong>k<strong>in</strong>g water suppliers, can<br />
be used to identify management actions that could potentially improve water quality.<br />
Volume F<strong>in</strong>gerpr<strong>in</strong>t at Banks Pump<strong>in</strong>g Plant (SWP)<br />
O<strong>the</strong>r Ag Central Ag East Mtz Sac SJR<br />
Percent of Water by Source<br />
100%<br />
80%<br />
60%<br />
40%<br />
20%<br />
0%<br />
J-90<br />
J-91<br />
J-92<br />
J-93<br />
J-94<br />
J-95<br />
J-96<br />
J-97<br />
J-98<br />
J-99<br />
J-00<br />
J-01<br />
J-02<br />
J-03<br />
J-04<br />
Figure 5-16. Long-term percentage contribution of flows at <strong>the</strong> Banks Pump<strong>in</strong>g Plant (data provided by<br />
DWR).<br />
Modeled Volumetric F<strong>in</strong>gerpr<strong>in</strong>t at Banks Pump<strong>in</strong>g Plant<br />
Sac SJR East Delta Mtz<br />
Percent of Source Water<br />
100%<br />
90%<br />
80%<br />
70%<br />
60%<br />
50%<br />
40%<br />
30%<br />
20%<br />
10%<br />
0%<br />
7/1/2005<br />
8/1/2005<br />
9/1/2005<br />
10/1/2005<br />
11/1/2005<br />
12/1/2005<br />
1/1/2006<br />
Figure 5-17. Percentage contribution of flows at <strong>the</strong> Banks Pump<strong>in</strong>g Plant (data provided by DWR).<br />
April 14, 2006 5-19
Chapter 5.0<br />
Conceptual Model <strong>for</strong> Organic Carbon <strong>in</strong> <strong>the</strong> Central Valley<br />
Modeled DOC F<strong>in</strong>gerpr<strong>in</strong>t at Banks Pump<strong>in</strong>g Plant<br />
DOC-SAC DOC-SJR DOC-EAST DOC-Delta DOC<br />
DOC Source Contributions, mg/L<br />
5<br />
4<br />
3<br />
2<br />
1<br />
0<br />
7/1/2005<br />
8/1/2005<br />
9/1/2005<br />
10/1/2005<br />
11/1/2005<br />
12/1/2005<br />
1/1/2006<br />
Figure 5-18. Contribution of DOC by source at <strong>the</strong> Banks Pump<strong>in</strong>g Plant (data provided by DWR).<br />
The contribution of Delta isl<strong>and</strong>s to <strong>the</strong> DOC concentrations at various locations <strong>in</strong><br />
<strong>the</strong> Delta has been explored through DSM2 (DiGiorgio, 2003). Calculations were<br />
per<strong>for</strong>med <strong>for</strong> <strong>the</strong> base case, i.e., <strong>the</strong> isl<strong>and</strong>s exported <strong>organic</strong> <strong>carbon</strong> at <strong>the</strong>ir current<br />
rates, <strong>and</strong> a hypo<strong>the</strong>tical case where <strong>the</strong> isl<strong>and</strong>s contributed no <strong>organic</strong> <strong>carbon</strong> to <strong>the</strong><br />
Delta. It was found that sett<strong>in</strong>g Delta isl<strong>and</strong>s’ loads to zero led to a significant<br />
decrease <strong>in</strong> concentrations especially <strong>in</strong> summer <strong>and</strong> fall months. At <strong>the</strong> Banks <strong>in</strong>take<br />
<strong>for</strong> example (Figure 5-19), decreases of nearly 50% from <strong>the</strong> base case average<br />
concentration were calculated <strong>in</strong> dry years, result<strong>in</strong>g <strong>in</strong> DOC concentrations of 3<br />
mg/L or less <strong>in</strong> all months. Wet year concentration decreases were also significant,<br />
albeit smaller (maximum of 35%). Dur<strong>in</strong>g wet years DOC concentrations were<br />
reduced by 1 to 1.5 mg/L.<br />
The role of <strong>in</strong>-Delta sources, <strong>in</strong>clud<strong>in</strong>g Delta isl<strong>and</strong>s, has been identified as a<br />
significant source <strong>in</strong> past work us<strong>in</strong>g <strong>organic</strong> <strong>carbon</strong> chemistry (Bergamaschi et al.,<br />
1999). These <strong>model</strong><strong>in</strong>g <strong>and</strong> analytical f<strong>in</strong>d<strong>in</strong>gs, <strong>and</strong> <strong>the</strong>ir general agreement, are<br />
significant <strong>and</strong> provide <strong>in</strong><strong>for</strong>mation on <strong>the</strong> major sources of <strong>organic</strong> <strong>carbon</strong> at times<br />
when concentrations are problematic <strong>for</strong> water suppliers.<br />
5-20 April 14, 2006
Conceptual Model <strong>for</strong> Organic Carbon <strong>in</strong> <strong>the</strong> Central Valley Chapter 5.0<br />
Average DOC (mg/l)<br />
7<br />
6<br />
5<br />
4<br />
3<br />
2<br />
Dry Year<br />
Base case<br />
No Delta Agriculture<br />
1<br />
Average DOC (mg/l)<br />
0<br />
7<br />
6<br />
5<br />
4<br />
3<br />
2<br />
Jan Feb Mar Apr May Jun Jul Aug Sep Oct Nov Dec<br />
Wet Year<br />
Base case<br />
No Delta Agriculture<br />
1<br />
0<br />
Jan Feb Mar Apr May Jun Jul Aug Sep Oct Nov Dec<br />
Month<br />
Figure 5-19. Banks <strong>in</strong>take DOC concentrations <strong>for</strong> wet <strong>and</strong> dry years <strong>for</strong> base case conditions <strong>and</strong> <strong>for</strong> a<br />
hypo<strong>the</strong>tical case of no Delta Isl<strong>and</strong> dra<strong>in</strong> contribution. Based on data from DiGiorgio<br />
(2003).<br />
5.5 MAJOR FINDINGS<br />
The estimates of <strong>in</strong>-Delta loads of <strong>organic</strong> <strong>carbon</strong> are based on limited data <strong>and</strong> are<br />
fairly uncerta<strong>in</strong>. In-Delta primary productivity estimates are based on one study<br />
whose results were extrapolated both spatially <strong>and</strong> temporally to calculate <strong>organic</strong><br />
<strong>carbon</strong> loads from this source. Estimates of <strong>organic</strong> <strong>carbon</strong> loads from tidal marshes<br />
were based on data from <strong>the</strong> literature because studies <strong>in</strong> <strong>the</strong> Delta have not been<br />
completed. The concentrations of <strong>organic</strong> <strong>carbon</strong> <strong>in</strong> Delta agricultural dra<strong>in</strong>s has been<br />
well characterized by <strong>the</strong> MWQI Program but <strong>the</strong>re have been no recent direct<br />
measurements of flow <strong>for</strong> most of <strong>the</strong> Delta isl<strong>and</strong>s. Flow is currently estimated by<br />
April 14, 2006 5-21
Chapter 5.0<br />
Conceptual Model <strong>for</strong> Organic Carbon <strong>in</strong> <strong>the</strong> Central Valley<br />
<strong>the</strong> DICU <strong>model</strong>. Additional monitor<strong>in</strong>g <strong>and</strong> focused studies are needed to improve<br />
<strong>the</strong> <strong>in</strong>-Delta load estimates.<br />
The tributary loads of <strong>organic</strong> <strong>carbon</strong> are substantially greater than <strong>the</strong> <strong>in</strong>-Delta loads<br />
dur<strong>in</strong>g wet years. In wet years <strong>the</strong> <strong>in</strong>-Delta sources contribute approximately 15% of<br />
<strong>the</strong> total load. Year to year variations may be significant, <strong>and</strong> <strong>in</strong> dry years when <strong>the</strong><br />
tributary loads are smaller, <strong>the</strong> <strong>in</strong>-Delta loads are approximately 33% of <strong>the</strong> total load.<br />
The contribution of various sources to <strong>organic</strong> <strong>carbon</strong> concentrations at <strong>the</strong> <strong>in</strong>takes is<br />
best estimated through a numerical hydrodynamic <strong>model</strong> developed by DWR<br />
(DSM2). A f<strong>in</strong>gerpr<strong>in</strong>t<strong>in</strong>g study <strong>for</strong> 1990 to 2004 shows that <strong>the</strong> Sacramento River is<br />
<strong>the</strong> predom<strong>in</strong>ant source of water at <strong>the</strong> Banks Pump<strong>in</strong>g Plant dur<strong>in</strong>g dry years <strong>and</strong><br />
that dur<strong>in</strong>g wet years <strong>the</strong> San Joaqu<strong>in</strong> River contributes a substantial amount of water.<br />
F<strong>in</strong>gerpr<strong>in</strong>t<strong>in</strong>g studies on <strong>organic</strong> <strong>carbon</strong> have been completed <strong>for</strong> recent periods.<br />
These studies, comb<strong>in</strong>ed with <strong>in</strong><strong>for</strong>mation on <strong>the</strong> periods of time when <strong>organic</strong><br />
<strong>carbon</strong> concentrations at <strong>the</strong> pump<strong>in</strong>g plants are problematic <strong>for</strong> dr<strong>in</strong>k<strong>in</strong>g water<br />
suppliers, can be used to identify management actions that could potentially improve<br />
water quality.<br />
One study exam<strong>in</strong>ed <strong>the</strong> impact of remov<strong>in</strong>g all Delta agricultural dra<strong>in</strong>age from <strong>the</strong><br />
Delta. Although this is a hypo<strong>the</strong>tical scenario because it would be impossible to<br />
remove all of <strong>the</strong> dra<strong>in</strong>age, it po<strong>in</strong>ts out <strong>the</strong> important contribution agricultural<br />
dra<strong>in</strong>age makes to DOC concentrations at <strong>the</strong> Banks Pump<strong>in</strong>g Plant. In addition, it<br />
demonstrates <strong>the</strong> ability of <strong>the</strong> <strong>model</strong>s to assist <strong>in</strong> analyz<strong>in</strong>g actions that could<br />
potentially improve water quality at <strong>the</strong> Delta pump<strong>in</strong>g plants.<br />
5-22 April 14, 2006
CHAPTER 6.0<br />
MAJOR FINDINGS AND<br />
RECOMMENDATIONS FOR FUTURE<br />
WORK<br />
The development of <strong>the</strong> <strong>conceptual</strong> <strong>model</strong> <strong>in</strong> this report <strong>in</strong>volved <strong>the</strong> syn<strong>the</strong>sis of a<br />
large amount of data <strong>and</strong> <strong>in</strong><strong>for</strong>mation from published reports. The <strong>model</strong> provides a<br />
succ<strong>in</strong>ct summary of a tremendous amount of work that has been conducted <strong>in</strong> <strong>the</strong><br />
Central Valley-Delta region <strong>in</strong> <strong>the</strong> last 25 years. The <strong>conceptual</strong> <strong>model</strong> can be used to<br />
direct future <strong>in</strong>vestigations to improve underst<strong>and</strong><strong>in</strong>g of <strong>organic</strong> <strong>carbon</strong>-related<br />
sources, trans<strong>for</strong>mations, impacts, <strong>and</strong> management. This chapter summarizes key<br />
f<strong>in</strong>d<strong>in</strong>gs <strong>and</strong> highlights future concerns.<br />
6.1 MAJOR FINDINGS<br />
Organic <strong>carbon</strong> <strong>in</strong> <strong>the</strong> dissolved <strong>for</strong>m (DOC) is <strong>the</strong> <strong>for</strong>m considered to be more likely<br />
to react dur<strong>in</strong>g chlor<strong>in</strong>ation <strong>and</strong> <strong>for</strong>m dis<strong>in</strong>fectant byproduct compounds. DOC is<br />
generally less bioavailable to <strong>the</strong> base of <strong>the</strong> web compared with particulate <strong>organic</strong><br />
<strong>carbon</strong> <strong>and</strong>/or <strong>organic</strong> <strong>carbon</strong> freshly derived from primary production. Thus, ef<strong>for</strong>ts<br />
<strong>in</strong> <strong>the</strong> Central Valley <strong>and</strong> Delta to control or manage DOC levels <strong>for</strong> dr<strong>in</strong>k<strong>in</strong>g water<br />
quality may not have direct adverse effects on <strong>the</strong> food web, although this is a subject<br />
that needs to be studied fur<strong>the</strong>r. There is general agreement <strong>in</strong> <strong>the</strong> literature that THM<br />
<strong>for</strong>mation is correlated to TOC concentrations, although <strong>the</strong> relationship is more<br />
complex when a specific structural characteristics of DOC is compared with THM<br />
<strong>for</strong>mation potential. A commonly used measure of DOC aromaticity, SUVA at 254<br />
nm, was found to be poorly correlated to THM <strong>for</strong>mation <strong>in</strong> Delta waters.<br />
Characterization of <strong>organic</strong> matter through sophisticated analytical tools such as<br />
stable isotope signatures is an active area of research; published <strong>in</strong><strong>for</strong>mation that was<br />
available at this time, however, is limited to a small number of locations near <strong>the</strong><br />
Delta, <strong>and</strong> with limited temporal resolution. The data are <strong>in</strong>dicative of a contribution<br />
April 14, 2006 6-1
Chapter 6.0<br />
Conceptual Model <strong>for</strong> Organic Carbon <strong>in</strong> <strong>the</strong> Central Valley<br />
due to <strong>in</strong>-Delta primary production, although <strong>the</strong> variability of this contribution as a<br />
function of time is not known. There is limited knowledge on <strong>the</strong> relative propensity<br />
of different sources to <strong>for</strong>m THMs, although it appears that Delta isl<strong>and</strong> dra<strong>in</strong>age, is<br />
somewhat less reactive than tributary sources.<br />
Flows <strong>in</strong> <strong>the</strong> Central Valley, albeit modulated by <strong>the</strong> existence of a large number of<br />
reservoirs, are none<strong>the</strong>less highly variable, especially <strong>in</strong> <strong>the</strong> w<strong>in</strong>ter months. In a<br />
pattern that is widely seen, at most stream sampl<strong>in</strong>g locations concentration data were<br />
obta<strong>in</strong>ed <strong>for</strong> a small number of dates, whereas <strong>the</strong> flow data were obta<strong>in</strong>ed daily. In<br />
such a situation, loads are estimated us<strong>in</strong>g a relationship between flow <strong>and</strong><br />
concentration to <strong>in</strong>terpolate <strong>for</strong> <strong>the</strong> dates on which no concentration data are<br />
available. Flows <strong>and</strong> <strong>organic</strong> <strong>carbon</strong> concentrations are weakly correlated, if at all.<br />
Best fit regression l<strong>in</strong>es between log of concentration <strong>and</strong> log of flow were used to<br />
estimate flows. When <strong>the</strong> data are poorly correlated <strong>and</strong> <strong>the</strong>se l<strong>in</strong>es effectively have<br />
zero slope, <strong>the</strong>y essentially reflect <strong>the</strong> mean of concentration observations. At a<br />
station where daily flow <strong>and</strong> concentration data were available, <strong>the</strong> load calculation<br />
approach presented here was found to estimate loads reasonably well.<br />
Loads of <strong>organic</strong> <strong>carbon</strong> delivered by <strong>the</strong> tributaries are substantially greater <strong>in</strong> <strong>the</strong><br />
w<strong>in</strong>ter months. Tributary loads were found to vary significantly between wet <strong>and</strong> dry<br />
years, with loads from <strong>the</strong> Sacramento River Bas<strong>in</strong> exceed<strong>in</strong>g <strong>the</strong> San Joaqu<strong>in</strong> River<br />
loads by a factor of two. There are few sources of data <strong>for</strong> <strong>in</strong>-Delta contribution of<br />
<strong>organic</strong> <strong>carbon</strong>, <strong>and</strong> <strong>the</strong>se sources are more approximate than <strong>the</strong> tributary loads.<br />
Current estimates show that annual loads of <strong>organic</strong> <strong>carbon</strong> from <strong>the</strong> tributaries are<br />
substantially greater than <strong>the</strong> best estimates of <strong>in</strong>-Delta production. However, <strong>in</strong> dry<br />
years <strong>the</strong>se may be a significant fraction of <strong>the</strong> total loads. The <strong>organic</strong> <strong>carbon</strong> export<br />
<strong>in</strong> aqueducts is relatively uni<strong>for</strong>m from year to year, particularly when compared with<br />
<strong>the</strong> tributary loads. In dry years, <strong>the</strong> export of <strong>organic</strong> <strong>carbon</strong> <strong>in</strong> aqueduct is nearly as<br />
large as <strong>the</strong> average <strong>in</strong>ternal Delta production.<br />
The loads transported <strong>in</strong> streams were compared to <strong>the</strong> <strong>organic</strong> <strong>carbon</strong> export rates<br />
from different l<strong>and</strong> uses. A small number of stations <strong>in</strong> <strong>the</strong> exist<strong>in</strong>g database could be<br />
used <strong>for</strong> <strong>the</strong> purpose of characteriz<strong>in</strong>g export from a particular l<strong>and</strong> use; however,<br />
very few of <strong>the</strong> stations were sited specifically <strong>for</strong> this purpose, <strong>the</strong> export rates may<br />
be confounded by more than one l<strong>and</strong> use. Export rates of <strong>organic</strong> <strong>carbon</strong> (mass of<br />
<strong>carbon</strong> exported per unit area per year) were computed key l<strong>and</strong> uses: urban l<strong>and</strong>,<br />
agricultural l<strong>and</strong>, wetl<strong>and</strong>s, <strong>and</strong> natural areas (<strong>in</strong>clud<strong>in</strong>g <strong>for</strong>ests, shrubl<strong>and</strong>, <strong>and</strong><br />
rangel<strong>and</strong>). The calculated total watershed exports matched well with <strong>the</strong> stream<br />
loads at key locations (such as Sacramento River at Freeport <strong>and</strong> San Joaqu<strong>in</strong> River at<br />
Vernalis) although not at all locations considered. Export rates, as currently<br />
approximated, could be improved through focused flow <strong>and</strong> concentration data<br />
collection <strong>in</strong> small, relatively homogenous watersheds.<br />
The contribution of various sources to <strong>organic</strong> <strong>carbon</strong> concentrations at <strong>the</strong> <strong>in</strong>takes is<br />
best estimated through <strong>model</strong><strong>in</strong>g. Cali<strong>for</strong>nia Department of Water Resources’ DSM2<br />
<strong>model</strong> was found to be <strong>the</strong> best tool <strong>for</strong> this task. This <strong>model</strong> is well calibrated <strong>and</strong><br />
6-2 April 14, 2006
Conceptual Model <strong>for</strong> Organic Carbon <strong>in</strong> <strong>the</strong> Central Valley Chapter 6.0<br />
widely used <strong>for</strong> water flow <strong>and</strong> water quality applications throughout <strong>the</strong> Delta. The<br />
<strong>model</strong> is rout<strong>in</strong>ely used by DWR staff to evaluate <strong>the</strong> effect of specific scenarios on<br />
concentrations at various <strong>in</strong>takes. A similar mechanistic <strong>model</strong> of <strong>the</strong> tributaries may<br />
need to be developed if impacts at stations outside <strong>the</strong> Delta need to be studied.<br />
6.2 UNCERTAINTIES IN EXISTING DATA AND RECOMMENDATIONS FOR FUTURE<br />
WORK<br />
This section focuses on <strong>the</strong> uncerta<strong>in</strong>ties associated with <strong>the</strong> quantitative <strong>in</strong><strong>for</strong>mation<br />
presented <strong>in</strong> preced<strong>in</strong>g chapters, <strong>and</strong> identifies key data gaps that should be addressed<br />
<strong>in</strong> future work, primarily through targeted monitor<strong>in</strong>g <strong>and</strong> detailed mechanistic<br />
<strong>model</strong><strong>in</strong>g. A summary of <strong>the</strong> uncerta<strong>in</strong>ty associated with quantitative <strong>in</strong><strong>for</strong>mation<br />
presented <strong>in</strong> Chapters 2, 4, <strong>and</strong> 5 is shown <strong>in</strong> Table 6-1. The uncerta<strong>in</strong>ty associated<br />
with <strong>the</strong> sources <strong>and</strong> <strong>the</strong> importance of obta<strong>in</strong><strong>in</strong>g more data to decrease uncerta<strong>in</strong>ty<br />
are discussed <strong>in</strong> this section. Recommendations are made <strong>for</strong> additional data<br />
collection, analysis of exist<strong>in</strong>g data, <strong>and</strong> <strong>model</strong><strong>in</strong>g studies.<br />
6.2.1 ORGANIC CARBON CHEMISTRY AND DISINFECTION BYPRODUCT FORMATION<br />
Uncerta<strong>in</strong>ty <strong>and</strong> Importance<br />
The chemistry of <strong>organic</strong> <strong>carbon</strong>, <strong>and</strong> particularly <strong>the</strong> propensity of <strong>organic</strong> <strong>carbon</strong><br />
from different sources to <strong>for</strong>m THMs <strong>and</strong> o<strong>the</strong>r dis<strong>in</strong>fection byproducts, cont<strong>in</strong>ues to<br />
be <strong>in</strong>vestigated actively. However, because of <strong>the</strong> dynamics <strong>in</strong> <strong>the</strong> system (<strong>in</strong> <strong>the</strong><br />
flows <strong>and</strong> production of <strong>organic</strong> <strong>carbon</strong>), available data are <strong>in</strong>sufficient to draw<br />
conclusions about <strong>the</strong> quality or <strong>the</strong> THMFP of <strong>organic</strong> <strong>carbon</strong> from different<br />
sources. The data are especially lack<strong>in</strong>g <strong>in</strong> much of <strong>the</strong> watershed upstream of <strong>the</strong><br />
Delta. There is significant uncerta<strong>in</strong>ty associated with this <strong>in</strong><strong>for</strong>mation even though it<br />
is important <strong>for</strong> assess<strong>in</strong>g dr<strong>in</strong>k<strong>in</strong>g water impacts. A better underst<strong>and</strong><strong>in</strong>g of <strong>the</strong><br />
potential <strong>for</strong> dis<strong>in</strong>fection byproduct <strong>for</strong>mation of different sources of <strong>organic</strong> <strong>carbon</strong><br />
could lead to more <strong>in</strong><strong>for</strong>med decisions on how to best manage <strong>organic</strong> <strong>carbon</strong> <strong>in</strong> <strong>the</strong><br />
system. For <strong>the</strong> immediate future, total <strong>organic</strong> <strong>carbon</strong> will be <strong>the</strong> primary focus of<br />
<strong>the</strong> Central Valley Dr<strong>in</strong>k<strong>in</strong>g Water Policy Workgroup because dr<strong>in</strong>k<strong>in</strong>g water<br />
suppliers are regulated on <strong>the</strong> concentrations of total <strong>organic</strong> <strong>carbon</strong> <strong>in</strong> <strong>the</strong> source<br />
water, <strong>and</strong> <strong>the</strong> research to characterize <strong>the</strong> quality of <strong>carbon</strong> from <strong>the</strong> various sources<br />
<strong>in</strong> <strong>the</strong> Central Valley will be costly <strong>and</strong> time consum<strong>in</strong>g.<br />
April 14, 2006 6-3
Chapter 6.0<br />
Conceptual Model <strong>for</strong> Organic Carbon <strong>in</strong> <strong>the</strong> Central Valley<br />
Table 6-1.<br />
Relative levels of uncerta<strong>in</strong>ty <strong>and</strong> importance of <strong>organic</strong> <strong>carbon</strong> sources identified <strong>in</strong> <strong>the</strong> Conceptual<br />
Model.<br />
Source Level of Uncerta<strong>in</strong>ty Importance<br />
Tributary Loads<br />
Sacramento Bas<strong>in</strong><br />
Sacramento R. at Bend Bridge High Medium<br />
Butte Cr. High Low<br />
Sacramento R. at Colusa High Medium<br />
Yuba R. High Medium<br />
Bear R. Medium Low<br />
Fea<strong>the</strong>r R. High Medium<br />
American R. Medium Medium<br />
Sacramento R. at Hood/Greene’s L<strong>and</strong><strong>in</strong>g Low High<br />
Cache Cr. High Low<br />
Putah Cr. High Low<br />
San Joaqu<strong>in</strong> Bas<strong>in</strong><br />
San Joaqu<strong>in</strong> R. at Sack Dam High Low<br />
Chowchilla R. High Low<br />
Bear Cr. High Low<br />
Merced R. High Medium<br />
San Joaqu<strong>in</strong> R. at Newman Medium Medium<br />
Tuolumne R. Medium Medium<br />
Stanislaus R. Medium Medium<br />
San Joaqu<strong>in</strong> R. at Vernalis Low High<br />
Delta<br />
Cosumnes R. Medium Low<br />
Mokelumne R. Medium Low<br />
Delta North High Medium<br />
Delta South High Medium<br />
In-Delta Sources<br />
Delta Isl<strong>and</strong> Agricultural Dra<strong>in</strong>age High High<br />
Export Rates<br />
Agricultural L<strong>and</strong> High High<br />
Urban Runoff Low High<br />
Background Areas High High<br />
Wetl<strong>and</strong>s High High<br />
O<strong>the</strong>r<br />
Po<strong>in</strong>t Source Discharges Medium High<br />
Reservoirs High Medium<br />
Recommendations<br />
The Workgroup should stay apprised of research that is be<strong>in</strong>g conducted by USGS<br />
<strong>and</strong> MWQI on <strong>carbon</strong> quality.<br />
6-4 April 14, 2006
Conceptual Model <strong>for</strong> Organic Carbon <strong>in</strong> <strong>the</strong> Central Valley Chapter 6.0<br />
6.2.2 TRIBUTARY LOADS<br />
Uncerta<strong>in</strong>ty <strong>and</strong> Importance<br />
The number of water quality samples <strong>and</strong> <strong>the</strong> length of <strong>the</strong> flow data record were used<br />
to assign <strong>the</strong> rank<strong>in</strong>gs of low, medium, <strong>and</strong> high uncerta<strong>in</strong>ty associated with each of<br />
<strong>the</strong> subwatersheds listed <strong>in</strong> Table 6-1. The loads <strong>in</strong> <strong>the</strong> Sacramento River at<br />
Hood/Greenes L<strong>and</strong><strong>in</strong>g <strong>and</strong> <strong>the</strong> San Joaqu<strong>in</strong> River at Vernalis are well characterized<br />
due to many years of data collection <strong>and</strong> more recent real time monitor<strong>in</strong>g. In general,<br />
<strong>the</strong> loads of <strong>organic</strong> <strong>carbon</strong> <strong>in</strong> <strong>the</strong> o<strong>the</strong>r subwatersheds that discharge to <strong>the</strong><br />
Sacramento <strong>and</strong> San Joaqu<strong>in</strong> rivers are not adequately characterized. Currently, <strong>the</strong><br />
DWR <strong>model</strong>ers treat <strong>the</strong> Sacramento River at Hood/Greenes L<strong>and</strong><strong>in</strong>g <strong>and</strong> <strong>the</strong> San<br />
Joaqu<strong>in</strong> River at Vernalis as boundary conditions to <strong>the</strong> Delta <strong>model</strong>. Although <strong>the</strong><br />
<strong>model</strong>s are able to predict how much of <strong>the</strong> load at a Delta pump<strong>in</strong>g plant is due to<br />
each of <strong>the</strong> rivers, <strong>the</strong> <strong>model</strong>s do not predict <strong>the</strong> sources of <strong>organic</strong> <strong>carbon</strong> with<strong>in</strong> <strong>the</strong><br />
Sacramento <strong>and</strong> San Joaqu<strong>in</strong> watersheds. Additional data collection <strong>in</strong> <strong>the</strong> upper<br />
watersheds will allow <strong>the</strong> <strong>model</strong>s to be extended upstream of <strong>the</strong> current boundary<br />
conditions.<br />
Recommendations<br />
The real time data collected <strong>in</strong> <strong>the</strong> Sacramento River at Hood, <strong>the</strong> San Joaqu<strong>in</strong> River<br />
at Vernalis, <strong>and</strong> <strong>the</strong> Banks Pump<strong>in</strong>g Plant should be reviewed to better def<strong>in</strong>e <strong>the</strong><br />
relationships between concentration <strong>and</strong> watershed processes such as precipitation<br />
<strong>and</strong> reservoir releases. A more detailed review of <strong>the</strong>se data can provide guidance on<br />
<strong>the</strong> importance of monitor<strong>in</strong>g dur<strong>in</strong>g certa<strong>in</strong> times of <strong>the</strong> year, dur<strong>in</strong>g specific events<br />
(such as storms), <strong>and</strong> on <strong>the</strong> frequency of monitor<strong>in</strong>g needed to fully characterize<br />
<strong>organic</strong> <strong>carbon</strong> at an <strong>in</strong>dividual site. In addition, <strong>the</strong>re are substantial data that were<br />
not used <strong>in</strong> this study because <strong>the</strong> concentration data were collected at locations <strong>for</strong><br />
which <strong>the</strong>re are no flow data or because <strong>the</strong> database did not conta<strong>in</strong> latitude <strong>and</strong><br />
longitude <strong>in</strong><strong>for</strong>mation. The Workgroup should review all of <strong>the</strong> data that have been<br />
collected <strong>for</strong> each of <strong>the</strong> subwatersheds <strong>and</strong> determ<strong>in</strong>e <strong>the</strong> key locations that require<br />
additional monitor<strong>in</strong>g. The <strong>in</strong><strong>for</strong>mation ga<strong>in</strong>ed from <strong>the</strong> review of <strong>the</strong> real time data<br />
should be used to determ<strong>in</strong>e <strong>the</strong> tim<strong>in</strong>g <strong>and</strong> frequency of monitor<strong>in</strong>g.<br />
6.2.3 IN-DELTA SOURCES<br />
Delta Agricultural Dra<strong>in</strong>age<br />
Uncerta<strong>in</strong>ty <strong>and</strong> Importance<br />
There are extensive data on <strong>organic</strong> <strong>carbon</strong> concentrations <strong>in</strong> Delta isl<strong>and</strong> agricultural<br />
dra<strong>in</strong>age; however dra<strong>in</strong>age volumes are currently estimated with <strong>the</strong> DICU <strong>model</strong>.<br />
F<strong>in</strong>gerpr<strong>in</strong>t<strong>in</strong>g studies have shown that Delta agricultural dra<strong>in</strong>age contributes a<br />
substantial amount of <strong>organic</strong> <strong>carbon</strong> to <strong>the</strong> Banks Pump<strong>in</strong>g Plant under some<br />
April 14, 2006 6-5
Chapter 6.0<br />
Conceptual Model <strong>for</strong> Organic Carbon <strong>in</strong> <strong>the</strong> Central Valley<br />
conditions. It is important to have an accurate estimate of <strong>the</strong> dra<strong>in</strong>age volumes<br />
be<strong>for</strong>e management options can be considered.<br />
Recommendations<br />
USGS is currently monitor<strong>in</strong>g dra<strong>in</strong>age volumes on Twitchell Isl<strong>and</strong> <strong>and</strong> MWQI is<br />
conduct<strong>in</strong>g a study of dra<strong>in</strong>age volumes on Staten Isl<strong>and</strong>. These measured dra<strong>in</strong>age<br />
volumes should be compared to estimates from <strong>the</strong> DICU <strong>model</strong> to assess how<br />
accurately <strong>the</strong> <strong>model</strong> predicts dra<strong>in</strong>age volumes. Then decisions can be made on <strong>the</strong><br />
importance of obta<strong>in</strong><strong>in</strong>g additional dra<strong>in</strong>age volume data.<br />
Delta Primary Production<br />
Uncerta<strong>in</strong>ty <strong>and</strong> Importance<br />
In-Delta primary productivity estimates are based on one study whose results were<br />
extrapolated both spatially <strong>and</strong> temporally to calculate <strong>organic</strong> <strong>carbon</strong> loads from this<br />
source.<br />
Recommendations<br />
The Workgroup should track <strong>the</strong> <strong>in</strong>vestigations be<strong>in</strong>g conducted on <strong>the</strong> Pelagic<br />
Organism Decl<strong>in</strong>e (POD) <strong>and</strong> request that additional work be conducted on Delta<br />
primary productivity, if it is not <strong>in</strong>cluded <strong>in</strong> <strong>the</strong> POD work plan.<br />
Tidal Marshes<br />
Uncerta<strong>in</strong>ty <strong>and</strong> Importance<br />
Tidal marshes, although a small area compared to <strong>the</strong> watershed of <strong>the</strong> Sacramento<br />
<strong>and</strong> San Joaqu<strong>in</strong> rivers, have <strong>the</strong> largest export rate of any l<strong>and</strong> use evaluated <strong>in</strong><br />
Chapters 4 <strong>and</strong> 5 (150 tons of <strong>carbon</strong>/km 2 /year). This export rate was based on a<br />
literature review because studies on Delta tidal marshes have not been completed.<br />
Because of <strong>the</strong> potential magnitude of this source, its proximity to Delta <strong>in</strong>takes, <strong>and</strong><br />
<strong>the</strong> likelihood that <strong>the</strong>se areas will grow <strong>in</strong> future years because of planned restoration<br />
ef<strong>for</strong>ts, <strong>the</strong> importance of this source should be evaluated.<br />
Recommendations<br />
The USGS study results on Twitchell Isl<strong>and</strong> should be reviewed when <strong>the</strong> study is<br />
completed to determ<strong>in</strong>e if Delta research confirms <strong>the</strong> f<strong>in</strong>d<strong>in</strong>gs <strong>in</strong> <strong>the</strong> literature. In<br />
addition, f<strong>in</strong>gerpr<strong>in</strong>t<strong>in</strong>g analyses should be conducted to determ<strong>in</strong>e <strong>the</strong> sensitivity of<br />
<strong>organic</strong> <strong>carbon</strong> concentrations at <strong>the</strong> major Delta pump<strong>in</strong>g plants to vary<strong>in</strong>g estimates<br />
of tidal marsh export rates <strong>and</strong> acreage. This <strong>in</strong><strong>for</strong>mation can <strong>the</strong>n be used to<br />
determ<strong>in</strong>e if additional research is needed on Delta tidal marshes.<br />
6-6 April 14, 2006
Conceptual Model <strong>for</strong> Organic Carbon <strong>in</strong> <strong>the</strong> Central Valley Chapter 6.0<br />
6.2.4 EXPORT RATES<br />
There is an extensive amount of <strong>organic</strong> <strong>carbon</strong> concentration data collected <strong>in</strong> <strong>the</strong><br />
major streams <strong>in</strong> <strong>the</strong> Central Valley. These data can be used to compute export rates<br />
from mixed l<strong>and</strong> uses. However, <strong>for</strong> dist<strong>in</strong>guish<strong>in</strong>g sources, it is important to estimate<br />
<strong>the</strong> contribution of specific l<strong>and</strong> uses. To meet this objective, focus should be placed<br />
on study<strong>in</strong>g small <strong>in</strong>dicator watersheds or specific sources.<br />
Reservoirs<br />
Uncerta<strong>in</strong>ty <strong>and</strong> Importance<br />
There are reservoirs on most of <strong>the</strong> rivers <strong>in</strong> <strong>the</strong> Central Valley watershed but <strong>the</strong>re<br />
are currently limited data on <strong>the</strong> concentrations of <strong>organic</strong> <strong>carbon</strong> released from <strong>the</strong><br />
reservoirs. Based on <strong>the</strong> data that are available <strong>in</strong> <strong>the</strong> Sacramento Bas<strong>in</strong>, <strong>the</strong><br />
watersheds upstream of <strong>the</strong> reservoirs contribute substantial volumes of water that<br />
conta<strong>in</strong>s low concentrations of <strong>organic</strong> <strong>carbon</strong> (1-2 mg/L).<br />
Recommendations<br />
The Workgroup should ga<strong>the</strong>r any additional data that are available on reservoir<br />
releases, particularly <strong>in</strong> <strong>the</strong> San Joaqu<strong>in</strong> watershed. If sufficient data are not available<br />
to confirm that <strong>organic</strong> <strong>carbon</strong> concentrations are low <strong>in</strong> reservoir releases, additional<br />
data should be collected on <strong>the</strong> major rivers immediately downstream from reservoirs<br />
<strong>in</strong> <strong>the</strong> San Joaqu<strong>in</strong> Bas<strong>in</strong>.<br />
Agricultural L<strong>and</strong><br />
Uncerta<strong>in</strong>ty <strong>and</strong> Importance<br />
Over 5,460,000 acres (20%) of <strong>the</strong> Central Valley watershed is used <strong>for</strong> agricultural<br />
production. There are currently limited data on <strong>the</strong> loads of <strong>organic</strong> <strong>carbon</strong> discharged<br />
from agricultural l<strong>and</strong> <strong>in</strong> <strong>the</strong> tributary watersheds. The data from <strong>the</strong> Colusa Bas<strong>in</strong><br />
Dra<strong>in</strong> <strong>in</strong> <strong>the</strong> Sacramento Bas<strong>in</strong> is representative of loads from rice fields. In<strong>for</strong>mation<br />
is needed on o<strong>the</strong>r types of agricultural <strong>in</strong> <strong>the</strong> Sacramento Bas<strong>in</strong>, such as orchards <strong>and</strong><br />
row crops. Due to different sources of water <strong>and</strong> different methods <strong>for</strong> management<br />
of dra<strong>in</strong>age <strong>in</strong> <strong>the</strong> San Joaqu<strong>in</strong> Bas<strong>in</strong>, <strong>the</strong> loads of <strong>organic</strong> <strong>carbon</strong> from agricultural<br />
operations on <strong>the</strong> west side of <strong>the</strong> San Joaqu<strong>in</strong> Bas<strong>in</strong> may differ from those on <strong>the</strong><br />
east side of <strong>the</strong> Bas<strong>in</strong>.<br />
Recommendations<br />
The Workgroup should obta<strong>in</strong> data collected by <strong>the</strong> agricultural waiver monitor<strong>in</strong>g<br />
programs <strong>and</strong> from <strong>the</strong> Regional Board agricultural monitor<strong>in</strong>g to determ<strong>in</strong>e if<br />
<strong>organic</strong> <strong>carbon</strong> loads from agricultural l<strong>and</strong>s can be adequately estimated or if more<br />
focused monitor<strong>in</strong>g is needed. In addition, USGS recently started a project to estimate<br />
April 14, 2006 6-7
Chapter 6.0<br />
Conceptual Model <strong>for</strong> Organic Carbon <strong>in</strong> <strong>the</strong> Central Valley<br />
contam<strong>in</strong>ant loads from a small agricultural watershed, Willow Slough. This study<br />
should be tracked, <strong>and</strong>, when <strong>the</strong> results are available, <strong>the</strong>y should be used to ref<strong>in</strong>e<br />
<strong>the</strong> estimate of agricultural loads.<br />
Wetl<strong>and</strong>s<br />
Uncerta<strong>in</strong>ty <strong>and</strong> Importance<br />
Data from Mud <strong>and</strong> Salt Sloughs were used <strong>for</strong> estimat<strong>in</strong>g <strong>the</strong> wetl<strong>and</strong> export rate <strong>for</strong><br />
both <strong>the</strong> Sacramento <strong>and</strong> San Joaqu<strong>in</strong> watersheds because no o<strong>the</strong>r wetl<strong>and</strong> data were<br />
available. Wetl<strong>and</strong>s only represent 234,000 acres (less than one percent) of <strong>the</strong><br />
Central Valley watershed.<br />
Recommendations<br />
Due to <strong>the</strong> limited extent of wetl<strong>and</strong>s <strong>in</strong> <strong>the</strong> watershed no additional data collection is<br />
recommended at this time.<br />
6.2.5 WASTEWATER TREATMENT PLANTS<br />
Uncerta<strong>in</strong>ty <strong>and</strong> Importance<br />
Organic <strong>carbon</strong> <strong>and</strong> flow data were available <strong>for</strong> three wastewater treatment plants<br />
(Sacramento Regional Wastewater Treatment Plant, Davis <strong>and</strong> Vacaville <strong>for</strong> this<br />
study. There was considerable variability <strong>in</strong> <strong>the</strong> concentrations of <strong>organic</strong> <strong>carbon</strong> <strong>in</strong><br />
wastewater effluent from <strong>the</strong>se three plants. Due to <strong>the</strong> volume of wastewater<br />
discharged <strong>in</strong> <strong>the</strong> Central Valley <strong>and</strong> <strong>the</strong> fact that population growth will lead to even<br />
greater volumes <strong>in</strong> <strong>the</strong> future, this source needs to be better characterized.<br />
Recommendations<br />
Organic <strong>carbon</strong> data should be collected from a number of wastewater treatment<br />
plants represent<strong>in</strong>g different treatment processes. These data can be analyzed to<br />
determ<strong>in</strong>e if <strong>organic</strong> <strong>carbon</strong> loads are related to treatment processes <strong>and</strong> to improve<br />
<strong>the</strong> estimates of <strong>organic</strong> <strong>carbon</strong> loads from wastewater treatment plants. Regional<br />
Board staff is review<strong>in</strong>g permit files to determ<strong>in</strong>e if additional data are available on<br />
<strong>organic</strong> <strong>carbon</strong> concentrations from wastewater treatment plants. The Workgroup<br />
should review <strong>the</strong> additional data <strong>and</strong> determ<strong>in</strong>e if any additional monitor<strong>in</strong>g is<br />
needed.<br />
6-8 April 14, 2006
Conceptual Model <strong>for</strong> Organic Carbon <strong>in</strong> <strong>the</strong> Central Valley Chapter 6.0<br />
6.2.6 FISH HATCHERIES<br />
Uncerta<strong>in</strong>ty <strong>and</strong> Importance<br />
Fish hatcheries are permitted to discharge up to 352 MGD (average dry wea<strong>the</strong>r flow<br />
of 256 MGD) <strong>in</strong>to Central Valley waters <strong>and</strong> <strong>the</strong>re are currently no data on <strong>organic</strong><br />
<strong>carbon</strong> concentrations <strong>in</strong> fish hatchery waste. The importance of this source is<br />
currently unknown <strong>and</strong> should be <strong>in</strong>vestigated.<br />
Recommendations<br />
The Workgroup should collect <strong>organic</strong> <strong>carbon</strong> data from several fish hatcheries<br />
dur<strong>in</strong>g <strong>the</strong> next year or two. These data will be useful <strong>in</strong> determ<strong>in</strong><strong>in</strong>g if fish hatcheries<br />
are a source of <strong>organic</strong> <strong>carbon</strong> that should be <strong>in</strong>cluded <strong>in</strong> ref<strong>in</strong>ed <strong>conceptual</strong> <strong>model</strong>s.<br />
6.2.7 URBAN RUNOFF<br />
Uncerta<strong>in</strong>ty <strong>and</strong> Importance<br />
The export rate <strong>for</strong> urban runoff was estimated from a three year study of a s<strong>in</strong>gle<br />
developed watershed, Arcade Creek. Additional data on urban runoff loads are<br />
needed to ref<strong>in</strong>e <strong>the</strong> load estimates presented <strong>in</strong> this report.<br />
Recommendations<br />
MWQI is complet<strong>in</strong>g a seven year study on <strong>organic</strong> <strong>carbon</strong> loads from a rapidly<br />
urbaniz<strong>in</strong>g watershed <strong>in</strong> Sacramento <strong>and</strong> Placer counties. The Workgroup should<br />
review <strong>the</strong> MWQI study results <strong>and</strong> compare <strong>the</strong> export rate with <strong>the</strong> one calculated<br />
from Arcade Creek. In addition, <strong>the</strong> Workgroup should work with <strong>the</strong> City <strong>and</strong><br />
County of Sacramento <strong>and</strong> <strong>the</strong> City of Stockton to determ<strong>in</strong>e if loads can be<br />
calculated from <strong>the</strong> data collected as part of <strong>the</strong>ir NPDES storm water permit<br />
programs.<br />
6.3 FUTURE CONCERNS<br />
From a review of <strong>the</strong> temporal variability of <strong>the</strong> loads, where available, it is clear that<br />
<strong>the</strong> year-to-year variations are so large that, on average, gradual changes <strong>in</strong> typical<br />
sources, such as <strong>in</strong>creas<strong>in</strong>g population or gradual <strong>in</strong>crease <strong>in</strong> area of urban l<strong>and</strong>, are<br />
unlikely to be discernible. In o<strong>the</strong>r words, over a two-decade time frame, given<br />
similar hydrology, <strong>the</strong> variability of loads is unlikely to be much different than what it<br />
is has been <strong>in</strong> <strong>the</strong> recent past. There are four areas of additional concern, however.<br />
The first perta<strong>in</strong>s to dry <strong>and</strong> critically dry years. In <strong>the</strong>se years, <strong>the</strong> relative<br />
contribution of <strong>organic</strong> <strong>carbon</strong> from anthropogenic sources is much larger, <strong>and</strong> <strong>the</strong><br />
volumes of water withdrawals are a large fraction of total tributary <strong>in</strong>flows. Under<br />
<strong>the</strong>se conditions, <strong>the</strong>re is a stronger likelihood <strong>in</strong> future years of excessive DOC<br />
April 14, 2006 6-9
Chapter 6.0<br />
Conceptual Model <strong>for</strong> Organic Carbon <strong>in</strong> <strong>the</strong> Central Valley<br />
concentrations <strong>in</strong> source waters, <strong>and</strong> a stronger possibility of adverse ecological<br />
impacts to <strong>the</strong> Delta due to large withdrawals. The second concern perta<strong>in</strong>s to <strong>the</strong><br />
occurrence of catastrophic events such as levee failure. As <strong>the</strong> data have shown,<br />
<strong>organic</strong> <strong>carbon</strong> concentrations <strong>in</strong> <strong>the</strong> Delta agricultural dra<strong>in</strong>s are far <strong>in</strong> excess of any<br />
o<strong>the</strong>r concentrations measured <strong>in</strong> <strong>the</strong> system. Levee failure has <strong>the</strong> potential to<br />
effectively raise Delta-wide <strong>organic</strong> <strong>carbon</strong> concentrations substantially, with<br />
significant impacts on water suppliers. The third concern relates to <strong>the</strong> <strong>in</strong>crease <strong>in</strong><br />
area of tidal wetl<strong>and</strong>s as part of Delta-wide restoration. Based on current knowledge,<br />
<strong>the</strong> contribution of <strong>organic</strong> <strong>carbon</strong> from this source, on a unit area basis, far exceeds<br />
any o<strong>the</strong>r non-po<strong>in</strong>t source. Because of <strong>the</strong> proximity of <strong>the</strong>se wetl<strong>and</strong>s to dr<strong>in</strong>k<strong>in</strong>g<br />
water <strong>in</strong>takes, <strong>the</strong> potential significance of an <strong>in</strong>crease <strong>in</strong> <strong>the</strong>ir area on dr<strong>in</strong>k<strong>in</strong>g water<br />
quality must be closely <strong>in</strong>vestigated. The f<strong>in</strong>al concerns relate to <strong>the</strong> chang<strong>in</strong>g<br />
regulatory l<strong>and</strong>scape. If <strong>the</strong> allowable THM <strong>and</strong> HAA5 limits <strong>in</strong> dr<strong>in</strong>k<strong>in</strong>g water<br />
supply are lowered, or if additional compounds are added to <strong>the</strong> list of regulated<br />
chemicals, water suppliers may well face significant challenges <strong>in</strong> meet<strong>in</strong>g such<br />
st<strong>and</strong>ards.<br />
6-10 April 14, 2006
REFERENCES<br />
Aitkenhead, J.A., <strong>and</strong> W. H. McDowell. 2000. Soil C:N ratio as a predictor of<br />
annual river<strong>in</strong>e DOC flux at local <strong>and</strong> regional scales. Global Biogechmical Cycles,<br />
Vol. 14, pp. 127-138.<br />
Amy, G.L., J.M. Thompson, L. Tan, M.K. Davis, <strong>and</strong> S.W. Krasner. 1990. Evaluation<br />
of THM precursor contributions from agricultural dra<strong>in</strong>s. Journal of <strong>the</strong> American<br />
Water Works Association 80:57-64.<br />
Bergamaschi, B.A., M.S. Fram, R. Fujii, G. R. Aiken, C. Kendall, <strong>and</strong> S. R. Silva<br />
(undated). The Carbon Isotopic Composition of Trihalomethanes Formed from<br />
Chemically Dist<strong>in</strong>ct Dissolved Organic Carbon Isolates from <strong>the</strong> Sacramento-San<br />
Joaqu<strong>in</strong> River Delta, Cali<strong>for</strong>nia, USA.<br />
Bergamaschi, B., M. Fram, C. Kendall, S. Silva, G. Aiken, <strong>and</strong> R. Fujii. 1999. Carbon<br />
isotopic constra<strong>in</strong>ts on <strong>the</strong> contribution of plant material to <strong>the</strong> natural precursors of<br />
trihalomethanes. Organic Geochemistry 30:835-842.<br />
Bergamaschi, B., M. Fram, R. Fujii, G. Aiken, C. Kendall, <strong>and</strong> S. Silva. 2000.<br />
Trihalomethanes <strong>for</strong>med from natural <strong>organic</strong> matter isolates: us<strong>in</strong>g isotopic <strong>and</strong><br />
compositional data to help underst<strong>and</strong> sources. Pages 206-222 <strong>in</strong> S. Barrett, S.<br />
Krasner, <strong>and</strong> G. Amy, editors. Natural <strong>organic</strong> matter <strong>and</strong> dis<strong>in</strong>fection byproducts,<br />
characteriztion <strong>and</strong> control <strong>in</strong> dr<strong>in</strong>k<strong>in</strong>g water. American Chemical Society,<br />
Wash<strong>in</strong>gton, DC.<br />
Boyer, EW, GM Hornberger, KE Bencala, <strong>and</strong> DM McKnight. 2000. Effects of<br />
asynchronous snowmelt on flush<strong>in</strong>g of dissolved <strong>organic</strong> <strong>carbon</strong>: a mix<strong>in</strong>g <strong>model</strong><br />
approach. Hydrological Processes 14:3291-3308.<br />
Brown, L. 2003. Potential effects of <strong>organic</strong> <strong>carbon</strong> production on ecosystems <strong>and</strong><br />
dr<strong>in</strong>k<strong>in</strong>g water quality. San Francisco Estuary <strong>and</strong> Watershed Science, Vol 1(1),<br />
Article 3.<br />
April 14, 2006 R-1
References<br />
Conceptual Model <strong>for</strong> Organic Carbon <strong>in</strong> <strong>the</strong> Central Valley<br />
CALFED Bay-Delta Program. 2000. Water quality program plan 2000 [cited July 16<br />
2000]. Available from<br />
http://calwater.ca.gov/Programs/Dr<strong>in</strong>k<strong>in</strong>gWater/Dr<strong>in</strong>k<strong>in</strong>gWaterQualityProgramPlan.s<br />
html.<br />
Cali<strong>for</strong>nia Department of Water Resources (DWR), Division of Local Assistance, <strong>and</strong><br />
Water Quality Assesment Branch. 1994. Five-year report of <strong>the</strong> municipal water<br />
quality <strong>in</strong>vestigations program, summary <strong>and</strong> f<strong>in</strong>d<strong>in</strong>gs dur<strong>in</strong>g five dry years, January<br />
1987 - December 1991.<br />
Chapra, S.C., R. P. Canale, G. L. Amy. 1997. Empirical <strong>model</strong>s <strong>for</strong> dis<strong>in</strong>fection<br />
byproducts <strong>in</strong> lakes <strong>and</strong> reservoirs, Journal of Environmental Eng<strong>in</strong>eer<strong>in</strong>g, ASCE,<br />
Vol. 123(7), pp. 714-715.<br />
Chow, A. T., <strong>and</strong> S. Gao. 2003. Isolation <strong>and</strong> characterization of <strong>organic</strong> dis<strong>in</strong>fection<br />
by-product precursors: current state of knowledge <strong>and</strong> studies <strong>in</strong> <strong>the</strong> Sacramento-San<br />
Joaqu<strong>in</strong> Delta, Cali<strong>for</strong>nia: Cali<strong>for</strong>nia Department of Water Resources (DWR).<br />
Chow, A. T., K.K. Tanji, <strong>and</strong> S. Gao. 2003. Production of dissolved <strong>organic</strong> <strong>carbon</strong><br />
(DOC) <strong>and</strong> trihalomethane (THM) precursor from peat soils. Water Research 37<br />
(18):4475-4485.<br />
Cohn, T.A., Caulder, D.L., Gilroy, E.J., Zynjuk, L.D. <strong>and</strong> Summers, R.M. 1992. The<br />
validity of a simple statistical <strong>model</strong> <strong>for</strong> estimat<strong>in</strong>g fluvial constituent loads—An<br />
empirical study <strong>in</strong>volv<strong>in</strong>g nutrient loads enter<strong>in</strong>g Chesapeake Bay: Water Resources<br />
Research, v. 28, no. 9, p. 2353–2363.<br />
Cohn, P. D., M. Cox, P.S. Berger. 1999. Health <strong>and</strong> aes<strong>the</strong>tic aspects of water<br />
quality, Chapter 2 <strong>in</strong> Water Quality <strong>and</strong> Treatment, A H<strong>and</strong>book of Community<br />
Water Supplies, Fifth edition, McGraw Hill, New York.<br />
Craw<strong>for</strong>d, C.G. 1991. Estimation of suspended-sediment rat<strong>in</strong>g curves <strong>and</strong> mean<br />
suspended-sediment loads: Journal of Hydrology, v. 129, p. 331–348.<br />
Deverel, S.J., <strong>and</strong> S. Rojstaczer. 1996. Subsidence of agricultural l<strong>and</strong>s <strong>in</strong> <strong>the</strong><br />
Sacramento-San Joaqu<strong>in</strong> Delta, Cali<strong>for</strong>nia: role of aqueous <strong>and</strong> gaseous <strong>carbon</strong><br />
fluxes. Water Resources Research 32 (8):2359-2367.<br />
DiGiorgio, C. 2003. Modeled impacts of Delta peat isl<strong>and</strong> dra<strong>in</strong>age on <strong>organic</strong><br />
<strong>carbon</strong> levels at selected Delta municipal water <strong>in</strong>takes. Cali<strong>for</strong>nia Department of<br />
Water Resources (DWR).<br />
Fleck, J.A., D.A. Bossio, <strong>and</strong> R. Fujii. 2004. Dissolved <strong>organic</strong> <strong>carbon</strong> <strong>and</strong><br />
dis<strong>in</strong>fection by-product precursor release from managed peat soils. Journal of<br />
Environmental Quality 33 (2):465-475.<br />
R-2 April 14, 2006
Conceptual Model <strong>for</strong> Organic Carbon <strong>in</strong> <strong>the</strong> Central Valley<br />
References<br />
Fram, MS, R Fujii, JL Weishaar, B Bergamaschi, <strong>and</strong> GR Aiken. 1999. How DOC<br />
composition may expla<strong>in</strong> <strong>the</strong> poor correlation between specific trihalomethane<br />
<strong>for</strong>mation potential <strong>and</strong> specific UV absorbance. US Geological Society toxic<br />
substances hydrology program, vol. 2: contam<strong>in</strong>ation of hydrologic systems <strong>and</strong><br />
related ecosystems. Paper read at Technical Meet<strong>in</strong>g, May 8 to 12, 1999, at<br />
Charleston, South Carol<strong>in</strong>a.<br />
Fujii, R, JA Ranalli, GR Aiken, <strong>and</strong> B Bergamaschi. 1998. Dissolved Organic Carbon<br />
Concentrations <strong>and</strong> Compositions, <strong>and</strong> Trihalomethane Formation Potentials <strong>in</strong><br />
Waters from Agricultural Peat Soils, Sacramento-San Joaqu<strong>in</strong> Delta, Cali<strong>for</strong>nia:<br />
Implications <strong>for</strong> Dr<strong>in</strong>k<strong>in</strong>g-Water Quality. Sacramento, Cali<strong>for</strong>nia: US Geological<br />
Survey.<br />
Haggard, B.E., T.S. Soerens, W. R. Green, R. P. Richards. 2003. Us<strong>in</strong>g regression<br />
methods to estimate stream phosphorus loads at <strong>the</strong> Ill<strong>in</strong>ois River, Arkansas, Applied<br />
Eng<strong>in</strong>eer<strong>in</strong>g <strong>in</strong> Agriculture, Vol. 19(2): 187–194.<br />
Jassby, A. D., J. Cloern, <strong>and</strong> T. Powell. 1993. Organic <strong>carbon</strong> sources <strong>and</strong> s<strong>in</strong>ks <strong>in</strong><br />
San Francisco Bay: variability <strong>in</strong>duced by river flow. Mar<strong>in</strong>e Ecology Progress Series<br />
95:39-54.<br />
Jassby, Alan D., <strong>and</strong> James Cloern. 2000. Organic matter sources <strong>and</strong> rehabilitation<br />
of <strong>the</strong> Sacramento-San Joaqu<strong>in</strong> Delta (Cali<strong>for</strong>nia, USA). Aquatic Conservation:<br />
Mar<strong>in</strong>e <strong>and</strong> Freshwater Ecosystems 10:323-352.<br />
Jassby, Alan D., James Cloern, <strong>and</strong> Brian E. Cole. 2002. Annual primary production:<br />
patterns <strong>and</strong> mechanisms of change <strong>in</strong> a nutrient-rich tidal ecosystem. Limnology <strong>and</strong><br />
Oceanography 47:698-712.<br />
Krasner, SW, JP Croue, J Buffle, <strong>and</strong> EM Perdue. 1996. Three approaches <strong>for</strong><br />
characterization NOM: American Water Works Association.<br />
Müeller-Solger, AB, Alan D Jassby, <strong>and</strong> Mueller-Navarra DC. 2002. Nutritional<br />
quality of food resources <strong>for</strong> zooplankton (Daphnia) <strong>in</strong> a tidal freshwater system<br />
(Sacramento-San Joaqu<strong>in</strong> River Delta). Limnology <strong>and</strong> Oceanography 47 (5):1468-<br />
1476.<br />
MWQI. 1998. Proposed Comprehensive Monitor<strong>in</strong>g, Assessment, <strong>and</strong> Research<br />
Program <strong>for</strong> Dr<strong>in</strong>k<strong>in</strong>g Water Quality, Task 3B; Element 2A - Water Quality, Delta<br />
Region; Sub-Element iii - Dr<strong>in</strong>k<strong>in</strong>g Water Quality<br />
MWQI. 2003. Municipal Water Quality Investigations Program Summary <strong>and</strong><br />
F<strong>in</strong>d<strong>in</strong>gs from Data Collected August 1998 through September 2001.<br />
MWQI. 2005. Municipal Water Quality Investigations Program Summary <strong>and</strong><br />
F<strong>in</strong>d<strong>in</strong>gs from Data Collected October 2001 through September 2003. June.<br />
April 14, 2006 R-3
References<br />
Conceptual Model <strong>for</strong> Organic Carbon <strong>in</strong> <strong>the</strong> Central Valley<br />
Natural Resources Conservation Service (NRCS). 2006. Cali<strong>for</strong>nia Precipitation<br />
Data/Maps, available from<br />
http://www.ncgc.nrcs.usda.gov/products/datasets/climate/data/precipitationstate/ca.html,<br />
accessed April, 2006.<br />
Reckhow, DA, <strong>and</strong> PC S<strong>in</strong>ger. 1990. Chlor<strong>in</strong>ation by-products <strong>in</strong> dr<strong>in</strong>k<strong>in</strong>g waters:<br />
from <strong>for</strong>mation potentials to f<strong>in</strong>ished water concentrations: American Water Works<br />
Association.<br />
Runkel, R.L., C. G. Craw<strong>for</strong>d, <strong>and</strong> T. A. Cohn. 2004. Load Estimator (LOADEST): A<br />
FORTRAN Program <strong>for</strong> Estimat<strong>in</strong>g Constituent Loads <strong>in</strong> Streams <strong>and</strong> Rivers, USGS<br />
Techniques <strong>and</strong> Methods Book 4, Chapter A5.<br />
Saleh, DK, JL Domagalski, CR Kratzer, <strong>and</strong> DL Knifong. 2003. Organic <strong>carbon</strong><br />
trends, loads, <strong>and</strong> yields to <strong>the</strong> Sacramento-San Joaqu<strong>in</strong> Delta Cali<strong>for</strong>nia, Water years<br />
1980-2000: US Geological Survey Water Resources Investigation Report 03-4070.<br />
Schemel, L.E., M.H. Cox, S.W. Hager, <strong>and</strong> T. R. Sommer. 2002. Hydrology <strong>and</strong><br />
chemistry of floodwaters <strong>in</strong> <strong>the</strong> Yolo Bypass, Sacramento River System, Cali<strong>for</strong>nia,<br />
dur<strong>in</strong>g 2000, USGS Water Resources Investigations Report 02-402.<br />
Sobczak, WV, James Cloern, Alan D Jassby, <strong>and</strong> AB Mueller-Solger. 2002.<br />
Bioavailability of <strong>organic</strong> matter <strong>in</strong> a highly disturbed estuary: <strong>the</strong> role of detrital <strong>and</strong><br />
algal resources. Proceed<strong>in</strong>gs of <strong>the</strong> National Academy of Sciences, Vol. 99<br />
(12):8101-8105.<br />
Sobczak, WV, James Cloern, Alan D Jassby, Brian E. Cole, TS Schraga, <strong>and</strong> A<br />
Arnsberh. 2004. Detritus fuels ecosystem metabolism but not metazoan food webs <strong>in</strong><br />
San Francisco Estuary's freshwater delta. Estuaries.<br />
Stepanauskas, R., M. A. Moran, B. Bergamaschi, <strong>and</strong> J. Hollibaugh. 2003.<br />
Covariance of bacterioplankton composition <strong>and</strong> environmental variables <strong>in</strong> a<br />
temperate delta system. Aquatic Microbial Ecology, Vol. 31, pp. 85-98.<br />
Thurman, E.M. 1985. Organic Geochemistry of Natural Waters, Mart<strong>in</strong>us Nijhoff/W.<br />
Junk Publishers, Dodrecht, 497 pp.<br />
United States Environmental Protection Agency (USEPA). 1998. National primary<br />
dr<strong>in</strong>k<strong>in</strong>g water regulations, dis<strong>in</strong>fectants <strong>and</strong> dis<strong>in</strong>fection byproducts, f<strong>in</strong>al rule. 40<br />
CFR parts 9,141, <strong>and</strong> 142. Federal Register 63 (241):69390-69476.<br />
United States Environmental Protection Agency (USEPA). 2001. The Stage 1<br />
Dis<strong>in</strong>fectants <strong>and</strong> Dis<strong>in</strong>fection Byproducts Rule, EPA 816-R-01-014.<br />
R-4 April 14, 2006
Conceptual Model <strong>for</strong> Organic Carbon <strong>in</strong> <strong>the</strong> Central Valley<br />
References<br />
United States Environmental Protection Agency (USEPA). 2003. The Feasibility of<br />
Per<strong>for</strong>m<strong>in</strong>g Cumulative Risk Assessments <strong>for</strong> Mixtures of Dis<strong>in</strong>fection By-products<br />
<strong>in</strong> Dr<strong>in</strong>k<strong>in</strong>g Water, EPA/600/R-03/051, C<strong>in</strong>c<strong>in</strong>nati, Ohio.<br />
Weishaar, JL, GR Aiken, B Bergamaschi, MS Fram, R Fujii, <strong>and</strong> Kenneth Mopper.<br />
2003. Evaluation of specific ultraviolet absorbance as an <strong>in</strong>dicator of <strong>the</strong> chemical<br />
composition <strong>and</strong> reactivity of dissolved <strong>organic</strong> <strong>carbon</strong>. Environmental Science &<br />
Technology.<br />
Wetzel, R.G. 2001. Limnology: Lake <strong>and</strong> River Ecosystems, Third Edition.<br />
Academic Press, San Diego, CA.<br />
Woodard, R. 2000. Sources <strong>and</strong> magnitudes of water quality constituents of concern<br />
<strong>in</strong> dr<strong>in</strong>k<strong>in</strong>g water supplies taken from <strong>the</strong> Sacramento-San Joaqu<strong>in</strong> Delta. CALFED<br />
Technical Report.<br />
April 14, 2006 R-5