David Chapman - State Water Resources Control Board
David Chapman - State Water Resources Control Board
David Chapman - State Water Resources Control Board

Create successful ePaper yourself
Turn your PDF publications into a flip-book with our unique Google optimized e-Paper software.
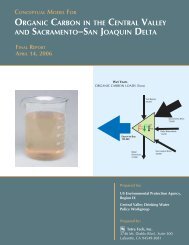
Damage Determination and<br />
Restoration Scaling<br />
<strong>David</strong> J. <strong>Chapman</strong><br />
Enforcenomics Workshop<br />
CA WQCB<br />
Berkeley, CA<br />
January 10, 2007
Measure of damages<br />
Overview<br />
“Damages means the amount of money sought by the<br />
natural resource trustee as compensation for injury,<br />
destruction, or loss of natural resources“<br />
Use of economics to “scale” damages approaches<br />
under CERCLA, OPA, and <strong>State</strong> Laws<br />
Applications and Case examples
Measuring Interim Losses<br />
What Economic Tools are Appropriate?<br />
Interim losses<br />
Total<br />
Resource<br />
Service<br />
Release<br />
Time
Measure of Natural Resource Damages:<br />
CERCLA, OPA Most <strong>State</strong> Laws<br />
• Cost of restoring the resource to baseline (primary<br />
restoration actions)<br />
• Loss in value of injured resources pending<br />
recovery to baseline<br />
OR<br />
Cost of restoration actions to compensate injured<br />
resources pending recovery<br />
• Assessment costs
Different Concepts of Compensation for<br />
Interim Losses<br />
Monetary compensation<br />
• How much money do the affected individuals require to be<br />
“made whole” for the loss?<br />
Resource compensation<br />
• How much additional public resources does the public<br />
require to be “made whole” for the loss?
Scaling Approaches<br />
Scaling determines:<br />
“How Much Compensation is the Public Owed?”<br />
Valuation approaches<br />
• Value-to-value methods<br />
• Value-to-cost methods<br />
Resource compensation<br />
• Service-to-service/resource-to-resource
Types of Economic Value<br />
Market<br />
• Profit and wages<br />
• Revenues<br />
• Jobs<br />
• Value of coastal real estate<br />
Non-market<br />
• Use values – recreation, environmental services<br />
• Non-use values/passive uses
Different Types of Economic Values<br />
for a Resource<br />
Active use values<br />
• Recreational fishing, boating, hunting, bird watching, commercial<br />
Option values<br />
• You may not use resource now, but you want to keep your options<br />
open to use it later<br />
Passive use values<br />
• Value of resources independent of any direct active use<br />
Bequest, existence<br />
Often ecological services (e.g., carbon sequestration) are<br />
placed under this category
Non-Market Valuation<br />
Most of the valuation in NRDA is of non-market values<br />
• Recreational services - beach Use, fishing etc.<br />
• Environmental goods – protecting species, open spaces<br />
• Natural resource quality – water quality, air quality<br />
Valuation is for both “use” and “non-use”<br />
Some resources are traded in markets where market valuation<br />
methods are possible – e.g., water, trees
Potential Valuation Tools<br />
Travel cost model:<br />
• Model demand for recreation based on individuals’ observed<br />
behavior (e.g., site choice and trip cost)<br />
Market Valuation:<br />
• Use of market data to determine market value or price or<br />
goods/services traded in markets e.g., water<br />
Hedonic analysis<br />
• Measure of environmental value through market prices (often<br />
housing prices)<br />
Conjoint analysis:<br />
• Survey procedure used to determine the values for attributes of goods<br />
or services based on stated and revealed preference data<br />
Contingent valuation:<br />
• Estimates total value using a questionnaire to collect information<br />
about respondents’ willingness to pay for a good or service
Methods to Scale Damages<br />
Travel cost<br />
Hedonic price models<br />
Contingent valuation<br />
Market Valuation<br />
Factor income<br />
Benefits transfer<br />
Conjoint<br />
Habitat/resource equivalency<br />
Value-to-value<br />
Value-to-cost<br />
Service-to-service<br />
Resource-to-resource
Valuation Approach (Value-to-Cost)<br />
Value of service losses due to injury (in $ terms) =<br />
cost of restoration projects<br />
Traditional “valuation” approach under CERCLA<br />
regulations<br />
Under OPA, is basically a “method of last resort”<br />
• Used when neither service-to-service nor value-to-value<br />
methods can be performed at a reasonable cost and/or<br />
within a reasonable timeframe<br />
• Will generally be used for smaller spills with limited<br />
damages
Valuation Approach (Value-to-Value)<br />
Framework:<br />
• Value ($) of service losses due to injury =<br />
value ($) of service gains from compensatory restoration<br />
project (with discounting)<br />
Conditions for use:<br />
• Applied when service-to-service is not appropriate<br />
Directly analogous to HEA scaling process, but using<br />
value, rather than measured resources or service<br />
flows, as the basis of equivalency calculation
Resource Equivalency Approach<br />
Framework:<br />
• <strong>Resources</strong>/service losses due to injury = resource/service gains from<br />
compensatory restoration project (with discounting)<br />
Conditions for use:<br />
• Injured and restored resources and services are the same type,<br />
quality, and comparable value<br />
Encompasses:<br />
• Habitat/resource equivalency analysis (HEA/REA)<br />
• Methods predicting direct human use services (recreational<br />
participation) – subject to specific constraints
Case Examples<br />
American Trader<br />
• Projects and Travel Cost Benefits Transfer<br />
Iron Mountain Mine<br />
• Resource Equivalency and Travel Cost Benefits Transfer<br />
Lavaca Bay<br />
• Value to Value for Recreational Fishing<br />
Montrose<br />
• Value to Cost – Contingent Valuation<br />
Green Bay<br />
• Value to Value - Conjoint
California Larger NRDA Cases
American Trader<br />
• 60 square miles of ocean were oiled<br />
• Oil washed ashore along roughly 14 miles of beaches<br />
• Closed Southern California Beaches for up to 5 weeks<br />
• Killed approximately 3,400 birds, including brown pelicans, and their off-spring<br />
were lost.<br />
•Oiled coastal wetlands
Iron Mountain Mine<br />
Aquatic Resource<br />
2.3 miles Boulder Creek<br />
2.6 miles Slickrock Creek<br />
Flat Creek<br />
Groundwater<br />
Riparian Habitats<br />
At least 50 acres<br />
Terrestrial Habitats<br />
Human Use<br />
Loss of use of over 2000 acres of<br />
recreation area<br />
Benefits Transfer/Travel Cost Method
Lavaca Bay, Texas<br />
Mercury and PAHs<br />
•Rec. Fishing Closure<br />
•Rec. Fishing consumption<br />
•Advisories<br />
•Fish<br />
•Benthic critters<br />
•Groundwater<br />
•Soils<br />
•Wetlands
Green Bay, Michigan/Wisconsin<br />
PCB / Dioxin Contamination<br />
Aquatic <strong>Resources</strong>/Sediments<br />
Fish<br />
Birds – bald eagles<br />
Recreational Fishing<br />
Fish Consumption Advisories
Green Bay NRDA – Restoration Scaling<br />
How much is enough?<br />
How should the different restoration project types be<br />
combined into an overall approach?<br />
What are the public’s preferences and attitudes?
Green Bay NRDA – Restoration Alternatives<br />
Wetland preservation<br />
Wetland restoration<br />
Reducing agricultural runoff into Green Bay<br />
• Stream buffer strips<br />
• Conservation tillage on cropland<br />
Improved recreational opportunities
Scaling Restoration<br />
Co-trustees used an economic survey of public values<br />
and attitudes (“total value equivalency”)<br />
The value to the public of the increase in<br />
environmental quality that will be achieved through<br />
restoration is balanced against the value that will be<br />
lost because of continuing PCB injuries<br />
This determines “how much is enough,” with the<br />
flexibility to consider different project mixes
PCB<br />
Cleanup<br />
Scenario<br />
Intensive<br />
Results – Restoration Scaling<br />
Acres<br />
preserved<br />
Wetlands<br />
Acres<br />
restored<br />
Increase in<br />
bay water<br />
clarity from<br />
runoff control<br />
Improvement<br />
in existing<br />
parks<br />
8,700 2,900 +2” 10%<br />
(injuries<br />
gone in 20<br />
years) 6,900 2,300 +6” 5%<br />
Intermediate<br />
(injuries<br />
gone in 40<br />
years)<br />
9,900<br />
8,700<br />
3,300<br />
2,900<br />
+4”<br />
+8”<br />
10%<br />
10%
Groundwater<br />
Often co-occurs with surface water injures at<br />
CERCLA sites<br />
For the most part this is only a state issue<br />
Quantification is often a challenge<br />
• Quantity v. quality issues<br />
Multiple approaches to estimate damages<br />
• Market Valuation<br />
• Value –to- Value<br />
• Resource Equivalency
Conclusions<br />
NRDA focuses on compensatory not punitive damages<br />
NRDA designed to make the public whole for injuries to<br />
natural resources through restoration<br />
• How much is enough?<br />
Economic methods are critical to determining how much<br />
compensation is approprate to make the public whole<br />
Multiple methods often used<br />
• Each case is unique<br />
• Different types of stressors<br />
• Alternative restoration approaches<br />
• Public preferences