Systems Analysis of Zaragoza Urban Water - SWITCH - Managing ...
Systems Analysis of Zaragoza Urban Water - SWITCH - Managing ...
Systems Analysis of Zaragoza Urban Water - SWITCH - Managing ...

Create successful ePaper yourself
Turn your PDF publications into a flip-book with our unique Google optimized e-Paper software.
<strong>Systems</strong> <strong>Analysis</strong> <strong>of</strong> <strong>Zaragoza</strong> UWS Guillermo Penagos<br />
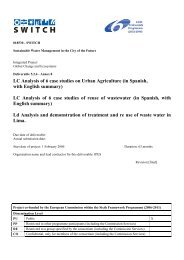
Annex 10. Calculations for Storm water overflows to the Ebro River<br />
Year<br />
Precipitation<br />
* Inpervious<br />
area<br />
Expected<br />
from<br />
precipitation<br />
+<br />
consumption<br />
Total<br />
Inflow<br />
WWTPs<br />
Expected from<br />
consumption<br />
minus Total<br />
inflow WWTPs<br />
Overflows<br />
to the<br />
river<br />
Precipitation<br />
Month (mm)<br />
2001 Jan 30 837,480 5,893,629 5,283,654 227,505 609,975<br />
2001 Feb 4 105,840 4,561,242 4,750,549 295,147 0<br />
2001 Mar 24 665,280 5,564,739 5,019,201 119,743 545,537<br />
2001 Apr 7 198,800 4,854,963 5,959,424 1,303,262 0<br />
2001 May 50 1,405,880 6,418,318 6,542,564 1,530,126 0<br />
2001 Jun 8 213,080 5,869,981 6,599,078 942,178 0<br />
2001 Jul 46 1,300,320 6,882,947 6,760,941 1,178,315 122,005<br />
2001 Aug 4 113,400 5,522,964 6,382,140 972,577 0<br />
2001 Sep 73 2,047,640 7,377,521 5,888,392 558,510 1,489,130<br />
2001 Oct 17 482,440 5,743,443 6,244,635 983,632 0<br />
2001 Nov 12 326,480 5,431,775 5,568,865 463,570 0<br />
2001 Dec 0 0 5,411,588 5,450,557 38,968 0<br />
2002 Jan 31 879,480 6,074,230 5,567,126 372,376 507,104<br />
2002 Feb 6 177,240 4,488,013 5,203,145 892,372 0<br />
2002 Mar 37 1,029,840 5,830,599 5,804,472 1,003,713 26,127<br />
2002 Apr 26 731,360 5,095,437 5,721,607 1,357,530 0<br />
2002 May 1 33,600 4,700,258 6,183,598 1,516,940 0<br />
2002 Jun 14 397,600 5,434,335 5,770,842 734,107 0<br />
2002 Jul 16 448,000 5,704,241 5,848,143 591,902 0<br />
2002 Aug 9 252,000 4,989,296 5,481,357 744,061 0<br />
2002 Sep 23 644,000 5,476,632 5,963,792 1,131,160 0<br />
2002 Oct 38 1,052,800 5,908,543 6,087,789 1,232,046 0<br />
2002 Nov 10 268,800 5,072,870 6,082,345 1,278,275 0<br />
2002 Dec 21 599,200 5,368,205 5,235,784 466,778 132,422<br />
Formula<br />
Estimated storm water<br />
= Precipitation * impervious area<br />
Overflows = Estimated storm water +<br />
Expected WWTPs inflow – Actual inflow to<br />
WWTPs<br />
Impervious area (km 2 ) = 28,000<br />
94