Systems Analysis of Zaragoza Urban Water - SWITCH - Managing ...
Systems Analysis of Zaragoza Urban Water - SWITCH - Managing ...
Systems Analysis of Zaragoza Urban Water - SWITCH - Managing ...

You also want an ePaper? Increase the reach of your titles
YUMPU automatically turns print PDFs into web optimized ePapers that Google loves.
<strong>Systems</strong> <strong>Analysis</strong> <strong>of</strong> <strong>Zaragoza</strong> UWS<br />
Guillermo Penagos<br />
TP concentration (ug l -1 )<br />
1000<br />
800<br />
600<br />
400<br />
200<br />
Concentration upstream<br />
<strong>Zaragoza</strong><br />
Current impact<br />
2020<br />
2060<br />
0<br />
Oct Nov Dec Jan Feb Mar Apr May Jun Jul Aug Sep<br />
Month<br />
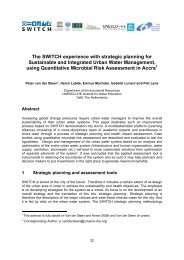
Figure 26. Impact <strong>of</strong> <strong>Zaragoza</strong> UWS upon TP concentrations at the Ebro River. Only upstream<br />
concentrations have been actually measured (CHE, 2007). Error bars represents standard deviation on<br />
a month basis. The other three concentrations are the ones that can be predicted from <strong>Zaragoza</strong> TP<br />
loads to the river at current conditions and at worst climate change scenario (Sc3?...worst climate<br />
change conditions, population growing at same rate as in the last ten years, no changes on WWT<br />
technology, no changes on people consumption patterns)<br />
TP concentrations in the Ebro River, upstream from <strong>Zaragoza</strong>, range between 100 to<br />
200 µg l -1 . Under current conditions the city does not have a significant impact on the<br />
river from October to May, but from June onwards the impact becomes more<br />
important and it may raise the TP concentrations up to 400 µg l -1 . In August when –as<br />
previously described– river discharge may drop down to 30 m 3 s -1 . For the 2020<br />
scenario the pattern is quite similar, but for the 2060 scenario August TP<br />
concentration goes up to 900 µg l -1 , which is more than three times the present<br />
upstream concentration.<br />
55