Systems Analysis of Zaragoza Urban Water - SWITCH - Managing ...
Systems Analysis of Zaragoza Urban Water - SWITCH - Managing ...
Systems Analysis of Zaragoza Urban Water - SWITCH - Managing ...

You also want an ePaper? Increase the reach of your titles
YUMPU automatically turns print PDFs into web optimized ePapers that Google loves.
<strong>Systems</strong> <strong>Analysis</strong> <strong>of</strong> <strong>Zaragoza</strong> UWS<br />
Guillermo Penagos<br />
4.4.3.3.3 Effect <strong>of</strong> water recycling on Energy consumption<br />
If water withdrawal is expected to decrease by 2020 then electric energy<br />
consumption is also expected to decrease. However, energy consumption <strong>of</strong> water<br />
facilities has got two components, a fixed value and a variable value that is<br />
proportional to the inflow. In order to identify such components a regression analysis<br />
between water inflow and energy consumption was performed for the water supply<br />
system in <strong>Zaragoza</strong>. The correlation is expressed by r 2 = 0.2 (data not shown).<br />
Meaning that 80% <strong>of</strong> energy consumption <strong>of</strong> the water supply process can be<br />
considered as a fixed value and 20% can be considered as flow dependent.<br />
The variable energy consumption for the water supply process is 0.1 Gwh per million<br />
m 3 . The energy consumption <strong>of</strong> pumping groundwater in <strong>Zaragoza</strong> is around 0.02<br />
Gwh per million m 3 . Recycling industrial water means increasing energy consumption<br />
because pumping will be necessary. An assumption here is made that recycling<br />
water will consume more energy than groundwater pumping, but <strong>of</strong> course much less<br />
than the variable energy consumption by water supply. This assumed value is 0.03<br />
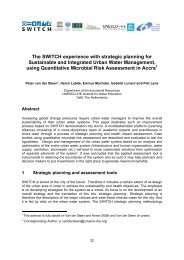
Gwh per million m 3 . Figure 22 shows an analysis <strong>of</strong> energy consumption by<br />
<strong>Zaragoza</strong> UWS for 2006 and for scenario 2020 considering these values as well as<br />
different levels for the industrial water recycling strategy.<br />
35<br />
30<br />
Energy recovering (%)<br />
Energy consumption<br />
Energy (Gwh)<br />
25<br />
20<br />
15<br />
10<br />
5<br />
0<br />
29.7 28.2 28.1 27.7<br />
10%<br />
2006 2020 no water<br />
recycling<br />
12% 12.1 % 12.2 %<br />
2020 with 10%<br />
Industrial water<br />
Recycling<br />
2020 with 30%<br />
Industrial water<br />
Recycling<br />
Figure 22. Energy consumption <strong>of</strong> <strong>Zaragoza</strong> UWS in 2006 and 2020 scenario with different levels<br />
<strong>of</strong> Industrial water recycling strategy<br />
<strong>Water</strong> recycling will result in less energy consumption for Industries using tap water<br />
since recycling is less costly than tap water supplying. For industries that do not use<br />
tap water, recycling is more expensive than extracting groundwater. Their additional<br />
50