Systems Analysis of Zaragoza Urban Water - SWITCH - Managing ...
Systems Analysis of Zaragoza Urban Water - SWITCH - Managing ... Systems Analysis of Zaragoza Urban Water - SWITCH - Managing ...
Systems Analysis of Zaragoza UWS Guillermo Penagos Irrigation water is considered here as an input for Zaragoza UWS for two reasons: 1) excess water from irrigation is 100% responsible for recharging the city’s aquifer and 2) some irrigation systems in the borders of urban area become parasitic water to the sewer system and end up in the WWTP. Both total contributions to the aquifer as well as to the sewer system are currently unknown. 4.2.1.4 Ground water In Zaragoza groundwater is not given any price and the water table is relatively shallow (5m in average). It is being extracted for industrial activities and for landscaping but it is not included by Zaragoza’s municipality in its account for total water withdrawal because it does not enter the distribution network. The institution responsible for authorizing groundwater extraction is not the Municipality but the CHE. Figure 2 shows groundwater withdrawal and its use in Zaragoza. The major consumer is Industry that is not connected to sewer system, corresponding to two paper mills owning private WWTPs and discharging into the Gallego and the Ebro River. If groundwater extraction is added to the calculation of water withdrawal, the actual consumption of Zaragoza UWS is 84 million m 3 year -1 of which 23% is groundwater. As stated previously, ground water in Zaragoza is not recharged by a natural water cycle. There is no recharge from the Ebro River either. All groundwater in Zaragoza come form agricultural irrigation in the surrounding area. Current rates are estimated in 10,000 m 3 ha -1 but the total irrigation area that is contributing to recharging the aquifer of the city is unknown and therefore so it is the total recharge (Ebroagua working group, personal communication). 4.2.2 Drinking water treatment Water from the Canal Imperial is treated in a plant with an installed capacity of 6 m 3 s 1 . Conventional treatment is applied, comprising: pre-chlorination, flocculation, sedimentation, rapid sand filtration and disinfection with chlorine. The consumption of chemical products for DWT is summarized in figure 2 and also it will be explained in more detail further on. As part of the policy of reducing water consumption adopted by the municipality the DWTP has been upgraded to dewater the sludge. Up to the year 2002 sludge with 26
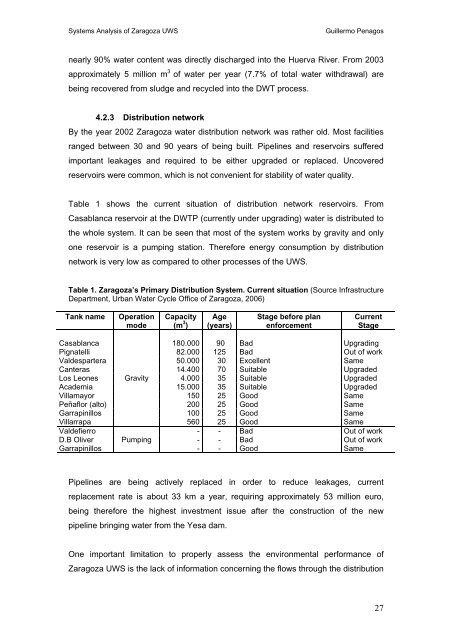
Systems Analysis of Zaragoza UWS Guillermo Penagos nearly 90% water content was directly discharged into the Huerva River. From 2003 approximately 5 million m 3 of water per year (7.7% of total water withdrawal) are being recovered from sludge and recycled into the DWT process. 4.2.3 Distribution network By the year 2002 Zaragoza water distribution network was rather old. Most facilities ranged between 30 and 90 years of being built. Pipelines and reservoirs suffered important leakages and required to be either upgraded or replaced. Uncovered reservoirs were common, which is not convenient for stability of water quality. Table 1 shows the current situation of distribution network reservoirs. From Casablanca reservoir at the DWTP (currently under upgrading) water is distributed to the whole system. It can be seen that most of the system works by gravity and only one reservoir is a pumping station. Therefore energy consumption by distribution network is very low as compared to other processes of the UWS. Table 1. Zaragoza’s Primary Distribution System. Current situation (Source Infrastructure Department, Urban Water Cycle Office of Zaragoza, 2006) Tank name Operation mode Capacity (m 3 ) Age (years) Stage before plan enforcement Current Stage Casablanca 180.000 90 Bad Upgrading Pignatelli 82.000 125 Bad Out of work Valdespartera 50.000 30 Excellent Same Canteras 14.400 70 Suitable Upgraded Los Leones Gravity 4.000 35 Suitable Upgraded Academia 15.000 35 Suitable Upgraded Villamayor 150 25 Good Same Peñaflor (alto) 200 25 Good Same Garrapinillos 100 25 Good Same Villarrapa 560 25 Good Same Valdefierro - - Bad Out of work D.B Oliver Pumping - - Bad Out of work Garrapinillos - - Good Same Pipelines are being actively replaced in order to reduce leakages, current replacement rate is about 33 km a year, requiring approximately 53 million euro, being therefore the highest investment issue after the construction of the new pipeline bringing water from the Yesa dam. One important limitation to properly assess the environmental performance of Zaragoza UWS is the lack of information concerning the flows through the distribution 27
- Page 1 and 2: Systems Analysis of Zaragoza UWS Gu
- Page 3 and 4: Systems Analysis of Zaragoza UWS Gu
- Page 5 and 6: Systems Analysis of Zaragoza UWS Gu
- Page 7 and 8: Systems Analysis of Zaragoza UWS Gu
- Page 9 and 10: Systems Analysis of Zaragoza UWS Gu
- Page 11 and 12: Systems Analysis of Zaragoza UWS Gu
- Page 13 and 14: Systems Analysis of Zaragoza UWS Gu
- Page 15 and 16: Systems Analysis of Zaragoza UWS Gu
- Page 17 and 18: Systems Analysis of Zaragoza UWS Gu
- Page 19 and 20: Systems Analysis of Zaragoza UWS Gu
- Page 21 and 22: Systems Analysis of Zaragoza UWS Gu
- Page 23 and 24: Systems Analysis of Zaragoza UWS Gu
- Page 25: Systems Analysis of Zaragoza UWS Gu
- Page 29 and 30: Systems Analysis of Zaragoza UWS Gu
- Page 31 and 32: Systems Analysis of Zaragoza UWS Gu
- Page 33 and 34: Systems Analysis of Zaragoza UWS Gu
- Page 35 and 36: Systems Analysis of Zaragoza UWS Gu
- Page 37 and 38: Systems Analysis of Zaragoza UWS Gu
- Page 39 and 40: Systems Analysis of Zaragoza UWS Gu
- Page 41 and 42: Systems Analysis of Zaragoza UWS Gu
- Page 43 and 44: Systems Analysis of Zaragoza UWS Gu
- Page 45 and 46: Systems Analysis of Zaragoza UWS Gu
- Page 47 and 48: Systems Analysis of Zaragoza UWS Gu
- Page 49 and 50: Systems Analysis of Zaragoza UWS Gu
- Page 51 and 52: Systems Analysis of Zaragoza UWS Gu
- Page 53 and 54: Systems Analysis of Zaragoza UWS Gu
- Page 55 and 56: Systems Analysis of Zaragoza UWS Gu
- Page 57 and 58: Systems Analysis of Zaragoza UWS Gu
- Page 59 and 60: Systems Analysis of Zaragoza UWS Gu
- Page 61 and 62: Systems Analysis of Zaragoza UWS Gu
- Page 63 and 64: Systems Analysis of Zaragoza UWS Gu
- Page 65 and 66: Systems Analysis of Zaragoza UWS Gu
- Page 67 and 68: Systems Analysis of Zaragoza UWS Gu
- Page 69 and 70: Systems Analysis of Zaragoza UWS Gu
- Page 71 and 72: Systems Analysis of Zaragoza UWS Gu
- Page 73 and 74: Systems Analysis of Zaragoza UWS Gu
- Page 75 and 76: Systems Analysis of Zaragoza UWS Gu
<strong>Systems</strong> <strong>Analysis</strong> <strong>of</strong> <strong>Zaragoza</strong> UWS<br />
Guillermo Penagos<br />
nearly 90% water content was directly discharged into the Huerva River. From 2003<br />
approximately 5 million m 3 <strong>of</strong> water per year (7.7% <strong>of</strong> total water withdrawal) are<br />
being recovered from sludge and recycled into the DWT process.<br />
4.2.3 Distribution network<br />
By the year 2002 <strong>Zaragoza</strong> water distribution network was rather old. Most facilities<br />
ranged between 30 and 90 years <strong>of</strong> being built. Pipelines and reservoirs suffered<br />
important leakages and required to be either upgraded or replaced. Uncovered<br />
reservoirs were common, which is not convenient for stability <strong>of</strong> water quality.<br />
Table 1 shows the current situation <strong>of</strong> distribution network reservoirs. From<br />
Casablanca reservoir at the DWTP (currently under upgrading) water is distributed to<br />
the whole system. It can be seen that most <strong>of</strong> the system works by gravity and only<br />
one reservoir is a pumping station. Therefore energy consumption by distribution<br />
network is very low as compared to other processes <strong>of</strong> the UWS.<br />
Table 1. <strong>Zaragoza</strong>’s Primary Distribution System. Current situation (Source Infrastructure<br />
Department, <strong>Urban</strong> <strong>Water</strong> Cycle Office <strong>of</strong> <strong>Zaragoza</strong>, 2006)<br />
Tank name<br />
Operation<br />
mode<br />
Capacity<br />
(m 3 )<br />
Age<br />
(years)<br />
Stage before plan<br />
enforcement<br />
Current<br />
Stage<br />
Casablanca 180.000 90 Bad Upgrading<br />
Pignatelli 82.000 125 Bad Out <strong>of</strong> work<br />
Valdespartera 50.000 30 Excellent Same<br />
Canteras 14.400 70 Suitable Upgraded<br />
Los Leones Gravity 4.000 35 Suitable Upgraded<br />
Academia 15.000 35 Suitable Upgraded<br />
Villamayor 150 25 Good Same<br />
Peñaflor (alto) 200 25 Good Same<br />
Garrapinillos 100 25 Good Same<br />
Villarrapa<br />
560 25 Good Same<br />
Valdefierro - - Bad Out <strong>of</strong> work<br />
D.B Oliver Pumping<br />
- - Bad Out <strong>of</strong> work<br />
Garrapinillos<br />
- - Good Same<br />
Pipelines are being actively replaced in order to reduce leakages, current<br />
replacement rate is about 33 km a year, requiring approximately 53 million euro,<br />
being therefore the highest investment issue after the construction <strong>of</strong> the new<br />
pipeline bringing water from the Yesa dam.<br />
One important limitation to properly assess the environmental performance <strong>of</strong><br />
<strong>Zaragoza</strong> UWS is the lack <strong>of</strong> information concerning the flows through the distribution<br />
27


