Systems Analysis of Zaragoza Urban Water - SWITCH - Managing ...
Systems Analysis of Zaragoza Urban Water - SWITCH - Managing ... Systems Analysis of Zaragoza Urban Water - SWITCH - Managing ...
Systems Analysis of Zaragoza UWS Guillermo Penagos treatment in Zaragoza requires large amounts of chemical reagents implying not jus a high cost of water treatment, but also a risk to public health due to DBPs. Shifting to a different raw water source and thereby reducing treatment cost and improving water quality is a strong need for the city. From 2008 the city will receive water from the Pyrenees, specifically from the Yesa reservoir which regulates the Aragon River and is also used for irrigation and hydropower production. A significant improvement of tap water quality for Zaragoza is expected from this new source. This will be discussed further on in the Scenario Analysis section. 4.2.1.2 Storm water Zaragoza is located in a semiarid region with an average precipitation of 270 mm per year, which is concentrated within 70 to 80 days (see figure 4a, showing 2006 daily based hydrograph as example). Precipitation per day in Zaragoza would rarely exceed 20 mm and dry and wet periods are not quite distinct. However, highest maximums and highest averages are reached in May and in September, but rarely exceeding 50 mm per month. Lowest averages and lowest minimums are usually reached in August and in December (see figure 4b). Daily p recip itation for 2006 ( mm) 50 40 30 20 10 0 Total precipitation = 288 mm Days with precipitation = 86 J F M A M J J A S O N D Month a Month p recip itation (m m) 50 40 30 20 10 0 J F M A M J J A S O N D Month b Figure 4. Annual precipitation hydrographs for Zaragoza. 4a. Daily based hydrograph for 2006 4b. Month averages. Error bars represent standard deviation Source Local Agenda 21 Office of Zaragoza Due to these hydrologic conditions storm water is not considered an issue by the Municipality. Nevertheless eventual overflows of storm water are discharged directly in the Ebro River without any treatment. Therefore Municipality is building two storm 24
Systems Analysis of Zaragoza UWS Guillermo Penagos water tanks to prevent the consequent pollution of the river. They are also considering about using storm water for cleaning public facilities or for landscaping. According to the municipality staff the sewer system has got serous dimensional limitations. Therefore, even under the consideration that Zaragoza is a semiarid region, storm water might saturate the system and overflow to the Ebro River under strong rain events 4.2.1.3 Agriculture irrigation systems The Ebro Valley at Aragon is the driest inland region of Europe. In fact most of the area around Zaragoza is naturally either bare or covered with desert-like vegetation. Water deficits are high due to low precipitation (less than 300 mm) and high evapotranspiration (more than 800 mm). Most of the soils of the region are Aridisols, and show similarities to those of North African deserts. However agriculture is an important activity along the Ebro catchment and the most relevant use of water resources in the catchment is agricultural irrigation. In Zaragoza province, including the surroundings of Zaragoza city, the irrigated area is nearly 177,000 ha (see figure 5). Figure 5. Irrigation in Zaragoza province. This satellite picture shows the desert surroundings of Zaragoza city. All the green areas are irrigated agricultural lands (Source: google maps, http://maps.google.es/maps?oi=eu_map&q=Zaragoza&hl=en) . 25
- Page 1 and 2: Systems Analysis of Zaragoza UWS Gu
- Page 3 and 4: Systems Analysis of Zaragoza UWS Gu
- Page 5 and 6: Systems Analysis of Zaragoza UWS Gu
- Page 7 and 8: Systems Analysis of Zaragoza UWS Gu
- Page 9 and 10: Systems Analysis of Zaragoza UWS Gu
- Page 11 and 12: Systems Analysis of Zaragoza UWS Gu
- Page 13 and 14: Systems Analysis of Zaragoza UWS Gu
- Page 15 and 16: Systems Analysis of Zaragoza UWS Gu
- Page 17 and 18: Systems Analysis of Zaragoza UWS Gu
- Page 19 and 20: Systems Analysis of Zaragoza UWS Gu
- Page 21 and 22: Systems Analysis of Zaragoza UWS Gu
- Page 23: Systems Analysis of Zaragoza UWS Gu
- Page 27 and 28: Systems Analysis of Zaragoza UWS Gu
- Page 29 and 30: Systems Analysis of Zaragoza UWS Gu
- Page 31 and 32: Systems Analysis of Zaragoza UWS Gu
- Page 33 and 34: Systems Analysis of Zaragoza UWS Gu
- Page 35 and 36: Systems Analysis of Zaragoza UWS Gu
- Page 37 and 38: Systems Analysis of Zaragoza UWS Gu
- Page 39 and 40: Systems Analysis of Zaragoza UWS Gu
- Page 41 and 42: Systems Analysis of Zaragoza UWS Gu
- Page 43 and 44: Systems Analysis of Zaragoza UWS Gu
- Page 45 and 46: Systems Analysis of Zaragoza UWS Gu
- Page 47 and 48: Systems Analysis of Zaragoza UWS Gu
- Page 49 and 50: Systems Analysis of Zaragoza UWS Gu
- Page 51 and 52: Systems Analysis of Zaragoza UWS Gu
- Page 53 and 54: Systems Analysis of Zaragoza UWS Gu
- Page 55 and 56: Systems Analysis of Zaragoza UWS Gu
- Page 57 and 58: Systems Analysis of Zaragoza UWS Gu
- Page 59 and 60: Systems Analysis of Zaragoza UWS Gu
- Page 61 and 62: Systems Analysis of Zaragoza UWS Gu
- Page 63 and 64: Systems Analysis of Zaragoza UWS Gu
- Page 65 and 66: Systems Analysis of Zaragoza UWS Gu
- Page 67 and 68: Systems Analysis of Zaragoza UWS Gu
- Page 69 and 70: Systems Analysis of Zaragoza UWS Gu
- Page 71 and 72: Systems Analysis of Zaragoza UWS Gu
- Page 73 and 74: Systems Analysis of Zaragoza UWS Gu
<strong>Systems</strong> <strong>Analysis</strong> <strong>of</strong> <strong>Zaragoza</strong> UWS<br />
Guillermo Penagos<br />
treatment in <strong>Zaragoza</strong> requires large amounts <strong>of</strong> chemical reagents implying not jus<br />
a high cost <strong>of</strong> water treatment, but also a risk to public health due to DBPs.<br />
Shifting to a different raw water source and thereby reducing treatment cost and<br />
improving water quality is a strong need for the city. From 2008 the city will receive<br />
water from the Pyrenees, specifically from the Yesa reservoir which regulates the<br />
Aragon River and is also used for irrigation and hydropower production. A significant<br />
improvement <strong>of</strong> tap water quality for <strong>Zaragoza</strong> is expected from this new source. This<br />
will be discussed further on in the Scenario <strong>Analysis</strong> section.<br />
4.2.1.2 Storm water<br />
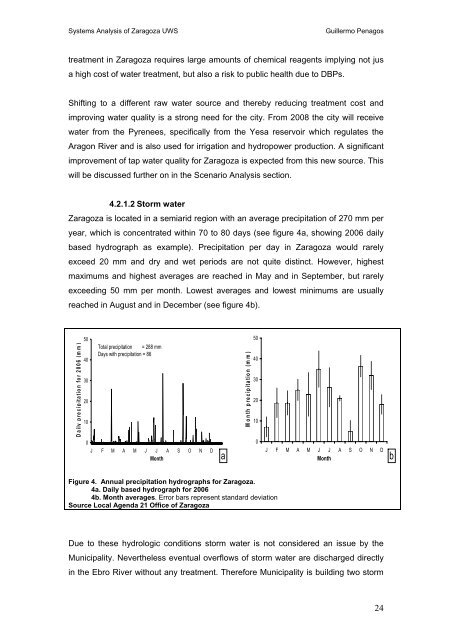
<strong>Zaragoza</strong> is located in a semiarid region with an average precipitation <strong>of</strong> 270 mm per<br />
year, which is concentrated within 70 to 80 days (see figure 4a, showing 2006 daily<br />
based hydrograph as example). Precipitation per day in <strong>Zaragoza</strong> would rarely<br />
exceed 20 mm and dry and wet periods are not quite distinct. However, highest<br />
maximums and highest averages are reached in May and in September, but rarely<br />
exceeding 50 mm per month. Lowest averages and lowest minimums are usually<br />
reached in August and in December (see figure 4b).<br />
Daily p recip itation for 2006 ( mm)<br />
50<br />
40<br />
30<br />
20<br />
10<br />
0<br />
Total precipitation = 288 mm<br />
Days with precipitation = 86<br />
J F M A M J J A S O N D<br />
Month<br />
a<br />
Month p recip itation (m m)<br />
50<br />
40<br />
30<br />
20<br />
10<br />
0<br />
J F M A M J J A S O N D<br />
Month<br />
b<br />
Figure 4. Annual precipitation hydrographs for <strong>Zaragoza</strong>.<br />
4a. Daily based hydrograph for 2006<br />
4b. Month averages. Error bars represent standard deviation<br />
Source Local Agenda 21 Office <strong>of</strong> <strong>Zaragoza</strong><br />
Due to these hydrologic conditions storm water is not considered an issue by the<br />
Municipality. Nevertheless eventual overflows <strong>of</strong> storm water are discharged directly<br />
in the Ebro River without any treatment. Therefore Municipality is building two storm<br />
24


