

FINAL REPORT
FINAL REPORT
FINAL REPORT

Create successful ePaper yourself
Turn your PDF publications into a flip-book with our unique Google optimized e-Paper software.
Crops Potatoes Carrots Tomatoes Cucumbers<br />
Onions Cabbages Turnips Watermelons<br />
Honeydew<br />
Melons<br />
Price 70-400 70-700 150-1000 150-500 150- 80-300 70-200 100- 150-500<br />
(MNT)<br />
1000<br />
400<br />
Average 150 150 400 200 400 150 150 175 200<br />
price*<br />
(MNT)<br />
Marketed 183.3 15.5 5 5.7 0.28 7 8 30 9<br />
amount (t)<br />
Revenues 27.5 2.33 2 1.14 0.11 1.05 1.2 5.25 1.8<br />
(Million<br />
MNT)<br />
*for which most farmers sold their crops<br />
Source: Survey results, June<br />
2006<br />
Table 28: Crop Prices paid to Surveyed Households and Revenues from Marketing, Myangad sum<br />
(2005/06)<br />
Thus calculated, on average each household had approximately 7million MNTrevenues from<br />
crop marketing. The average expenses for inputs, services and labor force were reported to be<br />
360,000 MNT per household. 24 Thus an average household’s income from crop farming is<br />
approximately 6.7 million MNT.<br />
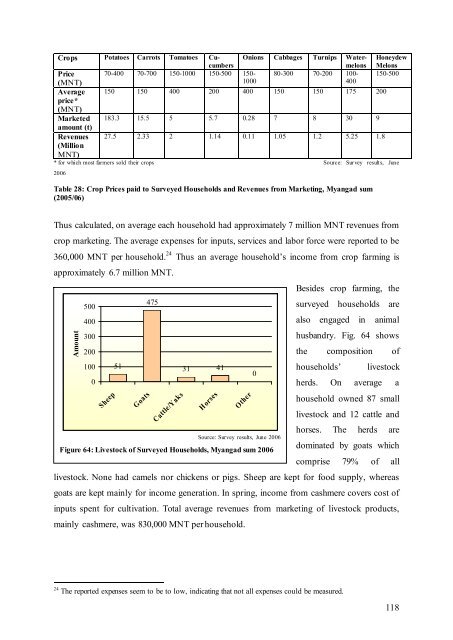
Besides crop farming, the<br />
Amount<br />
475<br />
500<br />
surveyed households are<br />
400<br />
also engaged in animal<br />
300<br />
husbandry. Fig. 64 shows<br />
200<br />
the composition of<br />
100 51<br />
31 41<br />
households’ livestock<br />
0<br />
0<br />
herds. On average a<br />
Sheep<br />
Goats<br />
Cattle/Yaks<br />
Horses<br />
Other<br />
Source: Survey results, June 2006<br />
Figure 64: Livestock of Surveyed Households, Myangad sum 2006<br />
household owned 87 small<br />
livestock and 12 cattle and<br />
horses. The herds are<br />
dominated by goats which<br />
comprise 79% of all<br />
livestock. None had camels nor chickens or pigs. Sheep are kept for food supply, whereas<br />
goats are kept mainly for income generation. In spring, income from cashmere covers cost of<br />
inputs spent for cultivation. Total average revenues from marketing of livestock products,<br />
mainly cashmere, was 830,000MNTper household.<br />
24 The reported expenses seem to be to low, indicating that not all expenses could be measured.<br />
118


