Cooperation Strategy Serbia 2010 - 2013 - Deza - admin.ch
Cooperation Strategy Serbia 2010 - 2013 - Deza - admin.ch
Cooperation Strategy Serbia 2010 - 2013 - Deza - admin.ch

You also want an ePaper? Increase the reach of your titles
YUMPU automatically turns print PDFs into web optimized ePapers that Google loves.
SWISS COOPERATION<br />
Balance of Paymenta and Trade<br />
2000<br />
2008<br />
Governance indicators, 2000 and 2007<br />
(US$ millions)<br />
Total mer<strong>ch</strong>andise exports (fob)<br />
Total mer<strong>ch</strong>andise imports (cif)<br />
Net trade in goods and services<br />
Current account balance<br />
as a % of GDP<br />
1,645<br />
3,227<br />
-1,441<br />
-153<br />
-1.7<br />
10,842<br />
21,997<br />
-11,404<br />
-8,557<br />
-17.1<br />
Voice and accountability<br />
Political stability<br />
Regulatory quality<br />
2007<br />
2000<br />
Workers’ remittances and<br />
compensation of employers (recepts)<br />
1,132<br />
4,579<br />
Rule of law<br />
Control of corruption<br />
Reserves, including gold<br />
Central Government Finance<br />
(% of GDP)<br />
Current revenue (including grants)<br />
Tax revenue<br />
Current expenditure<br />
524<br />
32.4<br />
29.1<br />
29.8<br />
11,477<br />
40.9<br />
35.8<br />
39.0<br />
Source: Kaufman Kraa Mastruzzi, World, NY Bank<br />
0 25 50 75 100<br />
Country's percentile rank 0-100<br />
(higher values implay better ratings)<br />
Overall surplus/deficit<br />
-0.2<br />
-2.5<br />
Te<strong>ch</strong>nology and Infrastructure<br />
2000<br />
2007<br />
Highest marginal rate (%)<br />
Individual<br />
Corporate<br />
External Debt and Resource Flows<br />
..<br />
..<br />
15<br />
10<br />
Paved roads (% of total)<br />
Fixed line and mobil phone<br />
subscribers (per 100 people)<br />
High tecnology exports<br />
(% of manufactured exports)<br />
62.7<br />
4<br />
9<br />
3.2<br />
..<br />
107<br />
4.3<br />
(US$ millions)<br />
Total debt outstanding and disbursed<br />
Total debt service<br />
Debt relief (HIPC, MDRI)<br />
10,830<br />
-65<br />
−<br />
30,708<br />
-4,927<br />
−<br />
Environment<br />
Argicultural land (% of land area)<br />
Forest area (% of land area)<br />
Nationally protected areas (% of land area)<br />
..<br />
..<br />
..<br />
..<br />
..<br />
..<br />
Total debt (% of GDP)<br />
Total debt sevice (% of exports)<br />
120.8<br />
-1.9<br />
63.6<br />
-24.2<br />
Freshwater resources paer capita (cu. meters)<br />
Freshwater withdrawal (% of internal resources)<br />
..<br />
..<br />
..<br />
..<br />
Foreign direct investment (net inflows)<br />
Portfolio equity (net inflows)<br />
145<br />
..<br />
2,717<br />
-132<br />
CO2 emission per capita (mt)<br />
..<br />
..<br />
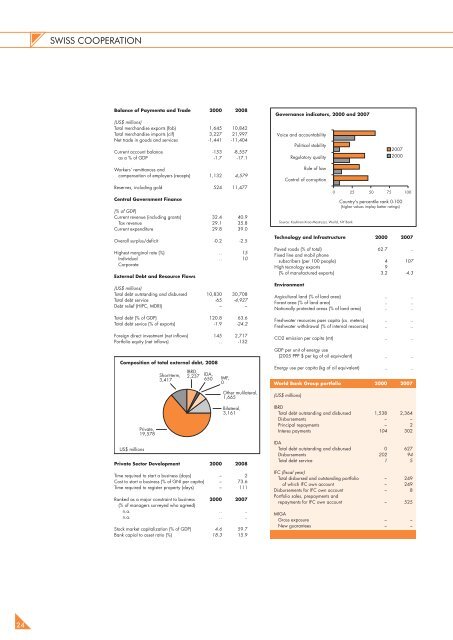
Composition of total external debt, 2008<br />
Short-term,<br />
3,417<br />
IBRD,<br />
2,237<br />
IDA,<br />
650 IMF,<br />
0<br />
GDP per unit of energy use<br />
(2005 PPP $ per kg of oil equivalent)<br />
Energy use per capita (kg of oil equivalent)<br />
World Bank Group portfolio<br />
..<br />
..<br />
2000<br />
..<br />
..<br />
2007<br />
Other mulilateral,<br />
1,665<br />
(US$ millions)<br />
Private,<br />
19,578<br />
Bilateral,<br />
3,161<br />
IBRD<br />
Total debt outstanding and disbursed<br />
Disbursements<br />
Principal repayments<br />
Interes payments<br />
1,538<br />
−<br />
−<br />
104<br />
2,364<br />
−<br />
2<br />
302<br />
US$ millions<br />
Private Sector Development<br />
2000<br />
2008<br />
IDA<br />
Total debt outstanding and disbursed<br />
Disbursements<br />
Total debt service<br />
0<br />
202<br />
1<br />
627<br />
94<br />
5<br />
Time required to start a business (days)<br />
Cost to start a business (% of GNI per capita)<br />
Time required to register property (days)<br />
Ranked as a major constraint to business<br />
(% of managers surveyed who agreed)<br />
n.a.<br />
n.a.<br />
Stock market capitalization (% of GDP)<br />
Bank capial to asset ratio (%)<br />
−<br />
−<br />
−<br />
2000<br />
..<br />
..<br />
4.6<br />
18.3<br />
2<br />
73.6<br />
111<br />
2007<br />
..<br />
..<br />
59.7<br />
15.9<br />
IFC (fiscal year)<br />
Total disbursed and outstanding portfolio<br />
of whi<strong>ch</strong> IFC own account<br />
Disbursements for IFC own account<br />
Portfolio sales, prepayments and<br />
repayments for IFC own account<br />
MIGA<br />
Gross exposure<br />
New guarantees<br />
−<br />
−<br />
−<br />
−<br />
−<br />
−<br />
249<br />
249<br />
8<br />
525<br />
−<br />
−<br />
24