Cooperation Strategy Serbia 2010 - 2013 - Deza - admin.ch
Cooperation Strategy Serbia 2010 - 2013 - Deza - admin.ch
Cooperation Strategy Serbia 2010 - 2013 - Deza - admin.ch

You also want an ePaper? Increase the reach of your titles
YUMPU automatically turns print PDFs into web optimized ePapers that Google loves.
SERBIA <strong>2010</strong>-<strong>2013</strong><br />
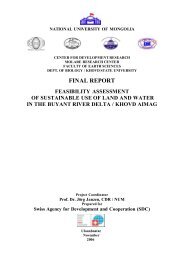
Annex 5: <strong>Serbia</strong> at a Glance<br />
Europe & Upper<br />
Key Development Indicators Central middle<br />
<strong>Serbia</strong> Asia income<br />
( 2008)<br />
Population, mid-year (millions) 7.4 445 823<br />
Surface area (thousand sq. km) 77 23,972 41,497<br />
Population growth (%) -0.3 0.0 0.6<br />
Urban population (% of total population) 56 64 75<br />
Age distribution, 2007<br />
Male<br />
75-79<br />
60-64<br />
45-49<br />
Female<br />
GNI (Atlas method, US$ billions) 41.6 2,694 5,750<br />
GNI per capita (Atlas method, US$) 5,650 6,051 6,987<br />
GNI per capita (PPP, international $) 10,220 11,116 11,868<br />
GDP growth (%) 5.6 6.8 5.8<br />
GDP per capita growth (%) 5.7 6.7 5.1<br />
(most recent estimate, 2003–2008)<br />
30-34<br />
15-19<br />
0-4<br />
10<br />
5 0 5 10<br />
percent<br />
Poverty headcount ratio at $1.25 a day (PPP, %) .. 5 ..<br />
Poverty headcount ratio at $2.00 a day (PPP, %) .. 11 ..<br />
Life expectancy at birth (years) 73 69 70<br />
Infant mortality (per 1,000 live births) 7 23 22<br />
Child malnutrition (% of <strong>ch</strong>ildren under 5) .. .. ..<br />
Adult literacy, male (% of ages 15 and older) 97 99 94<br />
Adult literacy, female (% of ages 15 and older) 96 96 92<br />
Gross primary enrollment, male (% of age group) 99 98 112<br />
Gross primary enrollment, female (% of age group) 99 96 109<br />
Under -5 mortality rate (per 1,000)<br />
60<br />
50<br />
40<br />
30<br />
20<br />
10<br />
Access to an improved water source (% of population) 99 95 95<br />
Access to improved sanitation facilities (% of population) .. 89 83<br />
0<br />
1990 1995 2000 2006<br />
<strong>Serbia</strong><br />
Europe & Central Asia<br />
Net Aid Flows 19 8 0 19 9 0 2000 2008<br />
(US$ millions)<br />
Net ODA and official aid .. .. 1,134 1,586<br />
Top 3 donors (in 2006):<br />
European Commission .. .. 471 334<br />
.. .. .. ..<br />
.. .. .. ..<br />
Aid (% of GNI) .. .. .. ..<br />
Aid per capita (US$) .. .. .. ..<br />
Long-Term Economic Trends<br />
Consumer prices (annual % <strong>ch</strong>ange) .. .. 70.0 11.7<br />
GDP implicit deflator (annual % <strong>ch</strong>ange) .. .. 79.3 13.5<br />
Ex<strong>ch</strong>ange rate (annual average, local per US$) .. .. 44.4 55.7<br />
Terms of trade index (2000 = 100) .. .. .. ..<br />
15<br />
10<br />
5<br />
0<br />
-5<br />
-10<br />
-15<br />
-20<br />
-25<br />
-30<br />
-35<br />
1980–90 1990–2000 2000–08<br />
(average annual growth %)<br />
Population, mid-year (millions) 7.7 7.6 7.7 7.4 .. 0.1 -0.5<br />
GDP (US$ millions) .. .. 8,963 50,061 .. -4.7 5.4<br />
(% of GDP)<br />
Growth of GDP and GDP per capita (%)<br />
1995 2005<br />
Agriculture .. .. 20.6 10.8 .. .. ..<br />
Industry .. .. 31.4 23.7 .. .. ..<br />
Manufacturing .. .. .. .. .. .. ..<br />
Services .. .. 48.1 65.5 .. .. ..<br />
Household final consumption expenditure .. .. 88.7 78.1 .. .. ..<br />
General gov't final consumption expenditure .. .. 18.9 21.3 .. .. ..<br />
Gross capital formation .. .. 8.4 23.4 .. .. ..<br />
Exports of goods and services .. .. 23.0 29.7 .. .. ..<br />
Imports of goods and services .. .. 39.1 52.4 .. .. ..<br />
Gross savings .. .. 3.7 6.2<br />
GDP<br />
GDP per capita<br />
23