
Create successful ePaper yourself
Turn your PDF publications into a flip-book with our unique Google optimized e-Paper software.
<strong>nfdump</strong> <strong>and</strong> <strong>NfSen</strong><br />
SWINOG-12<br />
May 4th 2006, Bern<br />
Peter Haag<br />
2006 © SWITCH<br />
<strong>nfdump</strong> <strong>and</strong> <strong>NfSen</strong><br />
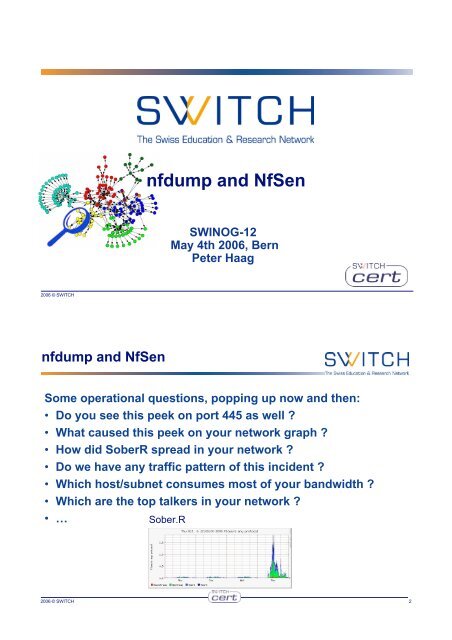
Some operational questions, popping up now <strong>and</strong> then:<br />
• Do you see this peek on port 445 as well ?<br />
• What caused this peek on your network graph ?<br />
• How did SoberR spread in your network ?<br />
• Do we have any traffic pattern of this incident ?<br />
• Which host/subnet consumes most of your b<strong>and</strong>width ?<br />
• Which are the top talkers in your network ?<br />
• …<br />
Sober.R<br />
2006 © SWITCH 2
<strong>nfdump</strong> <strong>and</strong> <strong>NfSen</strong><br />
How to find answers for all these questions?<br />
.. in discussions with other teams:<br />
– “Watch your flows for …”<br />
– “I’ve seen a lot of … in our flows …”<br />
– “Host are infected, when you see flows to …”<br />
2006 © SWITCH 3<br />
<strong>nfdump</strong> <strong>and</strong> <strong>NfSen</strong><br />
What is NetFlow?<br />
NetFlow is a traffic monitoring technology developed by<br />
Cisco Networks. Flows are unidirectional <strong>and</strong> contain<br />
connection related data such as:<br />
– Source <strong>and</strong> destination IP address.<br />
– Source <strong>and</strong> destination port.<br />
– Source <strong>and</strong> destination AS.<br />
– Level3 protocol, ToS byte, TCP flags.<br />
– Logical input <strong>and</strong> output interfaces.<br />
– Bytes <strong>and</strong> packet counters.<br />
Example:<br />
2006-03-30 00:47:33.728 54.971 TCP 172.16.71.66:13599 -> 192.168.10.34:80 .A..SF 215 9890<br />
2006 © SWITCH 4
<strong>nfdump</strong> <strong>and</strong> <strong>NfSen</strong><br />
How to get netflow data <strong>and</strong> how to look at them?<br />
Routers do provide netflow data …<br />
but …<br />
Router# show ip cache flow<br />
… seems not to be the solution for every task.<br />
! Tools to collect <strong>and</strong> look at the netflow data<br />
2006 © SWITCH 5<br />
<strong>nfdump</strong> <strong>and</strong> <strong>NfSen</strong><br />
<strong>nfdump</strong> <strong>and</strong> <strong>NfSen</strong>:<br />
<strong>NfSen</strong>:<br />
•Web based frontend<br />
•Display flows<br />
•Framework to automate tasks<br />
<strong>nfdump</strong>:<br />
•Collect <strong>and</strong> store flows<br />
•Process flows on comm<strong>and</strong> line<br />
2006 © SWITCH 6
<strong>nfdump</strong> <strong>and</strong> <strong>NfSen</strong><br />
<strong>nfdump</strong> overview :<br />
Text<br />
nfcapd<br />
netflow exporter<br />
storage<br />
<strong>nfdump</strong><br />
sfcapd<br />
Binary<br />
sflow exporter<br />
nfcapd.2006xx<br />
Collecting data<br />
Processing data<br />
2006 © SWITCH 7<br />
<strong>nfdump</strong> <strong>and</strong> <strong>NfSen</strong><br />
<strong>nfdump</strong> features:<br />
• CMD line based tool comparable to tcpdump.<br />
• Written in C ! fast.<br />
• Stores netflow data in time sliced files.<br />
• Supports netflow format v5,v7 <strong>and</strong> v9.<br />
• All processing options support IPv4 <strong>and</strong> IPv6.<br />
• Powerful pcap like filter syntax:<br />
( proto tcp <strong>and</strong> dst net 172.16/16 <strong>and</strong> src port > 1024 <strong>and</strong> bytes < 600 )<br />
or ( bps > 1k <strong>and</strong> …<br />
• Flexible flow aggregation.<br />
• Efficient filter engine: > 6 Mio flows/s on 3GHz Intel.<br />
• Lots of fast Top N statistics.<br />
• Anonymizing of IP addresses. ( Crypto-Pan )<br />
• User defined output formats.<br />
2006 © SWITCH 8
<strong>nfdump</strong> <strong>and</strong> <strong>NfSen</strong><br />
Example:<br />
List the first 20 tcp flows:<br />
forth% <strong>nfdump</strong> -r /data/rz/nfcapd.200603300150 -K 123.. -c 20 ‘proto tcp’<br />
Date flow start Duration Proto Src IP Addr:Port Dst IP Addr:Port Flags Packets Bytes<br />
2006-03-30 00:43:40.569 82.880 TCP 130.20.234.125:58035 -> 200.66.27.5:61486 .AP... 673 199208<br />
2006-03-30 00:43:40.569 82.880 TCP 200.66.27.5:61486 -> 130.20.234.125:58035 .A.... 421 19674<br />
2006-03-30 00:44:00.082 63.113 TCP 130.20.234.125:55697 -> 159.93.88.3:60454 .AP... 814 1.1 M<br />
2006-03-30 00:44:00.082 63.113 TCP 159.93.88.3:60454 -> 130.20.234.125:55697 .A.... 498 25896<br />
2006-03-30 00:45:02.647 0.431 TCP 193.246.238.35:80 -> 192.254.4.182:56547 .A.... 1 1500<br />
2006-03-30 00:45:02.647 0.431 TCP 192.254.4.182:56547 -> 193.246.238.35:80 .A.... 3 156<br />
2006-03-30 00:45:02.813 0.000 TCP 130.20.234.124:59112 -> 194.50.123.176:45458 .A...F 1 52<br />
2006-03-30 00:45:02.913 0.000 TCP 192.254.4.167:58659 -> 49.20.115.83:80 .A...F 1 52<br />
2006-03-30 00:45:02.913 0.000 TCP 129.66.105.181:11248 -> 192.254.4.183:80 ....S. 1 46<br />
2006-03-30 00:45:02.913 0.000 TCP 192.254.4.183:80 -> 129.66.105.181:11248 .A..S. 1 46<br />
2006-03-30 00:45:02.879 0.000 TCP 129.66.105.181:11247 -> 192.254.4.183:80 .AP... 1 515<br />
2006-03-30 00:45:02.879 0.000 TCP 192.254.4.183:80 -> 129.66.105.181:11247 .A.... 1 46<br />
2006-03-30 00:45:02.913 0.355 TCP 214.203.35.177:19027 -> 130.20.234.125:80 .A.... 3 156<br />
2006-03-30 01:40:02.347 300.572 TCP dffe:e6..:199:fd.119 -> dc7e:18..:fe99:2.35541 .AP... 811 66835<br />
2006-03-30 01:40:02.347 300.572 TCP dc7e:18..:fe99:2.35541 -> dffe:e6..:199:fd.119 .AP.S. 4850 6.9 M<br />
2006-03-30 00:45:02.895 0.000 TCP 192.254.4.183:80 -> 192.254.179.207:56323 .AP... 1 129<br />
2006-03-30 00:45:02.978 0.000 TCP 194.50.123.176:45465 -> 130.20.234.124:55652 ....S. 1 60<br />
2006-03-30 00:45:03.013 0.000 TCP 130.20.234.125:21 -> 50.242.99.240:61288 .A..S. 1 48<br />
2006-03-30 00:45:03.009 0.000 TCP 156.32.82.45:35110 -> 130.20.234.124:25 ....S. 1 60<br />
2006-03-30 00:45:03.041 0.000 TCP 130.20.234.125:80 -> 130.219.188.88:57168 .A.... 1 52<br />
IP addresses anonymized<br />
Time window: 2006-03-30 00:40:02 - 2006-03-30 01:49:10<br />
Total flows: 15970 matched: 20, skipped: 0, Bytes read: 838972<br />
Sys: 0.007s flows/second: 2044290.8 Wall: 0.004s flows/second: 3391378.2<br />
2006 © SWITCH 9<br />
<strong>nfdump</strong> <strong>and</strong> <strong>NfSen</strong><br />
Example:<br />
Show the top 15 IP addresses consuming most b<strong>and</strong>width:<br />
forth% <strong>nfdump</strong> -r /data/rz/nfcapd.200603300150 -K 123… -n 20 -s ip/bps<br />
Top 15 IP Addr ordered by bps:<br />
Date first seen Duration Proto IP Addr Flows Packets Bytes pps bps bpp<br />
2006-03-30 00:47:39.999 0.001 TCP 64.132.143.51 2 19 18004 18999 137.4 M 947<br />
2006-03-30 00:45:00.737 0.001 TCP 194.64.105.184 2 20 13600 20000 103.8 M 680<br />
2006-03-30 00:49:16.016 0.001 TCP 163.3.33.241 2 9 12046 9000 91.9 M 1338<br />
2006-03-30 00:49:52.902 0.001 TCP 92.37.170.104 2 10 9208 10000 70.3 M 920<br />
2006-03-30 00:45:06.853 0.001 TCP 214.214.200.81 2 6 6931 6000 52.9 M 1155<br />
2006-03-30 00:46:32.363 0.001 TCP 68.142.57.84 2 10 6720 10000 51.3 M 672<br />
2006-03-30 00:46:30.764 0.001 TCP 151.80.146.115 2 7 6680 7000 51.0 M 954<br />
2006-03-30 00:48:36.966 0.001 TCP 129.4.38.113 2 8 6184 8000 47.2 M 773<br />
2006-03-30 00:49:31.903 0.001 TCP 33.135.213.117 2 6 6104 6000 46.6 M 1017<br />
2006-03-30 01:42:48.834 0.001 TCP 90.38.160.152 2 8 5941 8000 45.3 M 742<br />
2006-03-30 00:48:02.473 0.001 TCP 131.144.55.170 2 6 5608 6000 42.8 M 934<br />
2006-03-30 00:49:29.424 0.001 TCP 24.11.195.220 2 4 4880 4000 37.2 M 1220<br />
2006-03-30 00:48:53.293 0.001 TCP 88.53.69.175 2 6 4721 6000 36.0 M 786<br />
2006-03-30 00:45:41.780 0.001 TCP 49.30.8.60 2 6 3822 6000 29.2 M 637<br />
2006-03-30 01:42:51.618 0.002 TCP 220.24.222.74 2 10 7605 5000 29.0 M 760<br />
IP addresses anonymized<br />
Time window: 2006-03-30 00:40:02 - 2006-03-30 01:49:58<br />
Total flows: 19224 matched: 19224, skipped: 0, Bytes read: 1009920<br />
Sys: 0.046s flows/second: 410112.0 Wall: 0.009s flows/second: 2022089.0<br />
2006 © SWITCH 10
<strong>nfdump</strong> <strong>and</strong> <strong>NfSen</strong><br />
Example:<br />
Show port scanning c<strong>and</strong>idates:<br />
forth% <strong>nfdump</strong> -r /data/rz/nfcapd.200603300150 -K 123… -A srcip,dstport -s record/packets 'not proto icmp <strong>and</strong> bytes < 100<br />
<strong>and</strong> bpp < 100 <strong>and</strong> packets < 5 <strong>and</strong> not port 80 <strong>and</strong> not port 53 <strong>and</strong> not port 110 <strong>and</strong> not port 123'<br />
Aggregated flows 72506<br />
Top 10 flows ordered by packets:<br />
Date flow start Duration Proto Src IP Addr:Port Dst IP Addr:Port Packets Bytes bps Flows<br />
2006-03-30 01:49:23.800 243.842 TCP 83.130.48.231:0 -> 0.0.0.0:4899 142172 6.5 M 223891 71151<br />
2006-03-30 01:50:48.603 236.035 TCP 165.17.105.18:0 -> 0.0.0.0:5900 34452 1.6 M 56049 17232<br />
2006-03-30 01:52:30.169 143.944 TCP 117.128.149.163:0 -> 0.0.0.0:41523 9982 479136 26629 5143<br />
2006-03-30 01:49:22.650 303.173 TCP 221.200.120.170:0 -> 0.0.0.0:1433 4638 222624 5874 2319<br />
2006-03-30 01:49:53.945 299.401 TCP 211.135.150.43:0 -> 0.0.0.0:135 3273 157104 4197 3273<br />
2006-03-30 01:49:27.196 194.565 TCP 201.143.63.114:0 -> 0.0.0.0:139 1845 88560 3641 1613<br />
2006-03-30 01:52:05.471 96.768 TCP 198.246.113.17:0 -> 0.0.0.0:445 1678 80544 6658 954<br />
2006-03-30 01:49:54.012 300.038 UDP 210.117.33.36:0 -> 0.0.0.0:137 1471 114738 3059 1471<br />
2006-03-30 01:49:22.970 328.838 TCP 164.88.206.114:0 -> 0.0.0.0:135 1432 68736 1672 1077<br />
2006-03-30 01:53:00.822 112.524 TCP 24.169.235.184:0 -> 0.0.0.0:135 1254 60192 4279 1254<br />
IP addresses anonymized<br />
Time window: 2006-03-30 01:34:53 - 2006-03-30 01:54:57<br />
Total flows: 1178835 matched: 245494, skipped: 0, Bytes read: 57559680<br />
Sys: 0.634s flows/second: 1856716.7 Wall: 0.632s flows/second: 1862657.6<br />
2006 © SWITCH 11<br />
<strong>nfdump</strong> <strong>and</strong> <strong>NfSen</strong><br />
Example:<br />
Show the top 15 /24 subnets exchanging most traffic:<br />
forth% <strong>nfdump</strong> -r /data/rz/nfcapd.200603300150 -K 123… -n 15 -A srcip4/24,dstip4/24 -s record/bytes<br />
Aggregated flows 7525<br />
Top 15 flows ordered by bytes:<br />
Date flow start Duration Proto Src IP Addr:Port Dst IP Addr:Port Packets Bytes Flows<br />
2006-03-30 00:41:06.140 4102.844 TCP 130.20.234.0:0 -> 130.254.221.0:0 79455 95.1 M 14<br />
2006-03-30 00:42:50.622 4022.361 TCP 130.20.234.0:0 -> 194.90.158.0:0 42179 58.2 M 13<br />
2006-03-30 00:40:51.729 4054.221 TCP 130.20.234.0:0 -> 220.63.34.0:0 39593 56.0 M 6<br />
2006-03-30 01:41:42.025 443.957 TCP 130.20.224.0:0 -> 163.3.42.0:0 30543 43.3 M 7<br />
2006-03-30 00:41:06.140 4102.844 TCP 130.254.221.0:0 -> 130.20.234.0:0 60178 29.1 M 14<br />
2006-03-30 01:39:56.087 600.881 TCP 130.20.234.0:0 -> 194.84.7.0:0 17836 24.9 M 9<br />
2006-03-30 00:44:39.128 3900.855 TCP 130.20.234.0:0 -> 214.124.39.0:0 15912 22.6 M 9<br />
2006-03-30 01:41:01.414 529.568 UDP 130.20.223.0:0 -> 130.20.220.0:0 15549 21.4 M 8<br />
2006-03-30 01:41:03.371 329.612 TCP 194.114.160.0:0 -> 130.20.234.0:0 14126 20.1 M 4<br />
2006-03-30 01:40:12.986 300.997 TCP 130.20.234.0:0 -> 194.168.190.0:0 13101 18.7 M 2<br />
2006-03-30 01:41:24.088 506.896 TCP 130.20.234.0:0 -> 24.50.25.0:0 12433 17.8 M 2<br />
2006-03-30 01:43:04.047 300.870 TCP 165.242.80.0:0 -> 130.20.234.0:0 9966 14.3 M 1<br />
2006-03-30 00:43:47.441 3935.542 TCP 130.20.234.0:0 -> 205.175.61.0:0 10445 13.4 M 15<br />
2006-03-30 00:44:01.619 332.758 TCP 130.20.234.0:0 -> 194.61.253.0:0 8973 12.7 M 101<br />
2006-03-30 01:42:43.123 300.860 TCP 130.20.234.0:0 -> 69.155.45.0:0 7872 11.3 M 1<br />
IP addresses anonymized<br />
Time window: 2006-03-30 00:40:02 - 2006-03-30 01:49:58<br />
Total flows: 19224 matched: 18797, skipped: 0, Bytes read: 1009920<br />
Sys: 0.062s flows/second: 307588.9 Wall: 0.010s flows/second: 1839969.4<br />
2006 © SWITCH 12
<strong>nfdump</strong> <strong>and</strong> <strong>NfSen</strong><br />
The art of filter design:<br />
• … depends on your problem you want to look at.<br />
– Incident Analysis.<br />
– Host tracking.<br />
– Port Scanning.<br />
– Operational issues.<br />
• … depends on your network.<br />
nfump does not do your job, but supports you in<br />
doing your job!<br />
Use the power of <strong>nfdump</strong>’s filter syntax!<br />
2006 © SWITCH 13<br />
<strong>nfdump</strong> <strong>and</strong> <strong>NfSen</strong><br />
<strong>nfdump</strong> is:<br />
• Powerful<br />
• Flexible<br />
• Easy to use<br />
• Fast<br />
• …<br />
! <strong>NfSen</strong><br />
2006 © SWITCH 14
<strong>nfdump</strong> <strong>and</strong> <strong>NfSen</strong><br />
<strong>NfSen</strong> features:<br />
• Use the power of <strong>nfdump</strong> as backend tool. ! modular design.<br />
• Pictures!<br />
• Drill down from overview to the details down to the specific flows.<br />
• Graph current network situation.<br />
• Graph specific profiles.<br />
– Track hosts, ports etc. from live data.<br />
– Profile hosts involved in incidents from history data.<br />
• Analyse a specific time window.<br />
• Web based.<br />
• Automatically post process netflow data for reporting <strong>and</strong> alerting<br />
purpose.<br />
• Flexible extensions using plugins.<br />
• Easy to use.<br />
• Auto - Cleanup. Aging data files: max space, max lifetime.<br />
2006 © SWITCH 15<br />
<strong>nfdump</strong> <strong>and</strong> <strong>NfSen</strong><br />
Putting all together:<br />
From:<br />
To:<br />
Summary:<br />
monitored:<br />
...<br />
..<br />
softflowd<br />
pfflowd<br />
Input<br />
netflow v5, v7,v9<br />
Web Front-end<br />
Post<br />
Processing<br />
Periodic Update Tasks & Plugins<br />
<strong>nfdump</strong> Backend<br />
CLI<br />
2006 © SWITCH 16
<strong>nfdump</strong> <strong>and</strong> <strong>NfSen</strong><br />
Overview ! Details<br />
Details ! Flows<br />
2006 © SWITCH 18
<strong>nfdump</strong> <strong>and</strong> <strong>NfSen</strong><br />
Profiles:<br />
• A profile is a specific view on the netflow data with<br />
<strong>nfdump</strong> filters applied.<br />
• The profile applies to the graphical as well as to the<br />
numerical view.<br />
• Profiles can be created from data in the past. ( static )<br />
• Profiles can be created from incoming data ( continuous )<br />
• Any views or processing options are available.<br />
2006 © SWITCH 32
<strong>nfdump</strong> <strong>and</strong> <strong>NfSen</strong><br />
2006 © SWITCH 33<br />
<strong>nfdump</strong> <strong>and</strong> <strong>NfSen</strong><br />
Profile: ‘port 53 <strong>and</strong> ( tcp or udp ):<br />
Overview ! Details<br />
Details ! Flows<br />
2006 © SWITCH 34
<strong>nfdump</strong> <strong>and</strong> <strong>NfSen</strong><br />
Example Profiles:<br />
Filter: ‘( udp or tcp ) <strong>and</strong> port 53 Filter: ‘bytes < 100’<br />
Filters may be as complex as the the filter syntax of <strong>nfdump</strong> allows.<br />
Example: ‘((src net 172.16/16 <strong>and</strong> src port > 1024 ) or dst host 192.168.16.17<br />
<strong>and</strong> dst port 80) <strong>and</strong> packets > 1000 <strong>and</strong> pps > 150’<br />
2006 © SWITCH 35<br />
<strong>NfSen</strong>/NFDUMP<br />
SoberR: ‘tcp <strong>and</strong> dst port 587’<br />
2006 © SWITCH 36
<strong>nfdump</strong> <strong>and</strong> <strong>NfSen</strong><br />
Incident analysis - profile a hacked host:<br />
2006 © SWITCH 37<br />
<strong>nfdump</strong> <strong>and</strong> <strong>NfSen</strong><br />
Plugins - what for?<br />
• Monitoring <strong>and</strong> alerting.<br />
• Track for known botnet masters <strong>and</strong> send notifications.<br />
• Track for possible scanners or DoS attacks, not necessarily visible<br />
in the graph.<br />
• Port Tracking.<br />
Backend Plugins are:<br />
• Simple Perl modules hooked into the <strong>NfSen</strong> backend.<br />
• Automatically called at regular 5 Min intervals.<br />
Frontend Plugins are:<br />
• Simple PHP modules hooked into <strong>NfSen</strong> frontend.<br />
• Called by selecting the tab.<br />
2006 © SWITCH 38
<strong>nfdump</strong> <strong>and</strong> <strong>NfSen</strong><br />
<strong>NfSen</strong> Plugins:<br />
Web Front-end<br />
Post Processing<br />
Frontend Plugins<br />
Backend Plugins<br />
Periodic Update<br />
2006 © SWITCH 39<br />
<strong>nfdump</strong> <strong>and</strong> <strong>NfSen</strong><br />
Backend Plugins:<br />
register<br />
#<br />
@plugins = (<br />
['live', 'CatchDos'],<br />
);<br />
1;<br />
#<br />
package CatchDos;<br />
use strict;<br />
#<br />
sub Init {<br />
# Init plugin<br />
} # End of Init<br />
nfsen.conf<br />
Report<br />
…<br />
…<br />
sub run {<br />
my $profile = shift;<br />
my $timeslot = shift;<br />
Notification.pm<br />
} # End of run<br />
Backend Plugin<br />
Runs automatically<br />
every 5 min<br />
output<br />
2006 © SWITCH 40
<strong>nfdump</strong> <strong>and</strong> <strong>NfSen</strong><br />
Writing Backend Plugins:<br />
• Select a plugin name: MyPlugin<br />
• Create a Perl module named MyPlugin.pm<br />
• Write your code.<br />
• Try/debug your module offline using $BINDIR/testPlugin:<br />
./testPlugin -p MyPlugin -P live -t 200603140800<br />
• Store the file MyPlugin.pm in the directory $BACKEND_PLUGINDIR<br />
( e.g. /data/nfsen/plugins )<br />
• Register the plugin in nfsen.conf for the profiles in question:<br />
@plugins = ( # profile # modul<br />
# [ '*', 'demoplugin' ],<br />
[ 'live', ’MyPlugin'],<br />
);<br />
2006 © SWITCH 41<br />
<strong>nfdump</strong> <strong>and</strong> <strong>NfSen</strong><br />
#!/usr/bin/perl<br />
package MyPlugin;<br />
use strict;<br />
# Periodic function<br />
# input: profilename<br />
# timeslot. Format yyyymmddHHMM e.g. 200503031200<br />
sub run {<br />
my $profile = shift;<br />
my $timeslot = shift;<br />
# Called at every cycle<br />
# Your code goes here<br />
}<br />
sub Init {<br />
# Do module init staff here<br />
}<br />
# return 1 on success - module successfully loaded<br />
# return 0 on failure - module disabled<br />
return 1;<br />
sub BEGIN {<br />
# St<strong>and</strong>ard BEGIN Perl function - See Perl documentation<br />
# Called on loading the module<br />
}<br />
sub END {<br />
# St<strong>and</strong>ard END Perl function - See Perl documentation<br />
# Called on unloading the module<br />
}<br />
1;<br />
2006 © SWITCH 42
<strong>nfdump</strong> <strong>and</strong> <strong>NfSen</strong><br />
Example C<strong>and</strong>idates for scanning activities:<br />
….<br />
#<br />
#<br />
# Define a nice filter:<br />
# We like to see flows containing more than xxx packets<br />
my $limit = 6000 ;<br />
my $nf_filter = ’duration < 3500 <strong>and</strong> packets < 3 <strong>and</strong> bpp < 100 <strong>and</strong> src as 559’;<br />
# Periodic function<br />
# input: profilename<br />
# timeslot. Format yyyymmddHHMM e.g. 200503031200<br />
sub run {<br />
my $profile = shift;<br />
my $timeslot = shift;<br />
syslog('debug', "CatchScanners run: Profile: $profile, Time: $timeslot");<br />
my %profileinfo = <strong>NfSen</strong>::ReadProfile($profile);<br />
my $netflow_sources = $profileinfo{'sourcelist'};<br />
#<br />
# process all sources of this profile at once<br />
my @output = `$<strong>nfdump</strong> -M $PROFILEDATADIR/$profile/$netflow_sources -r nfcapd.$timeslot -a -A srcip,dstport -l<br />
$limit -f $nf_filter`;<br />
…<br />
#<br />
# Process the output <strong>and</strong> notify the duty team<br />
( IP addresses anonymised )<br />
2006 © SWITCH 43<br />
<strong>nfdump</strong> <strong>and</strong> <strong>NfSen</strong><br />
Backend / Frontend Plugins:<br />
register<br />
#<br />
@plugins = (<br />
['live', 'CatchDos'],<br />
);<br />
1;<br />
#<br />
package CatchDos;<br />
use strict;<br />
#<br />
sub Init {<br />
# Init plugin<br />
} # End of Init<br />
sub run {<br />
my $profile = shift;<br />
my $timeslot = shift;<br />
nfsen.conf<br />
/* Port Tracker<br />
* Plugin<br />
*/<br />
function<br />
PortTracker_Run($plugi) {<br />
$portinfo =<br />
GetTopN($plugin_id,<br />
$_SESSION["${plugin_id}<br />
…<br />
} // End of<br />
PortTracker_Run<br />
} # End of run<br />
Backend Plugin<br />
Runs automatically<br />
every 5 min<br />
output<br />
Frontend Plugin<br />
2006 © SWITCH 44
<strong>nfdump</strong> <strong>and</strong> <strong>NfSen</strong><br />
Writing Frontend Plugins:<br />
• Write the Backend plugin: MyPlugin<br />
• Create a PHP module named MyPlugin.php<br />
• Write your code.<br />
– Must have 2 well defined functions:<br />
function _ParseInput( $plugin_id )<br />
function _Run( $plugin_id )<br />
– Have each a unique plugin ID: $plugin_id<br />
– Run at any time the user selects the plugin.<br />
– Profile read only information available in $_SESSION[‘profileinfo’]<br />
example: $_SESSION[‘profileinfo’][‘name’]<br />
• Store the file MyPlugin.php in the directory $FRONTEND_PLUGINDIR<br />
( e.g. /var/www/htdocs/nfsen/plugins )<br />
• Reload nfsen-run backgroud process: $BINDIR/nfsen reload<br />
• Check correct load of module in syslog file.<br />
2006 © SWITCH 45<br />
<strong>nfdump</strong> <strong>and</strong> <strong>NfSen</strong><br />
<strong>nfdump</strong> <strong>and</strong> <strong>NfSen</strong><br />
Planned Plugin: Host behaviour based worm detection:<br />
Result of a PhD network security research work in the context of the DDoSVax<br />
project at Swiss Federal Institute of Technology Zurich:<br />
http://www.tik.ee.ethz.ch/~ddosvax/<br />
Idea: Infected hosts show a different behaviour <strong>and</strong> can<br />
be put into different classes:<br />
„Traffic“ class:<br />
Worm infected hosts tend to send considerably more traffic than they receive.<br />
„Responder“ class:<br />
If many more hosts start to answer requests, they probably are victims of a worm.<br />
„Connector“ class:<br />
Worm infected hosts typically open many connections.<br />
2006 © SWITCH 48
<strong>nfdump</strong> <strong>and</strong> <strong>NfSen</strong> <strong>NfSen</strong><br />
DDoS Vax : Host behaviour based worm detection:<br />
Example: MyDoom.A<br />
Traffic<br />
(T)<br />
T"C<br />
T"R"C<br />
Connector<br />
(C)<br />
T"R<br />
R"C<br />
Responder<br />
(R)<br />
„no class“<br />
Most interesing for worm detection are cardinalities of class combinations.<br />
2006 © SWITCH 49<br />
<strong>nfdump</strong> <strong>and</strong> <strong>NfSen</strong><br />
Figures @ SWITCH:<br />
• Server: 2 x 3GHz 2GB Ram. Debian Linux Kernel 2.6.10<br />
• 3TB ( 2TB + 1TB ) AXUS Disk Raid<br />
• XFS file system.<br />
• Gigabit Ethernet interfaces.<br />
• 5min workload avg. ca. 5%.<br />
• 25GB Netflow data / day.<br />
• About 41 days of netflow data available.<br />
2006 © SWITCH 50
<strong>nfdump</strong> <strong>and</strong> <strong>NfSen</strong><br />
Next Steps - Todo list - a lot of work:<br />
<strong>NfSen</strong>:<br />
• more plugins ..<br />
• Improved profiles.<br />
• Improved interface.<br />
• …<br />
<strong>nfdump</strong>:<br />
• Related filters: ‘Worm Footprint Tracking’<br />
first { dst ip dst port 445 bytes > 600 }<br />
then { src ip <strong>and</strong> dst ip 172.16.17.18 <strong>and</strong> dst port 80 }<br />
• Include more v9/sflow data in capture files.<br />
• Realtime flow processing.<br />
• Nesting direcoriy levels for data organisation<br />
• …<br />
2006 © SWITCH 51<br />
<strong>nfdump</strong> <strong>and</strong> <strong>NfSen</strong><br />
Summary:<br />
• Powerful <strong>and</strong> flexible tools for all sort of netflow tasks.<br />
– Network monitoring.<br />
– Incident H<strong>and</strong>ling.<br />
– All sort of tracking …<br />
• Open Source under BSD License.<br />
• Cmd line tool: <strong>nfdump</strong><br />
– Written in C. Runs on most *nix.<br />
Tested on Linux Kernel 2.4.* <strong>and</strong> 2.6.*,<br />
FreeBSD, OpenBSD, Solaris.<br />
– Available at http://<strong>nfdump</strong>.sourceforge.net<br />
• Web based frontend: <strong>NfSen</strong><br />
– Written in PHP <strong>and</strong> Perl.<br />
– Extendable using plugins.<br />
– Available at http://nfsen.sourceforge.net<br />
2006 © SWITCH 52
<strong>nfdump</strong> <strong>and</strong> <strong>NfSen</strong><br />
2006 © SWITCH 53