Alafia River Minimum Flows and Levels - Southwest Florida Water ...
Alafia River Minimum Flows and Levels - Southwest Florida Water ... Alafia River Minimum Flows and Levels - Southwest Florida Water ...
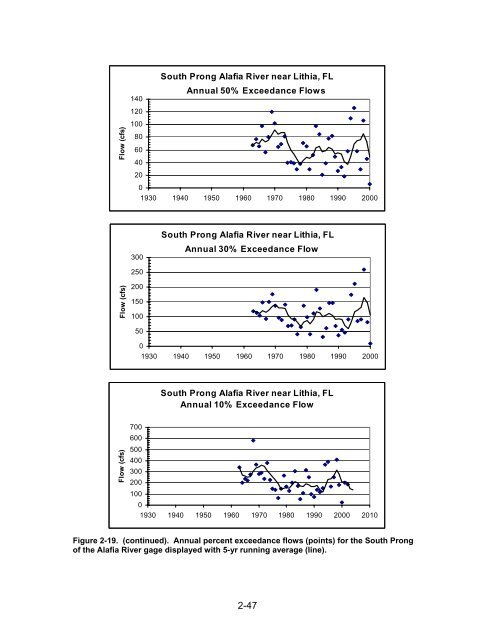
South Prong Alafia River near Lithia, FL 140 Annual 50% Exceedance Flows 120 Flow (cfs) 100 80 60 40 20 0 1930 1940 1950 1960 1970 1980 1990 2000 South Prong Alafia River near Lithia, FL 300 Annual 30% Exceedance Flow 250 Flow (cfs) 200 150 100 50 0 1930 1940 1950 1960 1970 1980 1990 2000 South Prong Alafia River near Lithia, FL Annual 10% Exceedance Flow Flow (cfs) 700 600 500 400 300 200 100 0 1930 1940 1950 1960 1970 1980 1990 2000 2010 Figure 2-19. (continued). Annual percent exceedance flows (points) for the South Prong of the Alafia River gage displayed with 5-yr running average (line). 2-47
Alafia River at Lithia - Water Quality Alafia River at Lithia - Water Quality 50 30 Phosphorus (mg/l P) 40 30 20 10 Fluoride, Dissolved (mg/l F) 25 20 15 10 5 0 Jan-65 Jan-75 Jan-85 Jan-95 0 Jan-65 Jan-75 Jan-85 Jan-95 North Prong of the Alafia River - Water Quality North Prong of the Alafia River - Water Quality Phosphorus (mg/l P) 120 100 80 60 40 20 0 Fluoride, Dissolved (mg/l F) 50 40 30 20 10 0 Jan-65 Jan-75 Jan-85 Jan-95 Jan-65 Jan-75 Jan-85 Jan-95 Figure 2-20. Phosphorus and fluoride concentrations in the Alafia River and the North and South Prongs. 2-48
- Page 23 and 24: Peace River at Zolfo Springs, FL. s
- Page 25 and 26: Period of Record Median Daily Flows
- Page 27 and 28: to enhance understanding of histori
- Page 29 and 30: River watershed, to the east by the
- Page 31 and 32: an adjacent area locally known as t
- Page 33 and 34: Water in the surficial aquifer is r
- Page 35 and 36: The Upper Floridan aquifer (UFA) sy
- Page 37 and 38: Figure 2-4. May and September 2001
- Page 39 and 40: head differences indicating breache
- Page 41 and 42: data (multiple regression) analyses
- Page 43 and 44: 2.2 Land Use Changes in the Alafia
- Page 45 and 46: Before discussing individual sub-ba
- Page 47 and 48: Table 2-2. Land use and land cover
- Page 49 and 50: Table 2-3. Land use and land cover
- Page 51 and 52: Figure 2-13. 1972 and 1999 Land use
- Page 53 and 54: 2.2.4 Lithia Springs Sub-Basin The
- Page 55 and 56: 2.3 Hydrology The assessment of min
- Page 57 and 58: Period of Record Median Daily Flows
- Page 59 and 60: occurred during the spring were sim
- Page 61 and 62: Conversely, since most of the Unite
- Page 63 and 64: extending from 1940 to 1969 can be
- Page 65 and 66: Period of Record Median Daily Flows
- Page 67 and 68: third highest flow occurred early i
- Page 69 and 70: Flow (cfs) Alafia River at Lithia,
- Page 71 and 72: 100 North Prong Alafia River at Key
- Page 73: Flow (cfs) South Prong Alafia River
- Page 77 and 78: South Prong Watershed Above USGS Ga
- Page 79 and 80: Comparisons of land use changes and
- Page 81 and 82: Comparison of Median Daily Flows fo
- Page 83 and 84: Comparisons of Annual 25% Exceedanc
- Page 85 and 86: Figure 2-25. Lithia Springs Major b
- Page 87 and 88: 2.3.4.3.2 Discharge from Lithia Spr
- Page 89 and 90: Relationship Between Lithia Springs
- Page 91 and 92: Buckhorn Spring Main Discharge (Wit
- Page 93 and 94: versus flow. The third plot typical
- Page 95 and 96: Alafia River at Lithia, FL Phosphor
- Page 97 and 98: While elevated phosphorus concentra
- Page 99 and 100: Peace River at Arcadia, FL 20 Phosp
- Page 101 and 102: Alafia River at Lithia, FL Nitrate/
- Page 103 and 104: 2.4.2 Potassium and Trend Analysis
- Page 105 and 106: Alafia River at Lithia, FL 14 Potas
- Page 107 and 108: Table 2-10. Results of Kendall's ta
- Page 109 and 110: Chapter 3 Ecological Resources of C
- Page 111 and 112: 1) maintenance of minimum water dep
- Page 113 and 114: flow regimes and these life history
- Page 115 and 116: subsidy of water and nutrients that
- Page 117 and 118: Chapter 4 Technical Approach for Es
- Page 119 and 120: 4.2.1 HEC-RAS Cross-Sections Cross
- Page 121 and 122: PHABSIM analysis required acquisiti
- Page 123 and 124: Figure 4-5. Upstream vegetation cro
South Prong <strong>Alafia</strong> <strong>River</strong> near Lithia, FL<br />
140<br />
Annual 50% Exceedance <strong>Flows</strong><br />
120<br />
Flow (cfs)<br />
100<br />
80<br />
60<br />
40<br />
20<br />
0<br />
1930 1940 1950 1960 1970 1980 1990 2000<br />
South Prong <strong>Alafia</strong> <strong>River</strong> near Lithia, FL<br />
300<br />
Annual 30% Exceedance Flow<br />
250<br />
Flow (cfs)<br />
200<br />
150<br />
100<br />
50<br />
0<br />
1930 1940 1950 1960 1970 1980 1990 2000<br />
South Prong <strong>Alafia</strong> <strong>River</strong> near Lithia, FL<br />
Annual 10% Exceedance Flow<br />
Flow (cfs)<br />
700<br />
600<br />
500<br />
400<br />
300<br />
200<br />
100<br />
0<br />
1930 1940 1950 1960 1970 1980 1990 2000 2010<br />
Figure 2-19. (continued). Annual percent exceedance flows (points) for the South Prong<br />
of the <strong>Alafia</strong> <strong>River</strong> gage displayed with 5-yr running average (line).<br />
2-47


