Alafia River Minimum Flows and Levels - Southwest Florida Water ...
Alafia River Minimum Flows and Levels - Southwest Florida Water ... Alafia River Minimum Flows and Levels - Southwest Florida Water ...
Comparison of January Rainfall Totals for Two Sites. Comparison of February Rainfall Totals for Two Sites. Plant City Rainfall (inches) 14 12 10 8 6 4 2 0 y = 0.9046x + 0.3905 R 2 = 0.7955 0 5 10 15 Plant City Rainfall (inches) 14 12 10 8 6 4 2 0 y = 1.0165x + 0.3539 R 2 = 0.8738 0 5 10 15 Lakeland Rainfall (inches) Lakeland Rainfall (inches) Comparison of March Rainfall Totals for Two Sites. Comparison of April Rainfall Totals for Two Sites. Plant City Rainfall (inches) 14 12 10 8 6 4 2 0 y = 1.0841x - 0.3243 R 2 = 0.8836 0 5 10 15 Plant City Rainfall (inches) 14 12 10 8 6 4 2 0 y = 0.8226x + 0.5804 R 2 = 0.6397 0 5 10 15 Lakeland Rainfall (inches) Lakeland Rainfall (inches) Comparison of May Rainfall Totals for Two Sites. Comparison of June Rainfall Totals for Two Sites. Plant City Rainfall (inches) 14 12 10 8 6 4 2 0 y = 0.7878x + 0.6467 R 2 = 0.7254 Plant City Rainfall (inches) 14 12 10 8 6 4 2 0 y = 0.7761x + 1.9562 R 2 = 0.4281 0 5 10 15 0 5 10 15 Lakeland Rainfall (inches) Lakeland Rainfall (inches) Figure 1. Comparison of total monthly rainfall between two NOAA rainfall sites (Lakeland and Plant City) for the period 1940 to 1999.
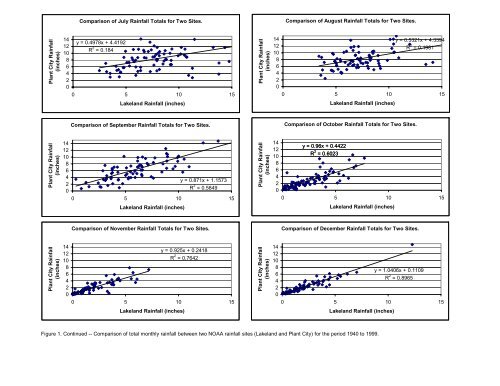
Comparison of July Rainfall Totals for Two Sites. Comparison of August Rainfall Totals for Two Sites. Plant City Rainfall (inches) 14 12 10 8 6 4 2 0 y = 0.4978x + 4.4192 R 2 = 0.184 0 5 10 15 Plant City Rainfall (inches) 14 12 10 8 6 4 2 0 y = 0.5321x + 4.3394 R 2 = 0.1981 0 5 10 15 Lakeland Rainfall (inches) Lakeland Rainfall (inches) Comparison of September Rainfall Totals for Two Sites. Comparison of October Rainfall Totals for Two Sites. Plant City Rainfall (inches) 14 12 10 8 6 4 2 0 y = 0.871x + 1.1573 R 2 = 0.5849 0 5 10 15 Plant City Rainfall (inches) 14 12 10 8 6 4 2 0 y = 0.96x + 0.4422 R 2 = 0.6023 0 5 10 15 Lakeland Rainfall (inches) Lakeland Rainfall (inches) Comparison of November Rainfall Totals for Two Sites. Comparison of December Rainfall Totals for Two Sites. Plant City Rainfall (inches) 14 12 10 8 6 4 2 0 y = 0.925x + 0.2418 R 2 = 0.7642 Plant City Rainfall (inches) 14 12 10 8 6 4 2 0 y = 1.0406x + 0.1109 R 2 = 0.8965 0 5 10 15 0 5 10 15 Lakeland Rainfall (inches) Lakeland Rainfall (inches) Figure 1. Continued -- Comparison of total monthly rainfall between two NOAA rainfall sites (Lakeland and Plant City) for the period 1940 to 1999.
- Page 181 and 182: A Review of “Alafia River Minimum
- Page 183 and 184: The draft report for setting MFLs f
- Page 185 and 186: methodologies, analyses, and conclu
- Page 187 and 188: The SWFWMD has employed a building
- Page 189 and 190: MFLs for the Alafia and Myakka rive
- Page 191 and 192: RALPH PLOTS AND ANALYSES Recent and
- Page 193 and 194: then used to estimate percent of fl
- Page 195 and 196: necessary. Such a framework should
- Page 197 and 198: to use to meet the criteria of no s
- Page 199 and 200: Shaw, D.T., C.N. Dahm, and S.W. Gol
- Page 201 and 202: The District has added to Chapter 4
- Page 207 and 208: Attachment A June 15 th , 2005 Mrs.
- Page 209 and 210: The Kelly (2004) report includes a
- Page 211 and 212: Figure 1. Box-and-whisker plots of
- Page 213 and 214: As shown in Table 1, a nonparametri
- Page 215 and 216: “augmentation” - be performed a
- Page 217 and 218: Estuary Program 'Restoring the Bala
- Page 219 and 220: APPENDIX D - District's response to
- Page 221 and 222: educed by no more than 8 percent on
- Page 223 and 224: sites with comparable temporal reco
- Page 225 and 226: gradually removed (this appears as
- Page 227 and 228: 1) The DISTRICT acknowledges the ma
- Page 229 and 230: Mark Hammond, Director, Resource Ma
- Page 231: Table 1. Mann-Whitney Statistical A
Comparison of July Rainfall Totals for Two Sites.<br />
Comparison of August Rainfall Totals for Two Sites.<br />
Plant City Rainfall<br />
(inches)<br />
14<br />
12<br />
10<br />
8<br />
6<br />
4<br />
2<br />
0<br />
y = 0.4978x + 4.4192<br />
R 2 = 0.184<br />
0 5 10 15<br />
Plant City Rainfall<br />
(inches)<br />
14<br />
12<br />
10<br />
8<br />
6<br />
4<br />
2<br />
0<br />
y = 0.5321x + 4.3394<br />
R 2 = 0.1981<br />
0 5 10 15<br />
Lakel<strong>and</strong> Rainfall (inches)<br />
Lakel<strong>and</strong> Rainfall (inches)<br />
Comparison of September Rainfall Totals for Two Sites.<br />
Comparison of October Rainfall Totals for Two Sites.<br />
Plant City Rainfall<br />
(inches)<br />
14<br />
12<br />
10<br />
8<br />
6<br />
4<br />
2<br />
0<br />
y = 0.871x + 1.1573<br />
R 2 = 0.5849<br />
0 5 10 15<br />
Plant City Rainfall<br />
(inches)<br />
14<br />
12<br />
10<br />
8<br />
6<br />
4<br />
2<br />
0<br />
y = 0.96x + 0.4422<br />
R 2 = 0.6023<br />
0 5 10 15<br />
Lakel<strong>and</strong> Rainfall (inches)<br />
Lakel<strong>and</strong> Rainfall (inches)<br />
Comparison of November Rainfall Totals for Two Sites.<br />
Comparison of December Rainfall Totals for Two Sites.<br />
Plant City Rainfall<br />
(inches)<br />
14<br />
12<br />
10<br />
8<br />
6<br />
4<br />
2<br />
0<br />
y = 0.925x + 0.2418<br />
R 2 = 0.7642<br />
Plant City Rainfall<br />
(inches)<br />
14<br />
12<br />
10<br />
8<br />
6<br />
4<br />
2<br />
0<br />
y = 1.0406x + 0.1109<br />
R 2 = 0.8965<br />
0 5 10 15<br />
0 5 10 15<br />
Lakel<strong>and</strong> Rainfall (inches)<br />
Lakel<strong>and</strong> Rainfall (inches)<br />
Figure<br />
1. Continued -- Comparison of total monthly rainfall between two NOAA rainfall sites (Lakel<strong>and</strong> <strong>and</strong> Plant City) for the period 1940 to 1999.


