The Determination of Minimum Flows for Sulphur Springs, Tampa
The Determination of Minimum Flows for Sulphur Springs, Tampa The Determination of Minimum Flows for Sulphur Springs, Tampa
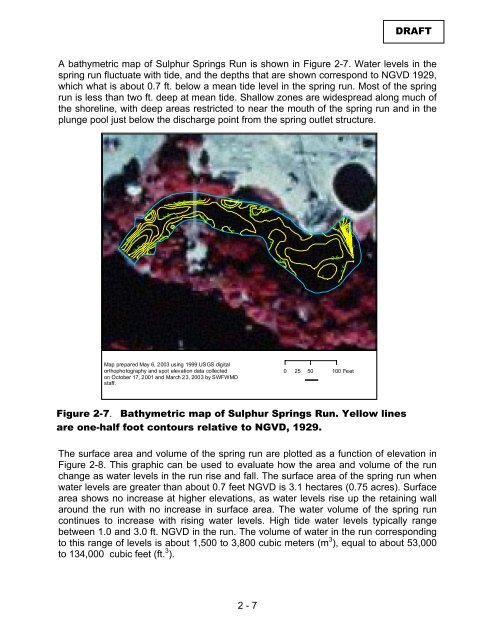
-4 -3 -2 DRAFT A bathymetric map of Sulphur Springs Run is shown in Figure 2-7. Water levels in the spring run fluctuate with tide, and the depths that are shown correspond to NGVD 1929, which what is about 0.7 ft. below a mean tide level in the spring run. Most of the spring run is less than two ft. deep at mean tide. Shallow zones are widespread along much of the shoreline, with deep areas restricted to near the mouth of the spring run and in the plunge pool just below the discharge point from the spring outlet structure. -0.5 -1.5 -0.5 -1 -1 0 -0.5 0 -0.5 -1 -0.5 0 -0.5 -2.5 0 -1.5 -1.5 -1.5 -1 -2 -2.5 -0.5 0 -0.5 -1 -1.5 -0.5 -1 -1 -0.5 Map prepared May 6, 2003 using 1999 USGS digital orthophotography and spot elevation data collected on October 17, 2001 and March 23, 2003 by SWFWMD staff. 0 25 50 100 Feet Figure 2-7. Bathymetric map of Sulphur Springs Run. Yellow lines are one-half foot contours relative to NGVD, 1929. ¯ The surface area and volume of the spring run are plotted as a function of elevation in Figure 2-8. This graphic can be used to evaluate how the area and volume of the run change as water levels in the run rise and fall. The surface area of the spring run when water levels are greater than about 0.7 feet NGVD is 3.1 hectares (0.75 acres). Surface area shows no increase at higher elevations, as water levels rise up the retaining wall around the run with no increase in surface area. The water volume of the spring run continues to increase with rising water levels. High tide water levels typically range between 1.0 and 3.0 ft. NGVD in the run. The volume of water in the run corresponding to this range of levels is about 1,500 to 3,800 cubic meters (m 3 ), equal to about 53,000 to 134,000 cubic feet (ft. 3 ). 2 - 7
DRAFT -5 -4 -3 -2 -1 0 1 2 3 0.4 4 Hectares Cubic Meters * 1,000 0.3 3 Area (hectares) 0.2 2 Volume (M 3 * 1,000) 0.1 1 0 SSRun_StgArea.grf -5 -4 -3 -2 -1 0 1 2 3 Water Level (Ft., NGVD 1929) 0 Figure 2-8. Surface area and volume of Sulphur Springs Run as a function of water level in the spring run. 2.3 Water Supply Use of Sulphur Springs In describing the hydrologic characteristics of Sulphur Springs, it is first helpful to understand how the spring is used for water supply. Since 1965, the City of Tampa has periodically diverted water from Sulphur Springs to the City's reservoir to augment water supplies. Waters are diverted from the spring pool through an intake pipe to a pump house that encloses a centrifugal pump that runs at a constant rate of 30.5 cubic ft per second (cfs) or 19.7 million gallons per day (mgd) when in operation. An underground pipe extends approximately two miles from this pump house to the western shore of the reservoir just upstream of the dam. The City's withdrawal rate of 19.7 mgd is rounded to a value of 20 mgd (31 cfs) for further discussion in this report. 2 - 8
- Page 1 and 2: The Determination of Minimum Flows
- Page 4 and 5: DRAFT TABLE OF CONTENTS List of Tab
- Page 6: 4.5 Goal 1 - Minimize the incursion
- Page 10 and 11: DRAFT LIST OF FIGURES Chapter 2 - P
- Page 12 and 13: Fig. 3-13 Fig. 3-14 Fig. 3-15 Fig.
- Page 14 and 15: Fig. 5-7 Fig. 5-8 Fig. 5-9 Fig. 5-1
- Page 16 and 17: Acronyms and Definitions DRAFT AMO
- Page 18 and 19: DRAFT Executive Summary The Southwe
- Page 20: DRAFT below 19 feet NGVD of 1929. T
- Page 24 and 25: CHAPTER 1 PURPOSE AND BACKGROUND OF
- Page 26 and 27: DRAFT water, or aquifer, provided t
- Page 28: DRAFT one the indicators were the f
- Page 31 and 32: DRAFT The spring and its run lie in
- Page 33 and 34: DRAFT Figure 2-3. Recent photograph
- Page 35: 2 - 6 DRAFT
- Page 39 and 40: DRAFT 10.0 Yrly_Pumpage.grf 15 Annu
- Page 41 and 42: DRAFT 1999 2000 2001 2002 2003 35 D
- Page 43 and 44: DRAFT Figure 2-14. Return flow stru
- Page 45 and 46: DRAFT 40 Jan. Feb. Mar. Apr. May Ju
- Page 47 and 48: DRAFT due to withdrawals for public
- Page 49 and 50: DRAFT Figure 2-19 . Temporal trend
- Page 51 and 52: DRAFT Figure 2-20. Temporal trends
- Page 53: DRAFT In comparison to specific con
- Page 57 and 58: DRAFT average daily withdrawals for
- Page 59 and 60: DRAFT Figure 2-25. Average specific
- Page 61 and 62: DRAFT withdrawal rate of 31 cfs dur
- Page 63 and 64: DRAFT Table 2-2. Sulphur Springs su
- Page 65 and 66: DRAFT These plots indicate that his
- Page 67 and 68: DRAFT CHAPTER 3 ECOLOGICAL RESOURCE
- Page 69 and 70: DRAFT 3 Run_Riv_Stg.grf Water Surfa
- Page 71 and 72: DRAFT 3.4 Salinity in the spring ru
- Page 73 and 74: DRAFT 1999 2000 2001 2002 2003 2004
- Page 75 and 76: DRAFT pumping events resulted in sa
- Page 77 and 78: DRAFT As discussed in Section 2.5.3
- Page 79 and 80: DRAFT tolerate and are frequently f
- Page 81 and 82: DRAFT Appendix B are color coded to
- Page 83 and 84: DRAFT habitat in the lower river pr
- Page 85 and 86: DRAFT The FWC using a modified stra
-4<br />
-3<br />
-2<br />
DRAFT<br />
A bathymetric map <strong>of</strong> <strong>Sulphur</strong> <strong>Springs</strong> Run is shown in Figure 2-7. Water levels in the<br />
spring run fluctuate with tide, and the depths that are shown correspond to NGVD 1929,<br />
which what is about 0.7 ft. below a mean tide level in the spring run. Most <strong>of</strong> the spring<br />
run is less than two ft. deep at mean tide. Shallow zones are widespread along much <strong>of</strong><br />
the shoreline, with deep areas restricted to near the mouth <strong>of</strong> the spring run and in the<br />
plunge pool just below the discharge point from the spring outlet structure.<br />
-0.5<br />
-1.5<br />
-0.5<br />
-1<br />
-1 0<br />
-0.5<br />
0<br />
-0.5<br />
-1<br />
-0.5<br />
0 -0.5<br />
-2.5<br />
0<br />
-1.5<br />
-1.5<br />
-1.5<br />
-1<br />
-2<br />
-2.5<br />
-0.5<br />
0<br />
-0.5<br />
-1<br />
-1.5<br />
-0.5<br />
-1<br />
-1<br />
-0.5<br />
Map prepared May 6, 2003 using 1999 USGS digital<br />
orthophotography and spot elevation data collected<br />
on October 17, 2001 and March 23, 2003 by SWFWMD<br />
staff.<br />
0 25 50 100 Feet<br />
Figure 2-7. Bathymetric map <strong>of</strong> <strong>Sulphur</strong> <strong>Springs</strong> Run. Yellow lines<br />
are one-half foot contours relative to NGVD, 1929.<br />
¯<br />
<strong>The</strong> surface area and volume <strong>of</strong> the spring run are plotted as a function <strong>of</strong> elevation in<br />
Figure 2-8. This graphic can be used to evaluate how the area and volume <strong>of</strong> the run<br />
change as water levels in the run rise and fall. <strong>The</strong> surface area <strong>of</strong> the spring run when<br />
water levels are greater than about 0.7 feet NGVD is 3.1 hectares (0.75 acres). Surface<br />
area shows no increase at higher elevations, as water levels rise up the retaining wall<br />
around the run with no increase in surface area. <strong>The</strong> water volume <strong>of</strong> the spring run<br />
continues to increase with rising water levels. High tide water levels typically range<br />
between 1.0 and 3.0 ft. NGVD in the run. <strong>The</strong> volume <strong>of</strong> water in the run corresponding<br />
to this range <strong>of</strong> levels is about 1,500 to 3,800 cubic meters (m 3 ), equal to about 53,000<br />
to 134,000 cubic feet (ft. 3 ).<br />
2 - 7


