Workforce Dashboard Narrative April 2012 Page 1 of 9 Workforce ...
Workforce Dashboard Narrative April 2012 Page 1 of 9 Workforce ...
Workforce Dashboard Narrative April 2012 Page 1 of 9 Workforce ...

Create successful ePaper yourself
Turn your PDF publications into a flip-book with our unique Google optimized e-Paper software.
<strong>Workforce</strong> <strong>Dashboard</strong> <strong>Narrative</strong> <strong>April</strong> <strong>2012</strong><br />
<strong>Page</strong> No: Sheet Name Component Key Figure(s)<br />
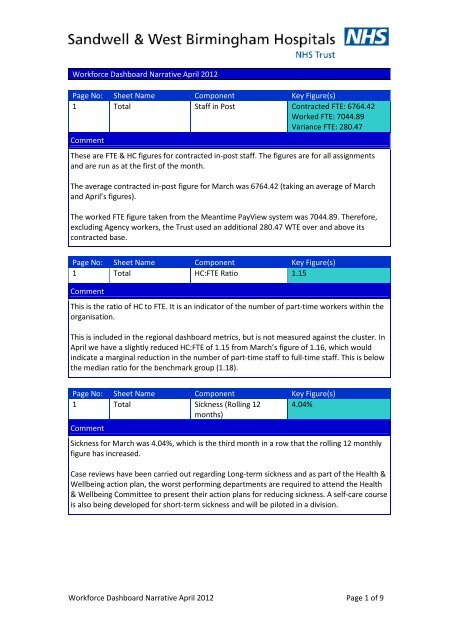
1 Total Staff in Post Contracted FTE: 6764.42<br />
Worked FTE: 7044.89<br />
Variance FTE: 280.47<br />
Comment<br />
These are FTE & HC figures for contracted in-post staff. The figures are for all assignments<br />
and are run as at the first <strong>of</strong> the month.<br />
The average contracted in-post figure for March was 6764.42 (taking an average <strong>of</strong> March<br />
and <strong>April</strong>’s figures).<br />
The worked FTE figure taken from the Meantime PayView system was 7044.89. Therefore,<br />
excluding Agency workers, the Trust used an additional 280.47 WTE over and above its<br />
contracted base.<br />
<strong>Page</strong> No: Sheet Name Component Key Figure(s)<br />
1 Total HC:FTE Ratio 1.15<br />
Comment<br />
This is the ratio <strong>of</strong> HC to FTE. It is an indicator <strong>of</strong> the number <strong>of</strong> part-time workers within the<br />
organisation.<br />
This is included in the regional dashboard metrics, but is not measured against the cluster. In<br />
<strong>April</strong> we have a slightly reduced HC:FTE <strong>of</strong> 1.15 from March’s figure <strong>of</strong> 1.16, which would<br />
indicate a marginal reduction in the number <strong>of</strong> part-time staff to full-time staff. This is below<br />
the median ratio for the benchmark group (1.18).<br />
<strong>Page</strong> No: Sheet Name Component Key Figure(s)<br />
1 Total Sickness (Rolling 12 4.04%<br />
months)<br />
Comment<br />
Sickness for March was 4.04%, which is the third month in a row that the rolling 12 monthly<br />
figure has increased.<br />
Case reviews have been carried out regarding Long-term sickness and as part <strong>of</strong> the Health &<br />
Wellbeing action plan, the worst performing departments are required to attend the Health<br />
& Wellbeing Committee to present their action plans for reducing sickness. A self-care course<br />
is also being developed for short-term sickness and will be piloted in a division.<br />
<strong>Workforce</strong> <strong>Dashboard</strong> <strong>Narrative</strong> <strong>April</strong> <strong>2012</strong> <strong>Page</strong> 1 <strong>of</strong> 9
<strong>Page</strong> No: Sheet Name Component Key Figure(s)<br />
1 Total Investigations (Live) 31<br />
Comment<br />
These are the number <strong>of</strong> live investigations going on within the month being reported.<br />
The HR team together with management representative conduct an ‘initial assessment <strong>of</strong><br />
facts’ prior to the initiation <strong>of</strong> a formal investigation. This is to determine if a formal<br />
investigation is in fact necessary.<br />
The progression <strong>of</strong> investigations is also reviewed centrally to determine any issues that<br />
prevent an early conclusion, the availability <strong>of</strong> appropriate representation, and<br />
administration support to compile management reports have been identified as contributing<br />
factors.<br />
The number <strong>of</strong> cases live or initiated in <strong>April</strong> went down to 31 from 38 in March.<br />
31 cases represents 0.4% <strong>of</strong> the workforce being investigated.<br />
<strong>Page</strong> No: Sheet Name Component Key Figure(s)<br />
1 Total Suspensions (on-going) 2<br />
Comment<br />
As with investigations, this figure highlights the number <strong>of</strong> suspensions that are ongoing<br />
within the month being reported.<br />
The number <strong>of</strong> ongoing suspensions has remained at 2 (although within different Divisions)<br />
for a number <strong>of</strong> months.<br />
<strong>Page</strong> No: Sheet Name Component Key Figure(s)<br />
1 Total Recruitment Admin Time 14 Weeks<br />
Comment<br />
This is the median recruitment time it takes to process the paperwork for getting an advert<br />
onto NHS Jobs to the point where a formal <strong>of</strong>fer is made to a prospective employee. The<br />
desired admin time is 9 weeks, taken from Recruitment Standards. The primary delays in the<br />
system are time taken for managers to distribute paperwork, time taken over shortlisting,<br />
and possible employment checks.<br />
The <strong>April</strong> average has reduced from 15 weeks in March to 14 weeks in <strong>April</strong>.<br />
<strong>Workforce</strong> <strong>Dashboard</strong> <strong>Narrative</strong> <strong>April</strong> <strong>2012</strong> <strong>Page</strong> 2 <strong>of</strong> 9
<strong>Page</strong> No: Sheet Name Component Key Figure(s)<br />
1 Total Variance (Establishment v<br />
actual)<br />
Establishment FTE (March<br />
<strong>2012</strong>): 7218.21<br />
Average March Contracted<br />
FTE: 6764.42<br />
Worked FTE (March<strong>2012</strong>):<br />
7044.89<br />
Comment<br />
This is the under/over establishment figure when you compare in-post numbers to the<br />
establishment figures, which are obtained from the finance department. This has been called<br />
variance, as at a top level it is not possible to identify vacancies, as many <strong>of</strong> the posts may be<br />
held for savings, or are being filled by bank etc.<br />
The latest establishment figures we have are for March <strong>2012</strong> (7218.21). Finance recognises a<br />
different organisational structure to ESR, so the establishment figures have been reconciled<br />
back to the ESR structure. The establishment v actual variance will match the bottom line<br />
figure (7218.21); however, this will not necessarily match at a divisional level, if compared to<br />
a finance report.<br />
The comparisons for <strong>April</strong> are:<br />
Establishment FTE (March <strong>2012</strong>): 7218.21<br />
Average March Contracted FTE: 6764.42<br />
Worked FTE (March<strong>2012</strong>): 7044.89<br />
Work will be carried out with the Transformation Office to identify which posts have been<br />
identified as part <strong>of</strong> the savings plan. It is the intention, over the next few months to be able<br />
to produce reports which detail actually vacancies.<br />
<strong>Page</strong> No: Sheet Name Component Key Figure(s)<br />
1 Total Posts (advertised in 39.06 FTE<br />
month)<br />
Comment<br />
These are the number <strong>of</strong> posts that are advertised within the recorded month as reported by<br />
NHS Jobs.<br />
<strong>April</strong> (39.06) was significantly lower that March (72.46).<br />
<strong>Page</strong> No: Sheet Name Component Key Figure(s)<br />
1 Total Pr<strong>of</strong> Reg Actual Lapses 2<br />
Comment<br />
These are the number <strong>of</strong> employees who are being investigated for actual lapses <strong>of</strong><br />
registration.<br />
The number <strong>of</strong> lapses in <strong>April</strong> was 2.<br />
Registrations are captured within ESR, and monthly reports are distributed detailing<br />
‘overdue’, and upcoming renewals.<br />
<strong>Workforce</strong> <strong>Dashboard</strong> <strong>Narrative</strong> <strong>April</strong> <strong>2012</strong> <strong>Page</strong> 3 <strong>of</strong> 9
<strong>Page</strong> No: Sheet Name Component Key Figure(s)<br />
1 Total PDRs 70.53%<br />
Comment<br />
The current PDR compliance target is 85%. The compliance figure for <strong>April</strong> (70.53%) is below<br />
target, however, it is an improvement on the March position.<br />
LIA events are in the process <strong>of</strong> being set-up to look at the current PDR process to see if it<br />
can be improved.<br />
PDRs remain a focus within Hot Topics. With the continued roll-out <strong>of</strong> Manager Self Service,<br />
more supervisors/managers are now able to update PDR dates directly via ESR, rather than<br />
have to submit a PDR5 via email.<br />
<strong>Page</strong> No: Sheet Name Component Key Figure(s)<br />
1 Total Leavers (Rolling 12 8.18%<br />
months)<br />
Comment<br />
This is a headcount and % figure. The % leavers figure is below our historical average <strong>of</strong><br />
around 10%. As yet no determination has been made as to what is a healthy/unhealthy<br />
leaving rate.<br />
Our leavers % (8.18) has increased very slightly from 8.15% in March, however, that<br />
percentage remains the 3 rd lowest compared to our benchmark group, with the median<br />
leaving rate being 8.72%.<br />
<strong>Page</strong> No: Sheet Name Component Key Figure(s)<br />
1 Total Mandatory Training 74.06%<br />
Compliance<br />
Comment<br />
These figures are taken from the CDA system. Following a decline in compliance from the<br />
start <strong>of</strong> the year, the overall figure rose slightly from 71.92% in March <strong>2012</strong> to 74.06% in <strong>April</strong><br />
<strong>2012</strong>. There are subject areas where compliance is well below target and there are still large<br />
numbers <strong>of</strong> staff who are 6 months or more out <strong>of</strong> date. Future bookings for the next few<br />
full mandatory training days are positive and there are dates available until 2013. Managers<br />
are urged to ensure their staff complete the necessary training within timescales and that<br />
people who have DNA’d are re-booked to attend. A number <strong>of</strong> new reports are available on<br />
the CDA system to enable managers to review compliance levels.<br />
Competence in the use <strong>of</strong> medical devices is still below target. Managers are asked to<br />
urgently review the central records and update them where required or ensure that staff are<br />
trained.<br />
<strong>Workforce</strong> <strong>Dashboard</strong> <strong>Narrative</strong> <strong>April</strong> <strong>2012</strong> <strong>Page</strong> 4 <strong>of</strong> 9
<strong>Page</strong> No: Sheet Name Component Key Figure(s)<br />
2. SIP & Sickness Staff in Post (Contracted) circa 13 FTE Increase<br />
Comment<br />
These are the SIP figures by Division. The colour formatting indicates whether, compared to<br />
the previous months figures, that:<br />
SIP is greater – red;<br />
the same – amber;<br />
lower – green.<br />
The median figure formatting indicates, based on the above criteria, whether it is higher,<br />
lower, or the same as the <strong>April</strong> figure.<br />
The SIP figure increased by circa 13 FTE from March <strong>2012</strong> to <strong>April</strong> <strong>2012</strong>.<br />
<strong>Page</strong> No: Sheet Name Component Key Figure(s)<br />
2. SIP & Sickness Sickness N/A<br />
Comment<br />
These are the rolling 12 month sickness figures by Division.<br />
Community Child Health is no longer reported separately, as they are part <strong>of</strong> Women & Child<br />
Health. The ‘Miscellaneous’ division are now included within the sickness reports.<br />
<strong>Page</strong> No: Sheet Name Component Key Figure(s)<br />
3. PDRs & Leavers Leavers N/A<br />
Comment<br />
These are the rolling 12 month figures by Division.<br />
<strong>Page</strong> No: Sheet Name Component Key Figure(s)<br />
4. Vacancies Vacancies advertised in N/A<br />
month<br />
Comment<br />
These are the number <strong>of</strong> vacancies advertised in each month by division.<br />
<strong>Page</strong> No: Sheet Name Component Key Figure(s)<br />
4. Vacancies Variance (Establishment v N/A<br />
Actual)<br />
Comment<br />
These are the establishment v actual variance figures broken down by division. A minus value<br />
indicates an over establishment. However, as noted above, this is simply the difference<br />
between the establishment and in-post figures. These will include posts being filled by bank,<br />
posts held as part <strong>of</strong> the TSPs, etc.<br />
<strong>Workforce</strong> <strong>Dashboard</strong> <strong>Narrative</strong> <strong>April</strong> <strong>2012</strong> <strong>Page</strong> 5 <strong>of</strong> 9
<strong>Page</strong> No: Sheet Name Component Key Figure(s)<br />
5. Pr<strong>of</strong> Reg & MT Pr<strong>of</strong> Reg (Actual Lapses) N/A<br />
Comment<br />
These are the number <strong>of</strong> actual lapses by division.<br />
<strong>Page</strong> No: Sheet Name Component Key Figure(s)<br />
5. Pr<strong>of</strong> Reg & MT Mandatory Training N/A<br />
Comment<br />
The monthly MT figures by Division.<br />
<strong>Page</strong> No: Sheet Name Component Key Figure(s)<br />
6. CIFP Investigations N/A<br />
Comment<br />
The current, live investigations (in-month) by division.<br />
<strong>Page</strong> No: Sheet Name Component Key Figure(s)<br />
6. CIFP Suspensions N/A<br />
Comment<br />
The current, live suspensions (in-month) by division.<br />
<strong>Page</strong> No: Sheet Name Component Key Figure(s)<br />
7. Diversity (SIP) N/A<br />
Comment<br />
The figures are presented as FTE & HC numbers in-month, taken at the same time as the SIP<br />
figures. The comparison column looks at the median values (expressed as a percentage),<br />
versus a reasonable comparator. For SIP, these are the local population figures, where<br />
available.<br />
Local population figures for disability & Sexual Orientation are not available.<br />
Gender – SWBH employs more female staff when compared to local population numbers.<br />
This is a well understood health sector bias.<br />
Religious Belief – It is difficult to draw conclusions from these figures as we have a significant<br />
number <strong>of</strong> staff who are recorded as ‘undefined’ or ‘do not wish to disclose’.<br />
<strong>Workforce</strong> <strong>Dashboard</strong> <strong>Narrative</strong> <strong>April</strong> <strong>2012</strong> <strong>Page</strong> 6 <strong>of</strong> 9
<strong>Page</strong> No: Sheet Name Component Key Figure(s)<br />
8. Diversity (Leavers) N/A<br />
Comment<br />
Trends do not suggest any untoward variances across the diversity strands.<br />
<strong>Page</strong> No: Sheet Name Component Key Figure(s)<br />
9. Diversity<br />
White Promotions: 70%<br />
(Promotions)<br />
White SIP: 60%<br />
Comment<br />
Promotions are broadly defined as an increase in grade when comparing one month with the<br />
next. This can include permanent changes <strong>of</strong> acting up.<br />
For the Ethnicity figures it would appear that White staff are being promoted more than<br />
other staff, when compared to the in-post percentages. A further piece <strong>of</strong> work has been<br />
done to drill-down further. Two areas were highlighted where White staff were being overpromoted<br />
by greater than 5%, when compared to other Ethnic Groups. These areas have<br />
been passed on to the relevant HR Manager to investigate further.<br />
<strong>Page</strong> No: Sheet Name Component Key Figure(s)<br />
10. Diversity<br />
N/A<br />
(Recruitment)<br />
Comment<br />
Comparison is difficult at this stage due to the high number <strong>of</strong> undisclosed staff across the<br />
protected areas. However, what is positive, is that the number <strong>of</strong> undisclosed staff has<br />
reduced significantly for those being recruited over the last 12 months. The recruitment<br />
department has worked hard to explain the reasons behind capturing this data at the<br />
recruitment stage.<br />
<strong>Page</strong> No: Sheet Name Component Key Figure(s)<br />
11. Diversity (PDR) N/A<br />
Comment<br />
PDR figures show a good correlation with SIP figures across the protected areas. PDRs are<br />
measured as to whether a member <strong>of</strong> staff has had a PDR/review within the last 12 months.<br />
Doctors in training have their reviews carried out by the deanery, therefore, ‘assumption’<br />
figures are put into ESR, to ensure that they are recorded.<br />
<strong>Workforce</strong> <strong>Dashboard</strong> <strong>Narrative</strong> <strong>April</strong> <strong>2012</strong> <strong>Page</strong> 7 <strong>of</strong> 9
<strong>Page</strong> No: Sheet Name Component Key Figure(s)<br />
12. Diversity (CIFP) N/A<br />
Comment<br />
Based on previous dashboards, we know that there has been concern regarding a<br />
disproportionate number <strong>of</strong> investigations being carried out on non-white staff. HR have<br />
investigated a number <strong>of</strong> the cases and the reasons for the investigation have been found to<br />
be valid.<br />
The Trust has raised the pr<strong>of</strong>ile <strong>of</strong> diversity with the HR team, prior to the acceptance <strong>of</strong> a<br />
case into a formal procedure.<br />
Diversity training is now included within the mandatory training programme.<br />
<strong>Page</strong> No: Sheet Name Component Key Figure(s)<br />
13. Occupational Health New Starter 100%<br />
Comment<br />
KPI showing percentage <strong>of</strong> new starters who are screened within 2 days (out <strong>of</strong> around 100<br />
received per month). The higher this figure the more quickly new staff can be vaccinated if<br />
required and start work.<br />
<strong>Page</strong> No: Sheet Name Component Key Figure(s)<br />
13. Occupational Health Sickness appts (OH 67%<br />
Consultant)<br />
Comment<br />
KPI showing percentage <strong>of</strong> appointments with an OH Consultant within 10 working days.<br />
Whilst this has dropped slightly this quarter this is due to reduced consultant clinics due to<br />
long term sickness and flexible leave, no junior doctor in post (so more work for consultants)<br />
plus an increase in demand for consultant appointments <strong>of</strong> 72% compared with 2011.<br />
Monitoring continues with discussions on new ways <strong>of</strong> working to ease the demand.<br />
<strong>Page</strong> No: Sheet Name Component Key Figure(s)<br />
13. Occupational Health Sickness appts (OH Non- 100%<br />
Consultant)<br />
Comment<br />
KPI showing percentage <strong>of</strong> appointments with a Non-OH Consultant within 10 working days.<br />
This is n/a as there were no junior doctors in post in this quarter (due to recommence in <strong>April</strong><br />
<strong>2012</strong>)<br />
<strong>Workforce</strong> <strong>Dashboard</strong> <strong>Narrative</strong> <strong>April</strong> <strong>2012</strong> <strong>Page</strong> 8 <strong>of</strong> 9
<strong>Page</strong> No: Sheet Name Component Key Figure(s)<br />
13. Occupational Health Sickness appts<br />
(Specialist/Qualified<br />
Nurse)<br />
91%<br />
Comment<br />
KPI showing percentage <strong>of</strong> appointments with a specialist/Qualified Nurse within 10 working<br />
days. There is a dip in February explained by an unfortunate cluster <strong>of</strong> serious unrelated<br />
sickness absence among the OH specialist nurses and a 70% increase in referrals in the<br />
quarter.<br />
<strong>Page</strong> No: Sheet Name Component Key Figure(s)<br />
13. Occupational Health Reports to managers 99%<br />
Comment<br />
KPI showing percentage <strong>of</strong> reports to managers within 5 days (upon receipt <strong>of</strong> consent). The<br />
higher this figure the more quickly managers receive outcome information from<br />
appointments, allowing them to make management decisions in sickness absence cases.<br />
Time taken should decrease further with the planned electronic system.<br />
<strong>Page</strong> No: Sheet Name Component Key Figure(s)<br />
13. Occupational Health General Immunisation 87%<br />
Clinics<br />
Comment<br />
KPI showing percentage <strong>of</strong> clinic appointments for immunisations completed within 10 days<br />
<strong>of</strong> request. The aim for this KPI is about 90% as some immunisations have to be booked in<br />
advance as they are part <strong>of</strong> a course.<br />
<strong>Page</strong> No: Sheet Name Component Key Figure(s)<br />
13. Occupational Health Sickness Wasted Hours & 11.92 FTE<br />
Cost<br />
£697.00<br />
Comment<br />
This is sent to DGM’s showing the wasted time per month from people not attending and<br />
cost associated with non attendance (based on how much we would charge an external<br />
customer) The result is intended to be a guide to stimulate management action. While the<br />
costs have remained the same over six months this represents a drop in real terms because<br />
<strong>of</strong> the increase in appointments. IT developments should allow us to send reminders soon<br />
and only one DNA is permitted for a consultant clinic, this policy is likely to be extended to<br />
nurse sickness absence clinics.<br />
<strong>Page</strong> No: Sheet Name Component Key Figure(s)<br />
13. Occupational Health General Clinics Wasted 18.73 FTE<br />
Hours & Cost<br />
£319.00<br />
Comment<br />
As above but for General Clinics.<br />
<strong>Workforce</strong> <strong>Dashboard</strong> <strong>Narrative</strong> <strong>April</strong> <strong>2012</strong> <strong>Page</strong> 9 <strong>of</strong> 9