1 Overview 2 Details of the Model Construction - Canada France ...
1 Overview 2 Details of the Model Construction - Canada France ...
1 Overview 2 Details of the Model Construction - Canada France ...

You also want an ePaper? Increase the reach of your titles
YUMPU automatically turns print PDFs into web optimized ePapers that Google loves.
Note: at <strong>the</strong> expected operating wind speed <strong>of</strong> > 100 mph during our tests, smoke for flow visualization<br />
is ineffective.<br />
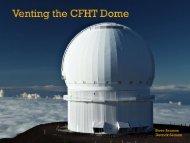
11.3 Tests performed<br />
In <strong>the</strong> half day available for testing we ran two classes <strong>of</strong> tests, mechanical integrity and flow<br />
visualization. The model was mounted on <strong>the</strong> wooden trapdoor without any terrain in order to keep <strong>the</strong><br />
blockage factor well below <strong>the</strong> 10% advised. We used only <strong>the</strong> unvented dome for all <strong>the</strong> tests. The<br />
wind speed was maintained at 140 mph, which translates to Re ~ 10 6 using <strong>the</strong> diameter <strong>of</strong> <strong>the</strong> model<br />
dome as <strong>the</strong> characteristic length. Compared to <strong>the</strong> Re in <strong>the</strong> water tunnel, this is more representative<br />
<strong>of</strong> <strong>the</strong> Reynolds numbers, ~10 7 , expected in <strong>the</strong> flow around <strong>the</strong> telescope facility on Mauna Kea..<br />
11.3.1 Mechanical integrity <strong>of</strong> <strong>the</strong> model<br />
Our main objective was to test <strong>the</strong> mechanical integrity <strong>of</strong> <strong>the</strong> model used in <strong>the</strong> water tunnel tests<br />
when exposed to wind speeds <strong>of</strong> 140 mph. With this information, we aimed to assess whe<strong>the</strong>r we could<br />
carry out <strong>the</strong> wind tunnel tests using a similar model in this 36” wind tunnel facility, which is rarely<br />
used and is available for <strong>the</strong> asking. This is unlike <strong>the</strong> Kirsten wind tunnel, which we were told was<br />
booked completely for <strong>the</strong> next few months till August 2011.<br />
The unvented dome was oriented such that <strong>the</strong> slit was at 15° to <strong>the</strong> wind direction (dome azimuth <strong>of</strong><br />
105°). This is <strong>the</strong> angle at which we had observed <strong>the</strong> minimum flushing times in <strong>the</strong> water tunnel tests.<br />
The wind speed was gradually increased to <strong>the</strong> maximum <strong>of</strong> 140mph, and was sustained at this value<br />
for a considerable time (~20min). During this period, <strong>the</strong> dome orientation was changed using <strong>the</strong><br />
thumb-wheel, in order to expose <strong>the</strong> dome to <strong>the</strong> full range <strong>of</strong> forces.<br />
The dome stood up to <strong>the</strong> wind speed without any obvious distress, except for a loud whistling noise<br />
due to <strong>the</strong> wind entering <strong>the</strong> slit at certain angles. Given this very encouraging success with Tom and<br />
Marc’s fabricated model, it is quite feasible to carry out <strong>the</strong> wind tunnel tests using a similar model.<br />
11.3.2 Flow visualization with tufts<br />
The aim here was to use “tufts” to visualize <strong>the</strong> flow both outside <strong>the</strong> telescope building and inside <strong>the</strong><br />
dome, and thus benchmark <strong>the</strong> patterns we had observed during <strong>the</strong> water tunnel tests. Tufts are small<br />
pieces <strong>of</strong> yarn, each ~ 1/2” to 1” long, fixed at regular intervals on <strong>the</strong> test surface, e.g. on <strong>the</strong> dome<br />
skin using scotch tape, as in Figure 22 (left). (see Appendix 1).<br />
For <strong>the</strong> initial tests, <strong>the</strong> tufts were affixed horizontally at equal intervals along <strong>the</strong> dome, as well as on<br />
<strong>the</strong> building at approximately <strong>the</strong> height at which we had seen <strong>the</strong> top <strong>of</strong> <strong>the</strong> Horseshoe vortex in <strong>the</strong><br />
water tunnel test. In addition, we laid a few rows <strong>of</strong> tufts behind <strong>the</strong> building in order to visualize <strong>the</strong><br />
eddy and backwash also observed in <strong>the</strong> water tunnel. Two video cameras recorded <strong>the</strong> trials, one<br />
filming from <strong>the</strong> North, and <strong>the</strong> o<strong>the</strong>r from <strong>the</strong> top looking down on <strong>the</strong> model; <strong>the</strong> directory structure<br />
given at <strong>the</strong> end <strong>of</strong> <strong>the</strong> document lists <strong>the</strong> names <strong>of</strong> <strong>the</strong> video clips corresponding to <strong>the</strong>se tests.<br />
In addition to <strong>the</strong>se fixed tufts, we also fixed two long tufts on a hand-held metal probe which we<br />
introduced into <strong>the</strong> flow through <strong>the</strong> hole in <strong>the</strong> movable poly<strong>the</strong>ne sheet or from an entry hole on top<br />
<strong>of</strong> <strong>the</strong> test section (seen in Figure 21). The tufted probe was moved methodically from side to side in<br />
<strong>the</strong> flow as well as in <strong>the</strong> vertical direction in order to scan <strong>the</strong> flow pattern on <strong>the</strong> upwind side <strong>of</strong> <strong>the</strong><br />
dome thoroughly.<br />
For <strong>the</strong> initial tests, <strong>the</strong> tufts were affixed horizontally at equal intervals along <strong>the</strong> dome, as well<br />
as on <strong>the</strong> building at approximately <strong>the</strong> height at which we had seen <strong>the</strong> top <strong>of</strong> <strong>the</strong> Horseshoe
![Documentation [PDF] - Canada France Hawaii Telescope ...](https://img.yumpu.com/26965302/1/190x245/documentation-pdf-canada-france-hawaii-telescope-.jpg?quality=85)