

N2O production in a single stage nitritation/anammox MBBR process
N2O production in a single stage nitritation/anammox MBBR process
N2O production in a single stage nitritation/anammox MBBR process

Create successful ePaper yourself
Turn your PDF publications into a flip-book with our unique Google optimized e-Paper software.
10<br />
8<br />
DO concentration, pH & temperature<br />
35<br />
28<br />
DO (mg/l), pH<br />
6<br />
4<br />
21<br />
14<br />
Temp °C<br />
DO (mg/l)<br />
pH<br />
Temperature (°C)<br />
2<br />
7<br />
0<br />
0<br />
14/09/09<br />
19/09/09<br />
24/09/09<br />
29/09/09<br />
Date<br />
04/10/09<br />
09/10/09<br />
14/10/09<br />
19/10/09<br />
350<br />
Concentrations of <strong>in</strong>fluent and effluent total <strong>in</strong>organic nitrogen<br />
Total <strong>in</strong>organic nitrogen (mg/l)<br />
300<br />
250<br />
200<br />
150<br />
100<br />
50<br />
0<br />
Σ TIN <strong>in</strong> (mg/l)<br />
Σ TIN out (mg/l)<br />
14/09/09<br />
19/09/09<br />
24/09/09<br />
29/09/09<br />
Date<br />
04/10/09<br />
09/10/09<br />
14/10/09<br />
19/10/09<br />
Removal rate (gN/m²d)<br />
1.6<br />
1.4<br />
1.2<br />
1.0<br />
0.8<br />
0.6<br />
0.4<br />
0.2<br />
0.0<br />
Removal rate (gN/m²d) & % reduction of <strong>in</strong>comm<strong>in</strong>g nitrogen<br />
90<br />
80<br />
70<br />
60<br />
50<br />
40<br />
30<br />
20<br />
10<br />
0<br />
% reduction<br />
Removal rate<br />
(gN/m2d)<br />
% reduction<br />
14/09/09<br />
19/09/09<br />
24/09/09<br />
29/09/09<br />
Date<br />
04/10/09<br />
09/10/09<br />
14/10/09<br />
19/10/09<br />
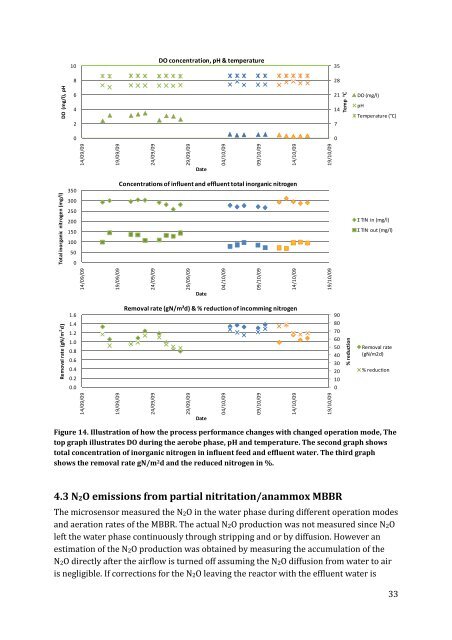
Figure 14. Illustration of how the <strong>process</strong> performance changes with changed operation mode, The<br />
top graph illustrates DO dur<strong>in</strong>g the aerobe phase, pH and temperature. The second graph shows<br />
total concentration of <strong>in</strong>organic nitrogen <strong>in</strong> <strong>in</strong>fluent feed and effluent water. The third graph<br />
shows the removal rate gN/m 2 d and the reduced nitrogen <strong>in</strong> %.<br />
4.3 <strong>N2O</strong> emissions from partial <strong>nitritation</strong>/<strong>anammox</strong> <strong>MBBR</strong><br />
The microsensor measured the <strong>N2O</strong> <strong>in</strong> the water phase dur<strong>in</strong>g different operation modes<br />
and aeration rates of the <strong>MBBR</strong>. The actual <strong>N2O</strong> <strong>production</strong> was not measured s<strong>in</strong>ce <strong>N2O</strong><br />
left the water phase cont<strong>in</strong>uously through stripp<strong>in</strong>g and or by diffusion. However an<br />
estimation of the <strong>N2O</strong> <strong>production</strong> was obta<strong>in</strong>ed by measur<strong>in</strong>g the accumulation of the<br />
<strong>N2O</strong> directly after the airflow is turned off assum<strong>in</strong>g the <strong>N2O</strong> diffusion from water to air<br />
is negligible. If corrections for the <strong>N2O</strong> leav<strong>in</strong>g the reactor with the effluent water is<br />
33


