Suriname, Trinidad & Tobago, Turks & Caicos, US Virgin Islands ...
Suriname, Trinidad & Tobago, Turks & Caicos, US Virgin Islands ...
Suriname, Trinidad & Tobago, Turks & Caicos, US Virgin Islands ...

You also want an ePaper? Increase the reach of your titles
YUMPU automatically turns print PDFs into web optimized ePapers that Google loves.
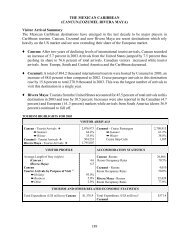
TRINIDAD AND TOBAGO<br />
Visitor Arrival Summary<br />
Full year Tourist arrivals to <strong>Trinidad</strong> and <strong>Tobago</strong> were unavailable for 2010. Reported<br />
numbers up to November 2009 show a 5.5 percent decline, with the Winter down by 7.7 percent and<br />
the Summer down by 4.0 percent. The total for the January to November period was reported at<br />
371.9 thousand as compared with 393.4 thousand for the similar period in 2008.<br />
<br />
<br />
The American market which accounted for 45.8 percent of total arrivals showed a marginal<br />
increase of 1.2 percent during the January to November ,2009 period. Arrivals from all other<br />
major source markets declined. The Caribbean, while remaining an important source market<br />
(20.0 percent of the whole), fell away sharply by 16.3 percent, ending at 74.5 thousand<br />
tourists . The Canadian market, 11.4 percent of all stay-over arrivals, fell off by 11.3 percent,<br />
while tourists from the European countries(14.5 percent market share) shrank by 5.4 percent.<br />
This was the fourth consecutive year of dropping levels of tourist arrivals from the Caribbean<br />
and European markets.<br />
The Cruise industry recorded a slump in 2010. An estimated 101.8 thousand Cruise<br />
Passengers arrived, a reduction of 14.9 percent, with 70.4 thousand arriving in the Winter<br />
and 29.6 thousand arriving in the Summer.<br />
TOURISM HIGHLIGHTS FOR 2010<br />
VISITOR ARRIVALS<br />
Tourist Arrivals I Jan-Nov<br />
Summer<br />
Winter<br />
<br />
371,889<br />
61.5%<br />
38.5%<br />
Cruise Passengers<br />
Summer<br />
Winter<br />
101,798<br />
29.6%<br />
70.4%<br />
VISITOR PROFILE<br />
Tourist Arrivals by Purpose of Visit II<br />
Holiday<br />
Business<br />
Other<br />
62.7%<br />
19.1%<br />
18.2%<br />
Tourist Arrivals by Place of Stay I<br />
Hotels<br />
Apartment/Guest Houses<br />
Private<br />
Other<br />
17.5%<br />
4.6%<br />
57.4%<br />
20.5%<br />
TOURISM AND OTHER RELATED ECONOMIC STATISTICS<br />
Total Expenditure (<strong>US</strong>$ millions) I<br />
Tourism Budget (<strong>US</strong>$ thousands) X $366.6<br />
$4,117<br />
ACCOMMODATION STATISTICS<br />
Rooms II *<br />
5,796<br />
Room Occupancy Rates III 52.0%<br />
GDP at Factor Cost (<strong>US</strong>$ millions) VI<br />
Consumer Price Index (% ch. 2010/’09)<br />
SOCIO-ECONOMIC STATISTICS<br />
Land Area (square Kilometres)<br />
Population (thousand mid year 2010)<br />
$11,463.8<br />
9.9%<br />
5,128<br />
1,317.7<br />
* estimate<br />
122