Suriname, Trinidad & Tobago, Turks & Caicos, US Virgin Islands ...
Suriname, Trinidad & Tobago, Turks & Caicos, US Virgin Islands ...
Suriname, Trinidad & Tobago, Turks & Caicos, US Virgin Islands ...

Create successful ePaper yourself
Turn your PDF publications into a flip-book with our unique Google optimized e-Paper software.
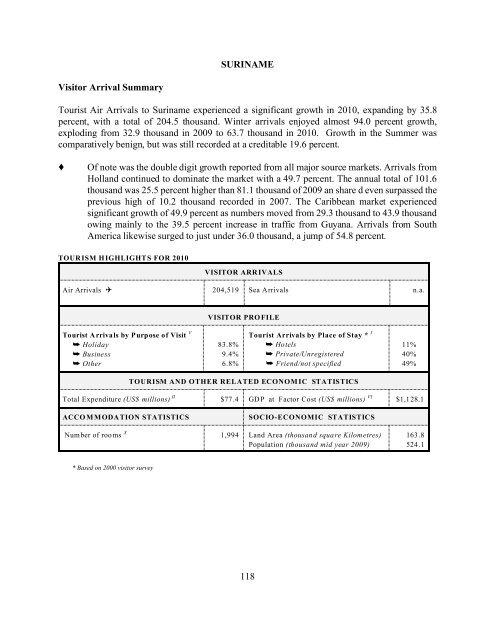
SURINAME<br />
Visitor Arrival Summary<br />
Tourist Air Arrivals to <strong>Suriname</strong> experienced a significant growth in 2010, expanding by 35.8<br />
percent, with a total of 204.5 thousand. Winter arrivals enjoyed almost 94.0 percent growth,<br />
exploding from 32.9 thousand in 2009 to 63.7 thousand in 2010. Growth in the Summer was<br />
comparatively benign, but was still recorded at a creditable 19.6 percent.<br />
<br />
Of note was the double digit growth reported from all major source markets. Arrivals from<br />
Holland continued to dominate the market with a 49.7 percent. The annual total of 101.6<br />
thousand was 25.5 percent higher than 81.1 thousand of 2009 an share d even surpassed the<br />
previous high of 10.2 thousand recorded in 2007. The Caribbean market experienced<br />
significant growth of 49.9 percent as numbers moved from 29.3 thousand to 43.9 thousand<br />
owing mainly to the 39.5 percent increase in traffic from Guyana. Arrivals from South<br />
America likewise surged to just under 36.0 thousand, a jump of 54.8 percent.<br />
TOURISM HIGHLIGHTS FOR 2010<br />
VISITOR ARRIVALS<br />
Air Arrivals 204,519 Sea Arrivals n.a.<br />
VISITOR PROFILE<br />
Tourist Arrivals by Purpose of Visit V<br />
Holiday<br />
Business<br />
Other<br />
83.8%<br />
9.4%<br />
6.8%<br />
Tourist Arrivals by Place of Stay * I<br />
Hotels<br />
Private/Unregistered<br />
Friend/not specified<br />
11%<br />
40%<br />
49%<br />
TOURISM AND OTHER RELATED ECONOMIC STATISTICS<br />
Total Expenditure (<strong>US</strong>$ millions) II $77.4 GDP at Factor Cost (<strong>US</strong>$ millions) VI $1,128.1<br />
ACCOMMODATION STATISTICS<br />
SOCIO-ECONOMIC STATISTICS<br />
Number of rooms X 1,994 Land Area (thousand square Kilometres)<br />
Population (thousand mid year 2009)<br />
163.8<br />
524.1<br />
* Based on 2000 visitor survey<br />
118
119
SURINAME<br />
VISITOR ARRIVALS BY CATEGORY<br />
Category 2003 n 2004 2005 2006 2007<br />
% Share<br />
2007<br />
Air Arrivals n.a n.a n.a n.a n.a n.a<br />
Sea Arrivals * n.a n.a n.a n.a n.a n.a<br />
Total n.a ** 96019 188622 n.a n.a n.a<br />
n<br />
New series<br />
* Arrivals at Nieuw Nickerie Harbour<br />
** June - Dec only<br />
TOURIST AIR ARRIVALS BY NATIONALITY<br />
% Share<br />
Country of Residence 2006 2007 2008 2009 2010 2010<br />
United States 3411 4573 4973 4964 6600 3.2<br />
Canada n.a 1226 1193 1320 1720 0.8<br />
Holland 91912 101222 88380 81117 101578 49.7<br />
Other Europe 6380 6912 6919 6700 8677 4.2<br />
South America 22362 21683 22441 23244 35993 17.6<br />
Caribbean 22854 22922 22316 29285 43901 21.5<br />
Rest of W orld 5976 3971 4489 3998 6050 3.0<br />
TOTAL 152895 162509 150711 150628 204519 100.0<br />
120
MONTHLY AIR ARRIVALS*<br />
Month<br />
SURINAME<br />
% Change<br />
2006 2007 2008 2009 2010 2009/08<br />
January 10056 9948 12309 8173 14773 80.8<br />
February 12812 14172 11916 8300 16323 96.7<br />
March 12019 11966 8947 7393 16308 120.6<br />
April 13582 14976 14832 8987 16302 81.4<br />
May 9520 11652 11576 6397 14482 126.4<br />
June 10888 12324 13104 12007 12586 4.8<br />
July 18035 22207 19452 20023 23949 19.6<br />
August 16601 13050 16081 17532 20373 16.2<br />
September 9089 9765 6794 10641 13737 29.1<br />
October 10143 15145 10265 15262 17175 12.5<br />
November 11991 12758 10808 14237 15848 11.3<br />
December 18159 14546 14627 21444 22663 5.7<br />
TOTAL 152895 162509 150711 150396 204519 36.0<br />
TOURIST ACCOMMODATION (Rooms)<br />
Type of Accommodation 2002 2003 2004 2005<br />
Hotels n.a n.a n.a 678<br />
Guest Houses n.a n.a n.a n.a<br />
Other n.a n.a n.a 1316<br />
TOTAL n.a n.a n.a 1994<br />
Source: <strong>Suriname</strong> Tourism Foundation<br />
121
TRINIDAD AND TOBAGO<br />
Visitor Arrival Summary<br />
Full year Tourist arrivals to <strong>Trinidad</strong> and <strong>Tobago</strong> were unavailable for 2010. Reported<br />
numbers up to November 2009 show a 5.5 percent decline, with the Winter down by 7.7 percent and<br />
the Summer down by 4.0 percent. The total for the January to November period was reported at<br />
371.9 thousand as compared with 393.4 thousand for the similar period in 2008.<br />
<br />
<br />
The American market which accounted for 45.8 percent of total arrivals showed a marginal<br />
increase of 1.2 percent during the January to November ,2009 period. Arrivals from all other<br />
major source markets declined. The Caribbean, while remaining an important source market<br />
(20.0 percent of the whole), fell away sharply by 16.3 percent, ending at 74.5 thousand<br />
tourists . The Canadian market, 11.4 percent of all stay-over arrivals, fell off by 11.3 percent,<br />
while tourists from the European countries(14.5 percent market share) shrank by 5.4 percent.<br />
This was the fourth consecutive year of dropping levels of tourist arrivals from the Caribbean<br />
and European markets.<br />
The Cruise industry recorded a slump in 2010. An estimated 101.8 thousand Cruise<br />
Passengers arrived, a reduction of 14.9 percent, with 70.4 thousand arriving in the Winter<br />
and 29.6 thousand arriving in the Summer.<br />
TOURISM HIGHLIGHTS FOR 2010<br />
VISITOR ARRIVALS<br />
Tourist Arrivals I Jan-Nov<br />
Summer<br />
Winter<br />
<br />
371,889<br />
61.5%<br />
38.5%<br />
Cruise Passengers<br />
Summer<br />
Winter<br />
101,798<br />
29.6%<br />
70.4%<br />
VISITOR PROFILE<br />
Tourist Arrivals by Purpose of Visit II<br />
Holiday<br />
Business<br />
Other<br />
62.7%<br />
19.1%<br />
18.2%<br />
Tourist Arrivals by Place of Stay I<br />
Hotels<br />
Apartment/Guest Houses<br />
Private<br />
Other<br />
17.5%<br />
4.6%<br />
57.4%<br />
20.5%<br />
TOURISM AND OTHER RELATED ECONOMIC STATISTICS<br />
Total Expenditure (<strong>US</strong>$ millions) I<br />
Tourism Budget (<strong>US</strong>$ thousands) X $366.6<br />
$4,117<br />
ACCOMMODATION STATISTICS<br />
Rooms II *<br />
5,796<br />
Room Occupancy Rates III 52.0%<br />
GDP at Factor Cost (<strong>US</strong>$ millions) VI<br />
Consumer Price Index (% ch. 2010/’09)<br />
SOCIO-ECONOMIC STATISTICS<br />
Land Area (square Kilometres)<br />
Population (thousand mid year 2010)<br />
$11,463.8<br />
9.9%<br />
5,128<br />
1,317.7<br />
* estimate<br />
122
123
TRINIDAD AND TOBAGO<br />
TOURIST ARRIVALS BY COUNTRY OF RESIDENCE<br />
% Share<br />
Country of Residence 2005 2006 2007 2008 2009 Jan-Nov 2009<br />
United States 167985 170893 180557 187515 170204 45.8<br />
Canada 47702 49242 51411 53647 42537 11.4<br />
United Kingdom 63523 58612 58660 43051 36064 9.7<br />
Other Europe 27913 25647 23851 20138 17881 4.8<br />
South America 14907 15231 17380 18005 16637 4.5<br />
Guyana 22208 23673 25668 24696 18730 5.0<br />
Barbados 35319 31218 21491 19130 13165 3.5<br />
Other Caribbean 73689 71193 56458 52785 42655 11.5<br />
Rest of World 9945 11725 13977 13584 14016 3.8<br />
TOTAL 463191 457434 449453 432551 371889 100.0<br />
MONTHLY TOURIST ARRIVALS<br />
% Change<br />
Month 2005 2006 2007 2008 2009 2009/08<br />
January 44503 31481 33881 44949 30620 -31.9<br />
February 45294 54302 47373 34525 46085 33.5<br />
March 43498 35670 34862 39499 32005 -19.0<br />
April 36023 39610 36063 36388 34641 -4.8<br />
May 35194 37779 34487 36044 32048 -11.1<br />
June 33539 33948 35298 30002 33126 10.4<br />
July 45307 45372 42524 47948 43450 -9.4<br />
August 39802 41457 38791 36414 35112 -3.6<br />
September 28287 26260 29140 26900 25442 -5.4<br />
October 31517 31421 31994 30980 29562 -4.6<br />
November 33372 31220 36190 29772 29798 0.1<br />
December 46855 48914 48850 39130 n.a -<br />
TOTAL 463191 457434 449453 432551 371889 -<br />
124
TRINIDAD AND TOBAGO<br />
CRUISE PASSENGER ARRIVALS<br />
% Change<br />
Month 2006 2007 2008 2009 2010 2010/09<br />
January 19684 21789 7984 25335 17007 -32.9<br />
February 18791 13661 6239 16550 20783 25.6<br />
March 13852 16122 7658 28245 25249 -10.6<br />
April 10570 7112 1787 12576 8633 -31.4<br />
May 0 0 0 1007 130 -<br />
June 0 0 0 0 468 -<br />
July 0 0 0 0 0 -<br />
August 0 0 0 0 0 -<br />
September 0 0 4442 0 0 -<br />
October 182 0 698 632 170 -<br />
November 10564 5964 3299 8659 11378 31.4<br />
December 12216 12093 16559 26596 17980 -32.4<br />
TOTAL 85859 76741 48666 119600 101798 -14.9<br />
Num ber of Calls 94 86 65 29 37<br />
TOURIST ACCOMMODATION BY AREA (Rooms)<br />
Area 2003 2004 2005 2006 2007<br />
<strong>Trinidad</strong> 2528 n.a n.a n.a n.a<br />
<strong>Tobago</strong> 3415 n.a n.a n.a n.a<br />
TOTAL 5943 n.a n.a n.a n.a<br />
By Type of Accommodation (<strong>Trinidad</strong> & <strong>Tobago</strong>)<br />
Type of Accommodation 2004 2005 2006 2007 2008<br />
Hotels n.a n.a 3498 3300 3728<br />
Condos n.a n.a 771 - -<br />
Guest Houses n.a n.a 1779 994 994<br />
Other n.a n.a - 1074 1074<br />
TOTAL n.a n.a 6048 5368 5796<br />
Sources: Tourism Development Authority; Central Statistical Office<br />
125
TURKS AND CAICOS ISLANDS<br />
Data for the <strong>Turks</strong> and <strong>Caicos</strong> <strong>Islands</strong> for 2010 was unavailable.<br />
TOURISM HIGHLIGHTS FOR 2009<br />
VISITOR ARRIVALS<br />
264,887<br />
Tourist Arrivals II <br />
Winter * V 38.8%<br />
Summer * V<br />
61.2%<br />
Cruise Passenger Arrivals<br />
No Cruise<br />
VISITOR PROFILE<br />
Average Length of Stay (nights) III<br />
Tourist Arrivals by Purpose of Visit VI<br />
Holiday<br />
Business<br />
Other<br />
7.0<br />
55.4%<br />
36.0%<br />
8.6%<br />
Tourist Arrivals by Place of Stay VI<br />
Hotels<br />
Guest Houses/Apartments<br />
Private<br />
Other<br />
62.2%<br />
0.6%<br />
8.7%<br />
28.5%<br />
TOURISM AND OTHER RELATED ECONOMIC STATISTICS<br />
Total Expenditure (<strong>US</strong>$ millions) V $304.0 Tourism Budget (<strong>US</strong>$ thousands) V b $2,316<br />
ACCOMMODATION STATISTICS<br />
Rooms II<br />
Room Occupancy Rate II 2,632<br />
64.0%<br />
* Based on visitor arrivals<br />
SOCIO-ECONOMIC STATISTICS<br />
Land Area (square kilometers)<br />
Population (thousand mid year 2007)<br />
417<br />
34.9<br />
126
127
TURKS AND CAICOS ISLANDS<br />
TOURIST ARRIVALS<br />
% Share<br />
Country 2003 2004 2005 2006 2007 2007<br />
United States 128990 120645 123346 169662 n.a -<br />
Canada 14689 19793 21136 29802 n.a -<br />
United Kingdom 7266<br />
n.a -<br />
13807<br />
Other Europe 3801 17613 24834 n.a -<br />
Rest of World 9354 18836 14035 24045 n.a -<br />
TOTAL 164100 173081 176130 248343 264887 100.0<br />
MONTHLY TOURIST ARRIVALS<br />
% Change<br />
Month 2003 * 2004 2005 2006 2007 2007/06<br />
January 13394 15000 n.a n.a n.a -<br />
February 15452 16494 n.a n.a n.a -<br />
March 19843 18250 n.a n.a n.a -<br />
April 15861 17469 n.a n.a n.a -<br />
May 12568 15003 n.a n.a n.a -<br />
June 13042 14095 n.a n.a n.a -<br />
July 14497 13861 n.a n.a n.a -<br />
August 14171 18940 n.a n.a n.a -<br />
September 5950 4552 n.a n.a n.a -<br />
October 9767 13157 n.a n.a n.a -<br />
November 14808 13014 n.a n.a n.a -<br />
December 14747 13246 n.a n.a n.a -<br />
TOTAL 164100 173081 176130 248343 264887 6.7<br />
* Visitor Arrivals<br />
TOURIST ACCOMMODATION (Rooms)<br />
Rooms 2003 2004 2005 2006 2007<br />
Hotels n.a n.a n.a n.a n.a<br />
Apartments n.a n.a n.a n.a n.a<br />
Villas/Cottages n.a n.a n.a n.a n.a<br />
Guest Houses/Other n.a n.a n.a n.a n.a<br />
Total 2155 2190 2227 2297 2632<br />
Source: Tourist Board, <strong>Turks</strong> and <strong>Caicos</strong> <strong>Islands</strong><br />
128
<strong>US</strong> VIRGIN ISLANDS<br />
Visitor Arrival Summary<br />
Visitor (Stay Over and Same-day) Arrivals to the <strong>US</strong>VI grew by 4.1 percent in 2010, to total 691.6<br />
thousand. This was the first increase in three years. Stopovers accounted for 85.3 percent of total<br />
visitors and increased by 4.8 percent. Same-day arrivals accounted for the remaining 14.7 percent<br />
of the total, and showed no appreciable change. Of note is the fact that the latter half of the year,<br />
July through December, suffered a fall off of -1.2 percent when compared with the same period of<br />
2009.<br />
<br />
<br />
Non-resident Hotel Registration data is used as a proxy to analyse the market distribution of<br />
tourists in the <strong>US</strong>VI. The United States’ overall market share of all arrivals in the <strong>US</strong>VI<br />
continued to grow. In 2010, 93.0 percent of all registration originated from the United States,<br />
even though the overall total fell by 3.9 percent or 28.0 thousand. The total from this market<br />
was reported at 696.9 thousand. Registrations from all markets contracted with the<br />
Caribbean accounting for 3.6 percent of the total or 27.0 thousand, sustaining a 10.1 percent<br />
reduction.<br />
In all, 680 ships sailed into port in 2010, delivering an aggregate of 1,858.9 thousand Cruise<br />
Passengers. This represented an encouraging 17.5 percent increase, or 276.7 thousand<br />
passengers in real numbers. Both the Winter and Summer months rebounded strongly,<br />
growing by 16.7 percent and 18.1 percent respectively.<br />
TOURISM HIGHLIGHTS FOR 2010<br />
VISITOR ARRIVALS<br />
Tourist Arrivals <br />
691,559<br />
Summer<br />
59.5%<br />
Winter<br />
40.5%<br />
Same Day Visitors I 101,800<br />
Cruise Passengers<br />
Summer<br />
Winter<br />
Cruise Calls<br />
1,858,946<br />
55.7%<br />
44.3%<br />
680<br />
TOURISM AND OTHER RELATED ECONOMIC STATISTICS<br />
Total Expenditure (<strong>US</strong>$ millions) I<br />
Cruise Expenditure (<strong>US</strong>$ millions) I $1,021.3<br />
$305.3<br />
Consumer Price Index (% ch.2008/’07) 7.1%<br />
ACCOMMODATION STATISTICS<br />
Total Hotel Rooms<br />
Room Occupancy Rate<br />
5,008<br />
57.1%<br />
St. Thomas/St. John - Hotel Rooms<br />
Occupancy Rate<br />
3,799<br />
60.7%<br />
ACCOMMODATION STATISTICS (continued)<br />
SOCIO - ECONOMIC STATISTICS<br />
St. Croix - Hotel Rooms<br />
Occupancy Rate<br />
1,209<br />
45.8%<br />
Land Area (square kilometers)<br />
Population (thousand mid year 2010)<br />
342<br />
110.0<br />
129
130
VISITOR AIR ARRIVALS BY CATEGORY<br />
<strong>US</strong> VIRGIN ISLANDS<br />
Category 2005 2006 2007 2008 2009<br />
Tourists 593300 570000 586400 573700 562300<br />
Same-day visitors* 96100 97200 101900 104400 102000<br />
TOTAL 689400 667200 688300 678100 664300<br />
St Thomas\St John 544800 533400 558400 558400 533300<br />
* Excluding Cruise Passengers<br />
NON-RESIDENT HOTEL REGISTRATIONS**<br />
% Share<br />
Country of Residence 2006 2007 2008 2009 2010 2010<br />
United States 605763 612279 680565 724910 696878 93.0<br />
Canada 5268 6018 9112 10412 6601 0.9<br />
Europe 15077 14884 15859 16479 14446 1.9<br />
Puerto Rico 24823 20682 21319 19776 19019 2.5<br />
Other Caribbean 11226 10681 7533 10294 8010 1.1<br />
Latin America 1762 1481 1747 1488 1221 0.2<br />
Rest of World 37123 13553 3946 3790 2854 0.4<br />
TOTAL 701042 679578 740081 787149 749029 100.0<br />
** Totals vary according to the number of hotels responding to the survey; the reader should be wary of year-to-year<br />
comparisons.<br />
VISITOR AIR ARRIVALS BY MONTH***<br />
% Change<br />
Month 2006 2007 2008 2009 2010 2010/09<br />
January 64971 59833 64431 60553 66212 9.3<br />
February 63469 59783 66305 62131 66391 6.9<br />
March 76808 79555 81280 62461 80980 29.6<br />
April 74989 66643 67121 65603 66526 1.4<br />
May 57929 55919 58859 57432 57316 -0.2<br />
June 60087 61742 62779 57923 59710 3.1<br />
July 61643 63398 62455 60956 65475 7.4<br />
August 44628 56009 54045 50610 51306 1.4<br />
September 23779 30098 24400 28272 27881 -1.4<br />
October 35204 42192 30997 38958 38426 -1.4<br />
November 46769 52593 46879 52584 48064 -8.6<br />
December 61086 65607 63743 66766 63272 -5.2<br />
TOTAL 671362 693372 683294 664249 691559 4.1<br />
** *Excluding resident arrivals and inter-island traffic but including excursionists<br />
131
CRUISE PASSENGER ARRIVALS<br />
<strong>US</strong> VIRGIN ISLANDS<br />
% Change<br />
Month 2006 2007 2008 2009 2010 2010/09<br />
January 200681 229450 230098 186405 205550 10.3<br />
February 187511 195526 194928 181826 194097 6.7<br />
March 208264 212151 226876 181175 256478 41.6<br />
April 198878 167408 184125 155626 166877 7.2<br />
May 124800 114689 92836 85763 93386 8.9<br />
June 101846 103866 104546 91938 108235 17.7<br />
July 118570 119208 105622 91489 113558 24.1<br />
August 126044 127081 98503 79165 97662 23.4<br />
September 107313 95632 65377 65314 81021 24.0<br />
October 124427 130043 78362 98305 116781 18.8<br />
November 185717 186170 156425 155478 195548 25.8<br />
December 219482 236654 219369 209780 229753 9.5<br />
TOTAL 1903533 1917878 1757067 1582264 1858946 17.5<br />
Number of Calls 782 752 687 621 680<br />
TOURIST ACCOMMODATION<br />
Type of Accommodation 2006 2007 2008 2009 2010<br />
Hotel (rooms) 3739 3678 3782 3809 3878<br />
Condo/Villa Units 1073 1079 1075 1139 1130<br />
TOTAL 4812 4757 4857 4948 5008<br />
St Thomas/St. John 3650 3580 3670 3748 3799<br />
St Croix 1162 1177 1187 1200 1209<br />
Source: Bureau of Economic Research, <strong>US</strong>VI Department of Commerce<br />
132
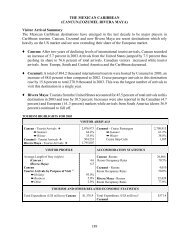
VENEZUELA<br />
Visitor Arrival Summary<br />
Tourist Arrivals to Venezuela were reported at 615.2 thousand in 2009. This represents a 17.4<br />
percent drop in arrival levels over the previous year’s total. The Winter period gave rise to only<br />
197.6 thousand stay overs as opposed to 268.0 thousand in 2008, a 26.3 percent reduction. The<br />
Summer period also suffered a 12.4 percent fall off, ending at 417.6 thousand in 2009.<br />
<br />
<br />
The Europe an market contracted by almost 20.0 percent totaling 241.4 thousand in 2009. The<br />
South American market shrank similarly by 18.2 percent, down from 226.6 thousand in 2008 to<br />
185.3 thousand in 2009.<br />
Cruise Passenger Arrivals fell to two thirds of the 2008 figure, amounting to 77.9 thousand.<br />
Both the Winter and Summer seasons fell away sharply by 31.9 percent and 26.5 percent<br />
respectively.<br />
TOURISM HIGHLIGHTS FOR 2009<br />
VISITOR ARRIVALS<br />
Tourist Arrivals <br />
Summer<br />
Winter<br />
Cruise Passenger Arrivals<br />
615,188<br />
67.9%<br />
32.1%<br />
77,941<br />
Tourist Air Arrivals to Maiquetía<br />
(Caracas)<br />
Tourists Air Arrivals to Porlamar<br />
n.a<br />
n.a<br />
VISITOR PROFILE<br />
Tourist Arrivals by Purpose of Visit<br />
Holiday<br />
Business<br />
Other<br />
71.7%<br />
25.2%<br />
3.1%<br />
Main Source of Information**<br />
Television<br />
Family and Friends<br />
Newspapers<br />
Other<br />
5.02%<br />
43.31%<br />
3.01%<br />
48.66%<br />
TOURISM AND OTHER RELATED ECONOMIC STATISTICS<br />
Total Expenditure (<strong>US</strong>$ millions)<br />
Average visitor expenditure (<strong>US</strong>$)<br />
ACCOMMODATION STATISTICS<br />
$780.0<br />
$1,305.0<br />
Average Daily Expenditure (<strong>US</strong>$)<br />
$72.9<br />
GDP at Factor Cost (<strong>US</strong>$ millions) VI $102,484<br />
SOCIO-ECONOMIC STATISTICS<br />
Rooms II 33,290 Land Area (square kilometers)<br />
Population (thousand mid year 2008)<br />
912,050<br />
27,934.7<br />
**Source: September 1998 Survey of Receptive Tourist at the Simon Bolivar International Airport of Maquetía<br />
133
134
TOURISTS AIR ARRIVALS BY INTERNATIONAL AIRPORTS<br />
VENEZUELA<br />
% Share<br />
Area 2005 2006 2007 2008 2009 2009<br />
Maiquetía (Caracas) 559884 562596 559319 543780 489056 79.5<br />
Porlamar * 115079 121800 134063 109436 58779 9.6<br />
Maracaibo 19012 22627 23417 28876 13251 2.2<br />
Punto Fijo<br />
San Antonio<br />
Barcelona<br />
Barquisimeto<br />
Coro<br />
12128 40907 53768 62617 54102 8.8<br />
TOTAL 706103 747930 770567 744709 615188 100.0<br />
These cities are major tourism areas in Venezuela.<br />
* “The International Airport of the Caribbean” is located in Porlamar in the state of Nueva Esparta. This state consists of the<br />
tourist destinations of Margarita, Coche and Cubagua <strong>Islands</strong><br />
TOURISTS ARRIVALS BY MAJOR MARKETS<br />
% Share<br />
Country of Residence 2005 2006 2007 2008 2009 2009<br />
United States 89701 88825 90074 86982 76059 12.4<br />
Canada 25527 28014 26670 25870 18165 3.0<br />
Argentina 26596 26287 26863 26055 24601 4.0<br />
Colum bia 74497 84293 79735 77417 61659 10.0<br />
Other South America 88256 110058 123026 123173 99042 16.1<br />
Central America 12421 12404 11286 11377 10760 1.7<br />
Holland 16892 18129 19985 17651 10528 1.7<br />
Italy 56521 53177 56005 52131 45926 7.5<br />
Spain 66181 65894 75301 66649 62848 10.2<br />
Other Europe 156716 160401 164750 165148 122126 19.9<br />
Caribbean 40948 43880 43256 39940 33726 5.5<br />
Rest of World 51847 56568 53616 52316 49748 8.1<br />
TOTAL 706103 747930 770567 744709 615188 100.0<br />
135
TOURISTS ARRIVALS BY MONTH<br />
VENEZUELA<br />
% Change<br />
Month 2005 2006 2007 2008 2009 2009/08<br />
January 63517 69841 71883 72931 55118 -24.4<br />
February 58558 63135 68564 71784 50665 -29.4<br />
March 60418 61140 68666 69570 50311 -27.7<br />
April 47603 51629 59470 53695 41522 -22.7<br />
May 47583 48972 56366 51494 39194 -23.9<br />
June 52919 56883 69504 61197 47552 -22.3<br />
July 71052 77505 74055 74942 59760 -20.3<br />
August 69209 69257 65571 62544 61227 -2.1<br />
September 43678 53172 47009 53130 37646 -29.1<br />
October 56843 57268 58465 54016 44711 -17.2<br />
November 59526 62075 58271 54050 58273 7.8<br />
December 75197 77053 72743 65356 69209 5.9<br />
TOTAL 706103 747930 770567 744709 615188 -17.4<br />
CRUISE PASSENGER ARRIVALS<br />
% Change<br />
Month 2005 2006 2007 2008 2009 2009/08<br />
January 21140 36322 33455 30667 14790 -51.8<br />
February 15835 31800 22170 19640 19954 1.6<br />
March 25820 32838 19340 24031 19722 -17.9<br />
April 13394 24956 11822 8714 2115 -75.7<br />
May 0 0 2880 1416 1651 16.6<br />
June 0 0 2602 0 978 -<br />
July 0 0 4227 0 2249 -<br />
August 0 0 3530 0 2861 -<br />
September 0 0 2823 0 221 -<br />
October 4028 2566 3257 0 3722 -<br />
November 25651 15238 14846 9404 9678 2.9<br />
December 28875 19625 21174 18229 0 -<br />
TOTAL 134743 163345 142126 112101 77941 -30.5<br />
136
VENEZUELA<br />
ESTIMATED VISITOR EXPENDITURE (<strong>US</strong> dollars per tourist)<br />
Expenditure 2005 2006 2007 2008 2009<br />
Total 976.9 1159.0 1137.3 1329.0 1305.0<br />
TOURISTS ACCOMMODATION BY STATES<br />
% Share<br />
Area 2003 2004 2005 2006 2007 2007<br />
Caracas Metropolitan Area 8535 5934 n.a n.a n.a -<br />
Anzoátegui 1 4252 4252 n.a n.a n.a -<br />
Bolívar 2 1630 1630 n.a n.a n.a -<br />
Carabobo 3 1599 1478 n.a n.a n.a -<br />
Falcón 4 1292 1292 n.a n.a n.a -<br />
Nueva Esparta 5 4309 3834 n.a n.a n.a -<br />
Mérida 6 1695 1704 n.a n.a n.a -<br />
Other States 10950 13166 n.a n.a n.a -<br />
Total 34262 33290 n.a n.a n.a -<br />
1<br />
The State of Anzoátegui consists of the tourist destination of Barcelona - Puerto La Cruz<br />
2<br />
The State of Bolívar consists of the tourist destination of Canaima National Park and La Gran Sabana<br />
3<br />
The State of Carabobo consists of the tourist destination, Valencia and Puerto Cabello<br />
4<br />
The State of Falcón consists of the tourist destinations of Coro, Punto Fijo and the Morrocoy National Park<br />
5<br />
The State of Nueva Esparta consists of the tourist destinations of Margarita, Coche and Cubagua <strong>Islands</strong><br />
6<br />
The State of Mérida consists of the tourist destinations of Mérida City and the Sierra Navada National Park<br />
137
138
139
SECTION V<br />
ECONOMIC & SOCIO-ECONOMIC INDICATORS
DIVIDER BACK