Environmental & Social Report - Subaru
Environmental & Social Report - Subaru
Environmental & Social Report - Subaru

Create successful ePaper yourself
Turn your PDF publications into a flip-book with our unique Google optimized e-Paper software.
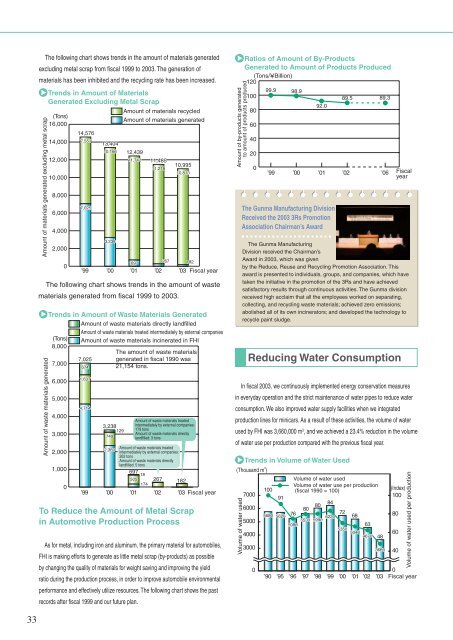
The following chart shows trends in the amount of materials generated<br />
excluding metal scrap from fi scal 1999 to 2003. The generation of<br />
materials has been inhibited and the recycling rate has been increased.<br />
Amount of materials generated excluding metal scrap<br />
Trends in Amount of Materials<br />
Generated Excluding Metal Scrap<br />
Amount of materials recycled<br />
(Tons)<br />
Amount of materials generated<br />
16,000<br />
14,000<br />
12,000<br />
10,000<br />
8,000<br />
6,000<br />
4,000<br />
2,000<br />
0<br />
14,576<br />
7,551<br />
7,025<br />
13,404<br />
10,166 12,439<br />
11,742<br />
3,238<br />
697<br />
11,485<br />
11,218<br />
10,995<br />
10,813<br />
267 182<br />
’99 ’00 ’01 ’02 ’03 Fiscal year<br />
The following chart shows trends in the amount of waste<br />
materials generated from fi scal 1999 to 2003.<br />
Amount of waste materials generated<br />
Trends in Amount of Waste Materials Generated<br />
(Tons)<br />
8,000<br />
7,000<br />
6,000<br />
5,000<br />
4,000<br />
3,000<br />
2,000<br />
1,000<br />
0<br />
Amount of waste materials directly landfilled<br />
Amount of waste materials treated intermediately by external companies<br />
Amount of waste materials incinerated in FHI<br />
7,025<br />
674<br />
1,637<br />
4,714<br />
3,238<br />
129<br />
749<br />
The amount of waste materials<br />
generated in fiscal 1990 was<br />
21,154 tons.<br />
Amount of waste materials treated<br />
intermediately by external companies:<br />
179 tons<br />
Amount of waste materials directly<br />
landfilled: 3 tons<br />
2,360<br />
Amount of waste materials treated<br />
intermediately by external companies:<br />
262 tons<br />
Amount of waste materials directly<br />
landfilled: 5 tons<br />
697<br />
18<br />
505 267 182<br />
174<br />
’99 ’00 ’01 ’02 ’03 Fiscal year<br />
To Reduce the Amount of Metal Scrap<br />
in Automotive Production Process<br />
As for metal, including iron and aluminum, the primary material for automobiles,<br />
FHI is making efforts to generate as little metal scrap (by-products) as possible<br />
by changing the quality of materials for weight saving and improving the yield<br />
ratio during the production process, in order to improve automobile environmental<br />
performance and effectively utilize resources. The following chart shows the past<br />
records after fi scal 1999 and our future plan.<br />
Amount of by-products generated<br />
to amount of products produced<br />
Ratios of Amount of By-Products<br />
Generated to Amount of Products Produced<br />
(Tons/Billion)<br />
120<br />
100<br />
80<br />
60<br />
40<br />
20<br />
0<br />
99.9 98.9<br />
92.0<br />
The Gunma Manufacturing Division<br />
Received the 2003 3Rs Promotion<br />
Association Chairman’s Award<br />
89.5<br />
89.3<br />
’99 ’00 ’01 ’02 ’06<br />
The Gunma Manufacturing<br />
Division received the Chairman’s<br />
Award in 2003, which was given<br />
by the Reduce, Reuse and Recycling Promotion Association. This<br />
award is presented to individuals, groups, and companies, which have<br />
taken the initiative in the promotion of the 3Rs and have achieved<br />
satisfactory results through continuous activities. The Gunma division<br />
received high acclaim that all the employees worked on separating,<br />
collecting, and recycling waste materials; achieved zero emissions;<br />
abolished all of its own incinerators; and developed the technology to<br />
recycle paint sludge.<br />
Reducing Water Consumption<br />
Fiscal<br />
year<br />
In fi scal 2003, we continuously implemented energy conservation measures<br />
in everyday operation and the strict maintenance of water pipes to reduce water<br />
consumption. We also improved water supply facilities when we integrated<br />
production lines for minicars. As a result of these activities, the volume of water<br />
used by FHI was 3,660,000 m 3 , and we achieved a 23.4% reduction in the volume<br />
of water use per production compared with the previous fi scal year.<br />
(Thousand m 3 )<br />
Volume of water used<br />
Trends in Volume of Water Used<br />
7000<br />
6000<br />
5000<br />
4000<br />
3000<br />
0<br />
Volume of water used<br />
Volume of water use per production<br />
100 (fiscal 1990 = 100)<br />
91<br />
84<br />
80<br />
80<br />
76<br />
72<br />
5680 5620<br />
68<br />
5530 5990 6220<br />
5080<br />
63<br />
5350 5040 4670 48<br />
3660<br />
’90 ’95 ’96 ’97 ’98 ’99 ’00 ’01 ’02 ’03<br />
(Index)<br />
100<br />
80<br />
60<br />
40<br />
Volume of water used per production<br />
0<br />
Fiscal year