Boyer diss 2009 1046..
Boyer diss 2009 1046.. Boyer diss 2009 1046..
Figure 4.34. Measurements of calcaneum. See Table 5.21A-C for measurement descriptions. 478
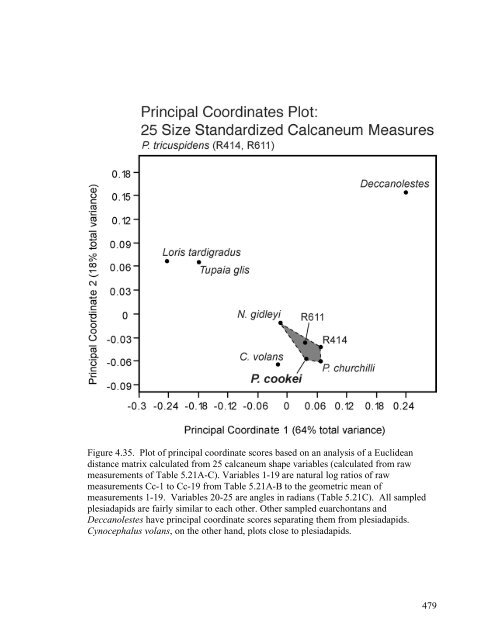
Figure 4.35. Plot of principal coordinate scores based on an analysis of a Euclidean distance matrix calculated from 25 calcaneum shape variables (calculated from raw measurements of Table 5.21A-C). Variables 1-19 are natural log ratios of raw measurements Cc-1 to Cc-19 from Table 5.21A-B to the geometric mean of measurements 1-19. Variables 20-25 are angles in radians (Table 5.21C). All sampled plesiadapids are fairly similar to each other. Other sampled euarchontans and Deccanolestes have principal coordinate scores separating them from plesiadapids. Cynocephalus volans, on the other hand, plots close to plesiadapids. 479
- Page 455 and 456: Table 4.35. Body segment lengths (m
- Page 457 and 458: Table 4.37A. Parameters for Gingeri
- Page 459 and 460: Table 4.38C. Summary of plesiadapid
- Page 461 and 462: Appendix Table 4.1B. Plesiadapis co
- Page 463 and 464: Appendix Table 4.3. Other plesiadap
- Page 465 and 466: Figure 4.2. Plesiadapis cookei (UM
- Page 467 and 468: Figure 4.4. Plot of principal coord
- Page 469 and 470: Figure 4.6. Surface reconstructions
- Page 471 and 472: Figure 4.8. Surface reconstructions
- Page 473 and 474: Figure 4.9. Surface reconstructions
- Page 475 and 476: Figure 4.10. Surface reconstruction
- Page 477 and 478: Figure 4.12. Surface reconstruction
- Page 479 and 480: Figure 4.13. Surface reconstruction
- Page 481 and 482: Figure 4.14. Plesiadapis cookei or
- Page 483 and 484: Figure 4.15. Surface reconstruction
- Page 485 and 486: Figure 4.17. Plot of principal coor
- Page 487 and 488: Figure 4.19. Plesiadapis cookei (UM
- Page 489 and 490: Figure 4.21. Plesiadapis cookei (UM
- Page 491 and 492: Figure 4.23. Plesiadapis cookei (UM
- Page 493 and 494: Figure 4.24. Plesiadapis cookei (UM
- Page 495 and 496: Figure 4.25. Surface reconstruction
- Page 497: Figure 4.27. Plesiadapis cookei (UM
- Page 500 and 501: Figure 4.30 472
- Page 502 and 503: Figure 4.31. Measurements of astrag
- Page 504 and 505: Figure 4.33 476
- Page 508 and 509: Figure 4.36. Plesiadapis cookei (UM
- Page 510 and 511: Figure 4.38. Plesiadapis cookei (UM
- Page 512 and 513: Figure 4.40. Stereophotographic vie
- Page 514 and 515: Figure 4.42. Plesiadapis cookei (UM
- Page 516 and 517: Figure 4.44. Plesiadapis cookei (UM
- Page 518 and 519: Figure 4.46. 490
- Page 520 and 521: Figure 4.47 492
- Page 522 and 523: Figure 4.48. Plesiadapis cookei (UM
- Page 524 and 525: Figure 4.50. 496
- Page 526 and 527: Figure 4.51. Surface reconstruction
- Page 528 and 529: INTRODUCTION Bloch et al. (2007) an
- Page 530 and 531: have a lacrimal bone that retains i
- Page 532 and 533: Institutional abbreviations AMNH, A
- Page 534 and 535: level cladogram. A total of 33 cran
- Page 536 and 537: plesiadapiform Ignacius graybullian
- Page 538 and 539: RESULTS Phylogenetic reconstruction
- Page 540 and 541: Optimization of postcranial traits
- Page 542 and 543: Therefore, character optimization r
- Page 544 and 545: carpolestid bulla is not split into
- Page 546 and 547: 2008). I therefore changed the codi
- Page 548 and 549: Re-coding and optimization of crani
- Page 550 and 551: and paromomyids. This, however, is
- Page 552 and 553: REFERENCES Beard, K.C., 1989. Postc
- Page 554 and 555: Novacek, M.J., 1986. The skull of l
Figure 4.35. Plot of principal coordinate scores based on an analysis of a Euclidean<br />
distance matrix calculated from 25 calcaneum shape variables (calculated from raw<br />
measurements of Table 5.21A-C). Variables 1-19 are natural log ratios of raw<br />
measurements Cc-1 to Cc-19 from Table 5.21A-B to the geometric mean of<br />
measurements 1-19. Variables 20-25 are angles in radians (Table 5.21C). All sampled<br />
plesiadapids are fairly similar to each other. Other sampled euarchontans and<br />
Deccanolestes have principal coordinate scores separating them from plesiadapids.<br />
Cynocephalus volans, on the other hand, plots close to plesiadapids.<br />
479


