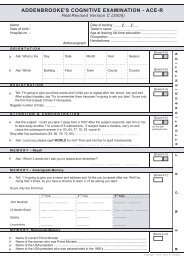
The Addenbrooke's Cognitive Examination Revised (ACE-R): a brief ...
The Addenbrooke's Cognitive Examination Revised (ACE-R): a brief ...
The Addenbrooke's Cognitive Examination Revised (ACE-R): a brief ...

Create successful ePaper yourself
Turn your PDF publications into a flip-book with our unique Google optimized e-Paper software.
1080 e. mioshi ET AL.<br />
function, as determined by a clinician’s judgement<br />
based on a structured interview with the patient and an<br />
informant and a Mini-Mental State <strong>Examination</strong><br />
(MMSE) score greater than or equal to 24; (4) no<br />
or minimal impairment in activities of daily living<br />
(ADLs), as determined by a clinical interview with the<br />
patient and an informant; and (5) not sufficiently<br />
impaired, cognitively and functionally, to meet<br />
National Institute of Neurological and Communicative<br />
Disorders and Stroke/Alzheimer’s Disease and<br />
Related Disorders Association criteria for AD (Grundman<br />
et al., 2004).<br />
Control group<br />
Controls (n ¼ 63) were recruited from the volunteer<br />
panel at the Medical Research Council, Brain Sciences<br />
Unit (n ¼ 43) or were spouses of patients attending the<br />
clinics (n ¼ 18) (see Table 1).<br />
Statistical analyses<br />
Statistical analyses were either performed using the<br />
Statistical Package for the Social Sciences 11 for<br />
Windows (SPSS Inc., Chicago, IL USA) or Excel for<br />
Windows XP (Microsoft, USA).<br />
Demographics and <strong>ACE</strong>-R sub-scores were compared<br />
across different groups’ means using independent<br />
t-tests, applying Levene’s test for equality of<br />
variance and Bonferroni corrections.<br />
Reliability was calculated using the Cronbach alpha<br />
coefficient (McDowell and Newell, 1996). Concurrent<br />
and convergent validity was calculated using a twotailed<br />
Spearman correlation between <strong>ACE</strong>-R final<br />
scores and CDR scores (McDowell and Newell, 1996;<br />
Streiner, 2003b). Sensitivity, specificity, positive<br />
predictive values and negative predictive values were<br />
calculated using discriminant analyses. Likelihood<br />
ratios of probability of dementia were based on the<br />
above discriminant analyses’ results (Sackett et al.,<br />
1991). <strong>ACE</strong>-R comparisons with <strong>ACE</strong> were performed<br />
using simple t-tests.<br />
Descriptive analysis of MCI, AD and control<br />
performance was generated by analysis of variance<br />
and t-tests.<br />
RESULTS<br />
Reliability and validity<br />
<strong>The</strong> alpha coefficient of the <strong>ACE</strong>-R was 0.80, which is<br />
considered very good (McDowell and Newell, 1996;<br />
Streiner, 2003a). In order to assess concurrent and<br />
convergent validity, the <strong>ACE</strong>-R was compared to the<br />
CDR. Spearman rho correlation coefficient between<br />
<strong>ACE</strong>-R and CDR was significant ( 0.321, two<br />
tailed, p < 0.000). <strong>The</strong> negative value reflects the fact<br />
that as CDR scores increase, <strong>ACE</strong>-R total scores<br />
decrease.<br />
Table 1. Comparison of demographic data, MMSE, <strong>ACE</strong>-R total and sub-scores in control, MCI and dementia groups (n ¼ 241, standard<br />
deviation in parenthesis)<br />
Control<br />
n ¼ 63<br />
MCI<br />
n ¼ 36<br />
Dementia<br />
n ¼ 142<br />
Dementia vs<br />
Control<br />
p values<br />
Dementia vs<br />
MCI<br />
p values<br />
MCI vs<br />
Control<br />
p values<br />
Gender, male 28 17 99<br />
Age 64.4 (5.7) 68.8 (9) 65.7 (8) n.s. n.s. n.s.<br />
Education, years 12.7 (2.1) 12.8 (3.4) 11.9 (2.7) n.s. n.s. n.s.<br />
MMSE 28.8 (1.3) 27.7 (1.5) 22.8 (4.3) ** ** **<br />
<strong>ACE</strong>-R total score<br />
93.7 (4.3) 84.2 (7.3) 65.4 (15.9) ** ** **<br />
100 points maximum<br />
Attention & Orientation 17.7 (0.5) 17.2 (1) 14.4 (3.2) ** ** n.s.<br />
18 points maximum<br />
Memory<br />
23.4 (2.7) 17.8 (4.7) 12.4 (5.8) ** ** **<br />
26 points maximum<br />
Fluency<br />
11.9 (1.7) 10.1 (2.4) 6 (3.5) ** ** **<br />
14 points maximum<br />
Language<br />
25.1 (1.5) 23.9 (1.6) 20 (5.6) ** ** *<br />
26 points maximum<br />
Visuospatial<br />
16 points maximum<br />
15.7 (0.7) 14.9 (2) 12.6 (3.5) ** ** n.s.<br />
n.s ¼ non significant.<br />
*p < 0.005. Levene’s test for equality of variance; Bonferroni corrected.<br />
**p < 0.001.<br />
Copyright # 2006 John Wiley & Sons, Ltd. Int J Geriatr Psychiatry 2006; 21: 1078–1085.<br />
DOI: 10.1002/gps