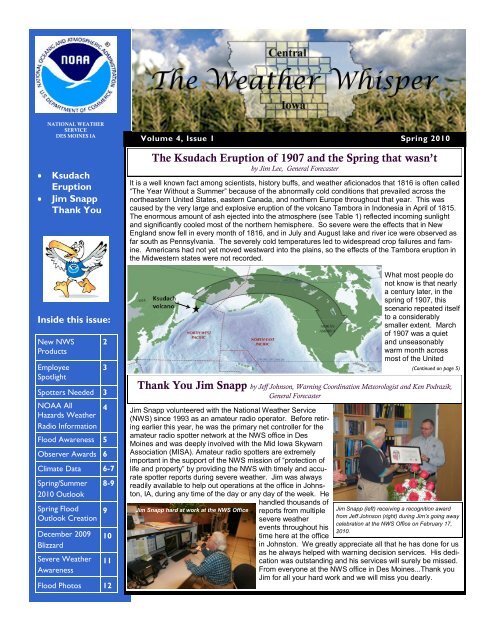
The Ksudach Eruption of 1907 and the Spring that wasn't
The Ksudach Eruption of 1907 and the Spring that wasn't
The Ksudach Eruption of 1907 and the Spring that wasn't

Create successful ePaper yourself
Turn your PDF publications into a flip-book with our unique Google optimized e-Paper software.
NATIONAL WEATHER<br />
SERVICE<br />
DES MOINES IA<br />
Volume 4, Issue 1<br />
<strong>Spring</strong> 2010<br />
<strong>Ksudach</strong><br />
<strong>Eruption</strong><br />
Jim Snapp<br />
Thank You<br />
Inside this issue:<br />
New NWS<br />
Products<br />
Employee<br />
Spotlight<br />
2<br />
3<br />
Spotters Needed 3<br />
NOAA All<br />
Hazards Wea<strong>the</strong>r<br />
Radio Information<br />
4<br />
Flood Awareness 5<br />
Observer Awards 6<br />
Climate Data 6-7<br />
<strong>Spring</strong>/Summer<br />
2010 Outlook<br />
8-9<br />
<strong>Spring</strong> Flood<br />
Outlook Creation 9<br />
December 2009<br />
Blizzard<br />
Severe Wea<strong>the</strong>r<br />
Awareness<br />
10<br />
11<br />
Flood Photos 12<br />
<strong>The</strong> <strong>Ksudach</strong> <strong>Eruption</strong> <strong>of</strong> <strong>1907</strong> <strong>and</strong> <strong>the</strong> <strong>Spring</strong> <strong>that</strong> wasn’t<br />
by Jim Lee, General Forecaster<br />
It is a well known fact among scientists, history buffs, <strong>and</strong> wea<strong>the</strong>r aficionados <strong>that</strong> 1816 is <strong>of</strong>ten called<br />
“<strong>The</strong> Year Without a Summer” because <strong>of</strong> <strong>the</strong> abnormally cold conditions <strong>that</strong> prevailed across <strong>the</strong><br />
nor<strong>the</strong>astern United States, eastern Canada, <strong>and</strong> nor<strong>the</strong>rn Europe throughout <strong>that</strong> year. This was<br />
caused by <strong>the</strong> very large <strong>and</strong> explosive eruption <strong>of</strong> <strong>the</strong> volcano Tambora in Indonesia in April <strong>of</strong> 1815.<br />
<strong>The</strong> enormous amount <strong>of</strong> ash ejected into <strong>the</strong> atmosphere (see Table 1) reflected incoming sunlight<br />
<strong>and</strong> significantly cooled most <strong>of</strong> <strong>the</strong> nor<strong>the</strong>rn hemisphere. So severe were <strong>the</strong> effects <strong>that</strong> in New<br />
Engl<strong>and</strong> snow fell in every month <strong>of</strong> 1816, <strong>and</strong> in July <strong>and</strong> August lake <strong>and</strong> river ice were observed as<br />
far south as Pennsylvania. <strong>The</strong> severely cold temperatures led to widespread crop failures <strong>and</strong> famine.<br />
Americans had not yet moved westward into <strong>the</strong> plains, so <strong>the</strong> effects <strong>of</strong> <strong>the</strong> Tambora eruption in<br />
<strong>the</strong> Midwestern states were not recorded.<br />
Jim Snapp volunteered with <strong>the</strong> National Wea<strong>the</strong>r Service<br />
(NWS) since 1993 as an amateur radio operator. Before retiring<br />
earlier this year, he was <strong>the</strong> primary net controller for <strong>the</strong><br />
amateur radio spotter network at <strong>the</strong> NWS <strong>of</strong>fice in Des<br />
Moines <strong>and</strong> was deeply involved with <strong>the</strong> Mid Iowa Skywarn<br />
Association (MISA). Amateur radio spotters are extremely<br />
important in <strong>the</strong> support <strong>of</strong> <strong>the</strong> NWS mission <strong>of</strong> “protection <strong>of</strong><br />
life <strong>and</strong> property” by providing <strong>the</strong> NWS with timely <strong>and</strong> accurate<br />
spotter reports during severe wea<strong>the</strong>r. Jim was always<br />
readily available to help out operations at <strong>the</strong> <strong>of</strong>fice in Johnston,<br />
IA, during any time <strong>of</strong> <strong>the</strong> day or any day <strong>of</strong> <strong>the</strong> week. He<br />
h<strong>and</strong>led thous<strong>and</strong>s <strong>of</strong><br />
reports from multiple<br />
severe wea<strong>the</strong>r<br />
events throughout his<br />
time here at <strong>the</strong> <strong>of</strong>fice<br />
What most people do<br />
not know is <strong>that</strong> nearly<br />
a century later, in <strong>the</strong><br />
spring <strong>of</strong> <strong>1907</strong>, this<br />
scenario repeated itself<br />
to a considerably<br />
smaller extent. March<br />
<strong>of</strong> <strong>1907</strong> was a quiet<br />
<strong>and</strong> unseasonably<br />
warm month across<br />
most <strong>of</strong> <strong>the</strong> United<br />
(Continued on page 5)<br />
Thank You Jim Snapp by Jeff Johnson, Warning Coordination Meteorologist <strong>and</strong> Ken Podrazik,<br />
General Forecaster<br />
Jim Snapp hard at work at <strong>the</strong> NWS Office<br />
Jim Snapp (left) receiving a recognition award<br />
from Jeff Johnson (right) during Jim’s going away<br />
celebration at <strong>the</strong> NWS Office on February 17,<br />
2010.<br />
in Johnston. We greatly appreciate all <strong>that</strong> he has done for us<br />
as he always helped with warning decision services. His dedication<br />
was outst<strong>and</strong>ing <strong>and</strong> his services will surely be missed.<br />
From everyone at <strong>the</strong> NWS <strong>of</strong>fice in Des Moines...Thank you<br />
Jim for all your hard work <strong>and</strong> we will miss you dearly.
Page 2 Volume 4, Issue 1<br />
New Special Wea<strong>the</strong>r Statement Policy by Ben Moyer, Senior Meteorologist<br />
Beginning this spring, <strong>the</strong> National Wea<strong>the</strong>r Service in Des Moines will have a new policy concerning short-term wea<strong>the</strong>r <strong>and</strong><br />
impact information. <strong>The</strong> old Short Term Forecast product will be replaced by Special Wea<strong>the</strong>r Statements. Special Wea<strong>the</strong>r<br />
Statements will be used to convey short-term wea<strong>the</strong>r <strong>and</strong> impact information <strong>of</strong> importance to our customers <strong>that</strong> (1) is insufficient<br />
to justify issuance <strong>of</strong> a warning or advisory or (2) provides information in <strong>the</strong> convective pre-warning mode. For more details,<br />
please go to <strong>the</strong> following location on <strong>the</strong> Web http://www.crh.noaa.gov/images/dmx/Media Advisory 2010-02.pdf.<br />
What does a Tornado Emergency Mean? by Ben Moyer, Senior Meteorologist<br />
Beginning this spring, <strong>the</strong> National Wea<strong>the</strong>r Service in Des Moines will use <strong>the</strong> term “tornado emergency” in tornado warnings<br />
or severe wea<strong>the</strong>r statements in rare instances when significant, widespread damage with a high likelihood <strong>of</strong> numerous<br />
fatalities is expected to continue due to a strong <strong>and</strong> violent tornado approaching or affecting a highly vulnerable population.<br />
This term is not to be confused with <strong>the</strong> intended purpose <strong>of</strong>, <strong>and</strong> response to, <strong>the</strong> issuance <strong>of</strong> any tornado warning. <strong>The</strong> National<br />
Wea<strong>the</strong>r Service wants <strong>the</strong> public to take every warning seriously<br />
<strong>and</strong> to take action <strong>that</strong> saves lives when a warning is issued for <strong>the</strong>ir location.<br />
<strong>The</strong> intended purpose <strong>of</strong> using <strong>the</strong> term “tornado emergency” is as follows:<br />
To motivate <strong>and</strong> provide a sense <strong>of</strong> urgency to persons in <strong>the</strong> path<br />
<strong>of</strong> this storm to take immediate shelter in a reinforced structure<br />
<strong>that</strong> <strong>of</strong>fers maximum protection from destructive winds.<br />
To communicate to state, local, <strong>and</strong> county <strong>of</strong>ficials <strong>and</strong> emergency<br />
responders <strong>that</strong> <strong>the</strong>y should prepare for immediate search<br />
<strong>and</strong> rescue operations.<br />
To communicate <strong>the</strong> need to prepare for immediate medical emergencies,<br />
evacuation measures, <strong>and</strong> emergency sheltering.<br />
Violent EF-5 tornado approaching New Hartford, IA on 25 May 2008. Photo<br />
courtesy <strong>of</strong> Rod Donavon, Senior Meteorologist, NWS Des Moines.<br />
Maximum Wind <strong>and</strong> Hail Tag on Severe Thunderstorm Warnings<br />
by Jeff Johnson, Warning Coordination Meteorologist<br />
Beginning this March, all National Wea<strong>the</strong>r Service Offices in <strong>the</strong> Central Region will be appending an experimental tag line to<br />
severe thunderstorm warnings <strong>and</strong> follow-up severe wea<strong>the</strong>r statements. <strong>The</strong> tag line is a concise code which identifies maximum<br />
hail size <strong>and</strong> wind speed expected for a given warning. Inclusion <strong>of</strong> this information at <strong>the</strong> end <strong>of</strong> <strong>the</strong>se products represents<br />
an effort to respond to partner requests from <strong>the</strong> emergency management community as well as several societal impact<br />
groups.<br />
One specific application concerns <strong>the</strong> activation <strong>of</strong> emergency alert sirens. Local area sirens are typically alarmed for tornadoes<br />
only. Decoding this tag line will facilitate <strong>the</strong> capability for local area emergency managers to activate sirens for particularly dangerous<br />
severe thunderstorm events when conditions exceed user-defined thresholds, say for winds greater than 90 mph as an<br />
example.<br />
<strong>The</strong> maximum wind <strong>and</strong> hail size tag line is an experiment which will be evaluated from March 1, 2010 through October 1,<br />
2010. During this period, we encourage comments <strong>of</strong> suggestions for improvement using <strong>the</strong> electronic survey provided at <strong>the</strong><br />
link below. Your feedback will help us determine product usefulness, potential modifications, <strong>and</strong> permanence to our warning<br />
format. On-line customer feedback survey (http://www.wea<strong>the</strong>r.gov/survey/nws-survey.php?code=svr-wind-hail)<br />
Coming Soon - Website Tutorials by Aubry Wilkins, Meteorologist Intern<br />
Have you found yourself wondering what <strong>the</strong> wea<strong>the</strong>r was like on July 4, 2008? Or what <strong>the</strong> forecast for <strong>the</strong> Cedar River near<br />
Waterloo is? <strong>The</strong> answers to <strong>the</strong>se questions can be found on <strong>the</strong> National Wea<strong>the</strong>r Service Des Moines‟ website at<br />
www.wea<strong>the</strong>r.gov/desmoines along with a wealth <strong>of</strong> additional information about wea<strong>the</strong>r, our mission, outreach activities <strong>and</strong><br />
educational materials. We know <strong>that</strong> all this information can make <strong>the</strong> website difficult to navigate <strong>and</strong> frustrating to use. Coming<br />
soon however, we will be developing <strong>and</strong> posting short, helpful “how to” videos about <strong>the</strong> website. We will cover topics such<br />
as looking up climate data, utilizing <strong>the</strong> forecast, <strong>and</strong> much, much more. So check back frequently to see what we‟ve added<br />
<strong>and</strong> enjoy exploring <strong>the</strong> site!
Volume 4, Issue 1<br />
Page 3<br />
New Employee Spotlight—Jacob Beitlich, Meteorologist Intern<br />
<strong>The</strong> spotter training schedule at <strong>the</strong> National Wea<strong>the</strong>r Service (NWS)<br />
in Des Moines kicked <strong>of</strong>f February 17 <strong>and</strong> will last through <strong>the</strong> end <strong>of</strong><br />
April. Hundreds <strong>of</strong> spotters have been trained so far but more are still<br />
needed, especially in rural areas. We currently have 2,928 spotters<br />
across our 51 county forecast area, however many <strong>of</strong> those are clustered<br />
in <strong>and</strong> around larger cities. As you can tell from Figure 1, gaps<br />
<strong>of</strong> coverage still exist in many locations.<br />
Spotters are a critical part <strong>of</strong> <strong>the</strong> warning system with <strong>the</strong>ir reports<br />
<strong>of</strong>ten making <strong>the</strong> difference between whe<strong>the</strong>r a warning is issued or<br />
not. Doppler radars give us a lot <strong>of</strong> information, but not what is happening<br />
near <strong>the</strong> ground, or even <strong>the</strong> lowest several thous<strong>and</strong> feet in<br />
most instances. NWS spotters are not asked to go mobile or become<br />
storm chasers. All we ask is <strong>that</strong> you take a spotter training class,<br />
ei<strong>the</strong>r in person or on-line. Our spotters are not chasers but ra<strong>the</strong>r<br />
points <strong>of</strong> contact <strong>that</strong> call <strong>the</strong> NWS with severe wea<strong>the</strong>r reports, or are<br />
available for inquiries from NWS staff regarding conditions in <strong>the</strong>ir<br />
area. All participants are volunteers <strong>and</strong> never asked to alter <strong>the</strong>ir<br />
plans on any given day. Being a spotter is a great way to volunteer in<br />
your community. Your report may make <strong>the</strong> difference in a severe<br />
wea<strong>the</strong>r situation <strong>and</strong> save lives.<br />
If you would like more information on <strong>the</strong> NWS Des Moines Spotter<br />
Program such as training dates, on-line training, field<br />
guides, course notes <strong>and</strong> registration information, please<br />
visit http://wea<strong>the</strong>r.gov/desmoines <strong>and</strong> select <strong>the</strong> Spotter<br />
Training tab on <strong>the</strong> front page. O<strong>the</strong>r information is available<br />
by contacting Warning Coordination Meteorologist<br />
Jeff Johnson (jeff.johnson@noaa.gov) or Spotter Program<br />
Leader Brad Small (bradley.small@noaa.gov), both at<br />
(515) 270-4501.<br />
I grew up on a dairy farm just south <strong>of</strong> La Crosse, Wisconsin, along <strong>the</strong><br />
Mississippi river. As any farmer knows, <strong>the</strong> wea<strong>the</strong>r has a major impact<br />
on <strong>the</strong> daily tasks, <strong>and</strong> this is what motivated me to pursue a career<br />
in meteorology. I earned a Physics/Ma<strong>the</strong>matics bachelor‟s degree<br />
from <strong>the</strong> University <strong>of</strong> Wisconsin, La Crosse in May 2007, <strong>and</strong><br />
earned my master‟s degree in Atmospheric <strong>and</strong> Oceanic Sciences<br />
from Wisconsin University this past December. I was thrilled at <strong>the</strong><br />
opportunity to work for <strong>the</strong> National Wea<strong>the</strong>r Service here in Des<br />
Moines. I feel <strong>that</strong> <strong>the</strong> people, <strong>and</strong> also <strong>the</strong> ever-changing wea<strong>the</strong>r,<br />
make Iowa a great place to live. For example, during one <strong>of</strong> <strong>the</strong> many<br />
winter storms this year, my car got hung up on a snow drift on my way<br />
to work. Since I had just moved, I didn‟t own a snow shovel, but a<br />
neighbor stopped <strong>and</strong> let me borrow his so I could dig myself out. No<br />
more than fifteen minutes later, a second vehicle stopped by to assist<br />
me <strong>and</strong> helped push me out. As I was thanking <strong>the</strong>m, a third pick-up<br />
truck stopped <strong>and</strong> <strong>of</strong>fered to lend me a h<strong>and</strong>. This Good Samaritan<br />
attitude is why my fiancé <strong>and</strong> I are excited to start our lives toge<strong>the</strong>r in<br />
this community. Besides wea<strong>the</strong>r, I enjoy playing baseball, volleyball,<br />
golfing, mowing <strong>the</strong> lawn, <strong>and</strong> grilling steaks.<br />
Spotters Needed in Rural Areas by Brad Small, Senior Meteorologist<br />
Fun Fact: 1,800 thunderstorms occur at any moment<br />
across <strong>the</strong> world. That adds up to 16 million storms<br />
each year worldwide!<br />
Above Figure: Locations <strong>of</strong> wea<strong>the</strong>r spotters in central Iowa trained by<br />
staff from <strong>the</strong> National Wea<strong>the</strong>r Service in Des Moines.<br />
Seasonal Snowfall Normals (July 1- June 30)<br />
Location<br />
Normal<br />
2009-2010 Season<br />
Total (thru Feb)<br />
Des Moines 36.2” 62.3”<br />
Mason City 39.4” 42.5”<br />
Waterloo 34.1” 51.3”<br />
Ottumwa 26.9” N/A
Page 4 Volume 4, Issue 1<br />
NOAA All Hazards Wea<strong>the</strong>r Radio by Rob DeRoy, Data Program Manager & NWR Program Leader<br />
NOAA All Hazards Wea<strong>the</strong>r Radio (NWR) is a primary method to automatically receive Severe Wea<strong>the</strong>r <strong>and</strong> o<strong>the</strong>r life threatening<br />
emergency messages from <strong>the</strong> National Wea<strong>the</strong>r Service.<br />
Known as <strong>the</strong> “Voice <strong>of</strong> <strong>the</strong> National Wea<strong>the</strong>r Service,” “NOAA All Hazards Wea<strong>the</strong>r Radio” is provided as a public service by<br />
<strong>the</strong> National Oceanic & Atmospheric Administration (NOAA), part <strong>of</strong> <strong>the</strong> Department <strong>of</strong> Commerce. NWR includes more than<br />
900 transmitters, covering all 50 states, adjacent coastal waters, Puerto Rico, <strong>the</strong> U.S. Virgin Isl<strong>and</strong>s, <strong>and</strong> <strong>the</strong> U.S. Pacific Territories.<br />
NWR requires a special radio receiver or scanner capable <strong>of</strong> picking up <strong>the</strong> signal.<br />
Broadcasts are found in <strong>the</strong> public service b<strong>and</strong> at <strong>the</strong>se seven frequencies (MHz): 162.400, 162.425, 162.450, 162.475,<br />
162.500, 162.525, 162.550.<br />
Iowa has 36 transmitters covering all 99 counties. Each transmitter provides broadcast service to several counties. Fourteen <strong>of</strong><br />
<strong>the</strong>se transmitters are located in <strong>the</strong> Des Moines National Wea<strong>the</strong>r Service area <strong>of</strong> responsibility. <strong>The</strong>se are:<br />
Each Iowa county is served by one or more transmitters.<br />
To see a complete listing <strong>of</strong> which counties are<br />
served by <strong>the</strong>se 36 Iowa transmitters, please see:<br />
http://www.wea<strong>the</strong>r.gov/nwr/CntyCov/nwrIA.htm.<br />
Modern NOAA All Hazards Wea<strong>the</strong>r Radio receivers<br />
use “SAME” technology which allows <strong>the</strong> user to program<br />
<strong>the</strong> radio for Severe Wea<strong>the</strong>r Watches <strong>and</strong><br />
Warnings for one or more counties. For information on<br />
how to program a “SAME” enabled receiver see:<br />
http://www.nws.noaa.gov/nwr/same.htm.<br />
When a National Wea<strong>the</strong>r Service <strong>of</strong>fice broadcasts a<br />
warning, watch or non-wea<strong>the</strong>r emergency, it also<br />
broadcasts a digital “SAME” code <strong>that</strong> may be heard<br />
as a very brief static burst, depending on <strong>the</strong> characteristics<br />
<strong>of</strong> <strong>the</strong> receiver. This “SAME” code contains <strong>the</strong><br />
type <strong>of</strong> message, county(s) affected, <strong>and</strong> message expiration time.<br />
Des Moines WXL-57 162.550 MHz<br />
Waterloo WXL-94 162.550 MHz<br />
Fort Dodge WXK-84 162.400 MHz<br />
Marshalltown KXI-98 162.500 MHz<br />
Montezuma KXI-62 162.450 MHz<br />
Lenox KXI-65 162.450 MHz<br />
Rathbun Lake WXN-91 162.425 MHz<br />
Carroll KZZ-51 162.425 MHz<br />
Van Wert KZZ-68 162.475 MHz<br />
Iowa Falls WNG-666 162.525 MHz<br />
Denison WNG-668 162.550 MHz<br />
Ringsted WNG688 162.475 MHz<br />
Ottumwa WNG-630 162.500 MHz<br />
Forest City KJY-63 162.500 MHz<br />
A properly programmed receiver will automatically turn on for <strong>that</strong> message, with <strong>the</strong> listener hearing <strong>the</strong> 1050 Hz warning<br />
alarm tone as an attention signal, followed by <strong>the</strong> broadcast message. This warning service is provided to users 24 hours per<br />
day, 365 days a year. Listeners will also receive specific forecasts for <strong>the</strong>ir area along with hourly wea<strong>the</strong>r conditions <strong>and</strong> much<br />
more wea<strong>the</strong>r related information.<br />
A New Marshalltown NOAA Wea<strong>the</strong>r Radio Site on <strong>the</strong> Horizon<br />
by David Reese, Electronics System Analyst<br />
<strong>The</strong> Marshalltown All Hazards NOAA Wea<strong>the</strong>r Radio (NWR) site is planning to move to a new location by July 2010. <strong>The</strong> current<br />
NWR site tower structure located at <strong>the</strong> Alliant Energy Su<strong>the</strong>rl<strong>and</strong> Power Station in Marshalltown, has been deemed unreliable<br />
due to repeated flooding. Alliant has made plans to vacate all <strong>of</strong> <strong>the</strong>ir own equipment from <strong>the</strong> site <strong>and</strong> tear down <strong>the</strong><br />
tower by early summer. Alliant has <strong>of</strong>fered to allow <strong>the</strong> NWS to move <strong>the</strong> current NWR transmitter <strong>and</strong> antenna to an alternate<br />
location just a few miles from <strong>the</strong> current location. <strong>The</strong> new location <strong>of</strong>fers <strong>the</strong> same amenities <strong>and</strong> service as <strong>the</strong> existing site,<br />
but on higher ground, with basically no future threat <strong>of</strong> flooding. A new lease agreement with Interstate Power Company is<br />
being drafted by <strong>the</strong> NWS for <strong>the</strong> new location, <strong>and</strong> we expect to be relocating <strong>the</strong> transmitter in just a few months. NWS technicians<br />
accompanied by Alliant technicians will be performing <strong>the</strong> actual move.<br />
Fun Facts: Most snowfall in a winter season<br />
(July-June) for Des Moines, Iowa. <strong>The</strong> current<br />
totals are valid thru March 20th, 2010:<br />
1. 72.0 INCHES IN 1911-12<br />
2. 70.9 INCHES IN 1885-86<br />
3. 69.0 INCHES IN 2009-10<br />
4. 64.1 INCHES IN 1961-62<br />
5. 62.9 INCHES IN 1981-82<br />
Marshalltown Transmitter in<br />
<strong>the</strong> 2008 Iowa River Flood<br />
New Location
Volume 4, Issue 1<br />
Page 5<br />
States east <strong>of</strong> <strong>the</strong> Rockies, especially in <strong>the</strong> sou<strong>the</strong>astern<br />
<strong>Ksudach</strong> <strong>Eruption</strong> <strong>of</strong> <strong>1907</strong> continued from page 1 states. In late March, on or around <strong>the</strong> 28 th , <strong>the</strong> volcano <strong>Ksudach</strong><br />
on <strong>the</strong> Kamchatka Peninsula <strong>of</strong> eastern Russia exploded<br />
sending ash high into <strong>the</strong> atmosphere. <strong>The</strong> ash traveled with <strong>the</strong> jet stream winds across <strong>the</strong> north Pacific, over Canada <strong>and</strong><br />
into <strong>the</strong> central <strong>and</strong> eastern United States (see Figure 1). As a result temperatures dropped sharply beginning in <strong>the</strong> first week<br />
<strong>of</strong> April <strong>and</strong> did not recover significantly for many weeks. <strong>The</strong> months <strong>of</strong> April <strong>and</strong> May were unseasonably cold east <strong>of</strong> <strong>the</strong><br />
Rockies, with multiple snow events coming much later than usual <strong>and</strong> many tree <strong>and</strong> field crops ruined by late freezes. In Iowa,<br />
snow fell across most or all <strong>of</strong> <strong>the</strong> state on April 29 th , May 3 rd , <strong>and</strong> May 15 th . <strong>The</strong> second <strong>of</strong> <strong>the</strong>se storms produced snow over<br />
most <strong>of</strong> <strong>the</strong> Midwestern states on May 2 nd -3 rd including amounts <strong>of</strong> 1.2” at Des Moines, 1.7” at Kansas City, <strong>and</strong> 4.3” at North<br />
Platte. Many all-time May cold <strong>and</strong> snow records were set in <strong>1907</strong> <strong>and</strong> have not been broken since, including <strong>the</strong> latest date <strong>of</strong><br />
<strong>the</strong> year on which at least an inch <strong>of</strong> snow has fallen at Des Moines (1.2” on <strong>the</strong> 3 rd ) <strong>and</strong> <strong>the</strong> latest date <strong>of</strong> any measurable<br />
snowfall at Des Moines (0.1” on <strong>the</strong> 15 th ). During <strong>the</strong> storm <strong>of</strong> <strong>the</strong> 15 th an amazing 5” <strong>of</strong> snow fell at Rock Rapids in far northwestern<br />
Iowa.<br />
<strong>The</strong> unusually cold temperatures <strong>that</strong> occurred during this event were unprecedented in many areas <strong>of</strong> <strong>the</strong> country east <strong>of</strong> <strong>the</strong><br />
Rockies. At stations all <strong>the</strong> way from Montana <strong>and</strong> <strong>the</strong> Dakotas, through Iowa <strong>and</strong> Illinois <strong>and</strong> <strong>the</strong> Great Lakes Region, down<br />
into <strong>the</strong> sou<strong>the</strong>rn plains <strong>of</strong> Oklahoma <strong>and</strong> Kansas, <strong>and</strong> east to Pennsylvania <strong>and</strong> Washington DC, April <strong>and</strong> May <strong>of</strong> <strong>1907</strong> still<br />
rank among <strong>the</strong> three coldest on record for each <strong>of</strong> those months. Fortunately <strong>the</strong> effects <strong>of</strong> <strong>the</strong> eruption <strong>and</strong> ash cloud began<br />
to moderate by June <strong>and</strong> were no longer detectable by <strong>the</strong> end <strong>of</strong> <strong>the</strong> summer, due to <strong>the</strong> relatively small magnitude <strong>of</strong> <strong>the</strong><br />
eruption as compared to <strong>the</strong> much larger Tambora event <strong>of</strong> 1815.<br />
Table 1<br />
Volcano Tambora <strong>Ksudach</strong> Mt. St. Helens<br />
Year <strong>of</strong> eruption 1815 <strong>1907</strong> 1980<br />
Explosivity Index (VEI) 7 5 5<br />
Volume <strong>of</strong> ash ejected (km 3 ) 160 2.4 1.2<br />
March is Flood Awareness Month in Iowa by Jeff Zogg, Senior Hydrologist<br />
<strong>The</strong> Rebuild Iowa Office (RIO) <strong>and</strong> <strong>the</strong> National Wea<strong>the</strong>r Service (NWS) are working toge<strong>the</strong>r to encourage flood awareness<br />
<strong>and</strong> safety for everyone in Iowa. This year, <strong>the</strong> NWS‟s National Flood Safety Awareness Week ran from March 15-19, in conjunction<br />
with Governor Culver‟s declaration <strong>of</strong> March as Flood Awareness Month in Iowa.<br />
Why flood awareness? <strong>The</strong> answer is simple. Flooding is <strong>the</strong> #1 storm-related killer. It kills more people than tornadoes or<br />
lightning. Most <strong>of</strong> <strong>the</strong> fatalities occur when people drive or walk into flooded areas <strong>and</strong> <strong>the</strong>n ei<strong>the</strong>r drown or are swept away to<br />
<strong>the</strong>ir deaths. Flooding also takes many different forms, from river flooding to flash flooding to snow melt flooding; <strong>and</strong> occurs in<br />
any month <strong>of</strong> <strong>the</strong> year, any time <strong>of</strong> day <strong>and</strong> is a threat in almost any place.<br />
But flooding doesn‟t happen very <strong>of</strong>ten. That‟s why it‟s important to know how to find important information, how to prepare for<br />
potential flooding, where to obtain flood insurance if it is required in your area <strong>and</strong> general safety tips to help keep you, your<br />
family <strong>and</strong> your property safe.<br />
<strong>The</strong> NWS has many different ways to help you keep up with <strong>the</strong> latest flood warnings, watches <strong>and</strong> forecasts. One is NOAA<br />
Wea<strong>the</strong>r Radio which broadcasts flood watches <strong>and</strong> warnings. Information is also available on <strong>the</strong> Internet via <strong>the</strong> Advanced<br />
Hydrologic Prediction Service (AHPS), at http://www.wea<strong>the</strong>r.gov/ahps. AHPS also includes <strong>the</strong> latest flood warnings, watches<br />
<strong>and</strong> forecasts.<br />
Hopefully, flooding will never affect you. But if it does, both <strong>the</strong> NWS <strong>and</strong> RIO want you<br />
to be prepared for whatever comes your way. For more information, visit <strong>the</strong> NWS<br />
flood safety awareness Web site at http://www.floodsafety.noaa.gov/. Also, visit <strong>the</strong><br />
RIO flood awareness Web page at http://www.rio.iowa.gov/flood_awareness.html.<br />
Fun Fact: <strong>The</strong> largest hail stone to fall in <strong>the</strong><br />
United States was 7 inches in diameter <strong>and</strong> fell in<br />
Aurora, Nebraska on June 22, 2003.
Page 6 Volume 4, Issue 1<br />
2010 Cooperative Observer Length <strong>of</strong> Service Awards by Brad Fillbach, Cooperative Program Manager<br />
Brad Mueller <strong>of</strong> Greenfield received a 5 year Certificate <strong>of</strong><br />
Appreciation. Brad Fillbach, Hydrometeorological Technician<br />
at NWS Des Moines, presented Brad with his certificate.<br />
Diane Ward <strong>of</strong> Gilman, Iowa received her 15 year Length <strong>of</strong><br />
Service Award. Brad Fillbach, Hydrometeorological Technician<br />
at NWS Des Moines, presented Diane with her award.<br />
Climatological Data for November 2009 to February 2010<br />
Location<br />
Month<br />
Average<br />
Temp<br />
Departure Highest Lowest Rain / Snow Departure<br />
Nov 46.9°F +9.0°F 75°F (8th) 26°F (30th) 1.3” / T -0.8” / -4.5”<br />
Des<br />
Moines<br />
Dec 22.7°F -2.2°F 62°F (1st) -6°F (10th) 2.83” / 28.2” +1,50” / +20.5”<br />
Jan 16.7°F -3.7°F 44°F (13th) -17°F (2nd) 1.68” / 13.3” +0.65” / +4.5”<br />
Feb 20.0°F -6.6°F 35°F (4th, 28th) -9°F (9th) 1.08” / 19.7” -0.11” / +11.5”<br />
Nov 40.6°F +7.8°F 69°F (8th) 19°F (27th) 0.51” / T -1.45” / -5.0”<br />
Mason<br />
City<br />
Waterloo<br />
Ottumwa<br />
Dec 16.4°F -2.6°F 50°F (1st) -8°F (10th) 3.02” / 21.7” +1.94” / +13.7”<br />
Jan 9.9°F -4.0°F 34°F (23rd) -23°F (2nd) 0.71” / 5.4” -0.27” / -5.7”<br />
Feb 13.4°F -7.2°F 34°F (5th) -14°F (11th) 1.13” / 15.4” +0.21” / +9.2”<br />
Nov 42.4°F +7.3°F 71°F (7th, 8th) 21°F (5th, 27th) 0.61” / T -1.49” / -4.8”<br />
Dec 18.8°F -2.8°F 55°F (1st) -12°F (11th) 3.19” / 27.3” +2.08” / +19.8”<br />
Jan 12.2°F -3.9°F 37°F (23rd) -20°F (2nd) 0.84” / 7.8” +0.00” / -0.4”<br />
Feb 16.3°F -6.3°F 35°F (5th) -14°F (11th) 1.00” / 16.2” -0.05” / +8.9”<br />
Nov 45.6°F +6.2°F 74°F (8th) 24°F (27th) 2.56” / M +0.14” / M<br />
Dec 23.8°F -2.8°F 59°F (1st) -6°F (10th) 0.85” / M -0.47” / M<br />
Jan 16.5°F -5.5°F 42°F (13th, 23rd) -15°F (2nd) 0.92” / M -0.08” / M<br />
Feb 18.8°F -9.1°F 35°F (1st) -9°F (9th) M / M M / M
Volume 4, Issue 1<br />
Page 7<br />
Temperatures:<br />
2009-2010 Winter Wea<strong>the</strong>r in Iowa by Craig Cogil, Senior Meteorologist<br />
Temperatures were below normal for <strong>the</strong> third winter in a row across Iowa. Much <strong>of</strong> this was due to <strong>the</strong> extensive snow<br />
cover over <strong>the</strong> state <strong>and</strong> persistent flow from Canada. <strong>The</strong> largest departures were in western Iowa where readings were<br />
about 6 to 8 degrees below normal while <strong>the</strong> nor<strong>the</strong>ast corner <strong>of</strong> <strong>the</strong> state saw departures <strong>of</strong> only about a degree below normal.<br />
Precipitation:<br />
Precipitation was widespread across <strong>the</strong> state during <strong>the</strong> winter months with <strong>the</strong> entire state seeing above normal amounts.<br />
<strong>The</strong> largest departures were in <strong>the</strong> far northwest corner <strong>of</strong> <strong>the</strong> state where precipitation was over 200% <strong>of</strong> normal with most<br />
<strong>of</strong> <strong>the</strong> state at 130% <strong>of</strong> normal or greater. <strong>The</strong> far sou<strong>the</strong>ast corner <strong>of</strong> <strong>the</strong> state saw precipitation near normal. Snowfall<br />
came <strong>of</strong>ten <strong>and</strong> in great quantities with <strong>the</strong> state as a whole seeing <strong>the</strong> most snow ever for a winter season. Snowfall was<br />
45.1 inches averaged across <strong>the</strong> state. This is 23.3 inches greater than normal <strong>and</strong> is <strong>the</strong> new record for <strong>the</strong> three month<br />
period for snowfall on a statewide average.<br />
Iowa Statewide Averages <strong>and</strong> Rankings for Temperature <strong>and</strong> Precipitation<br />
Month Temperature Departure from<br />
Normal<br />
Rainfall<br />
Departure from<br />
Normal<br />
Temperature<br />
Ranking<br />
Precipitation<br />
Ranking<br />
December 2009 19.8°F -2.8°F 2.70” +1.47” 31 st Coolest 2 nd Wettest<br />
January 2010 13.7°F -4.1°F 1.33” +0.38” 33 rd Coolest 37 th Wettest<br />
February 2010 17.5°F -6.7°F 0.96” -0.02” 26 th Coolest 69 th Driest<br />
Winter 2009-10 17.0°F -4.5°F 4.99” +1.82” 19 th Coolest 9 th Wettest<br />
Table above: statewide rankings for December are based upon<br />
137 years <strong>of</strong> records, while January/February are based on <strong>the</strong><br />
past 138 years. All values are preliminary. Winter months include<br />
December through February.<br />
Normal High/Low Temperatures<br />
Location Mar 1 Apr 1 May 1 Jun 1<br />
Des Moines 41 / 23 55 / 35 67 / 46 78 / 57<br />
Fun Fact: <strong>The</strong> energy from one lightning flash<br />
could light a 100-watt light bulb for more than 3<br />
months.<br />
Mason City 34 / 18 50 / 30 65 / 42 76 / 53<br />
Waterloo 38 / 19 53 / 31 66 / 42 78 / 54<br />
Ottumwa 42 / 25 56 / 36 67 / 48 78 / 59
Page 8 Volume 4, Issue 1<br />
Outlook for <strong>Spring</strong> through Summer <strong>of</strong> 2010 by Miles Schumacher, Senior Meteorologist<br />
<strong>The</strong> winter <strong>of</strong> 2009-10 turned out to be colder than expected due to a combination <strong>of</strong> several factors. <strong>The</strong> El Niño developed<br />
about as expected; however <strong>the</strong> warm water pattern in <strong>the</strong> Pacific was shifted west <strong>of</strong> normal. Ano<strong>the</strong>r factor was <strong>the</strong> state <strong>of</strong><br />
<strong>the</strong> Atlantic Oscillation. <strong>The</strong> Atlantic Oscillation is a climatic pattern across <strong>the</strong> Atlantic Ocean which in <strong>the</strong> negative state, as<br />
was <strong>the</strong> case this past winter, results in colder wea<strong>the</strong>r for much <strong>of</strong> <strong>the</strong> central <strong>and</strong> eastern U.S. Although <strong>the</strong> past winter was<br />
not extremely cold, <strong>the</strong>se two factors combined to produce persistent cold air over Iowa, which also resulted in significant<br />
snowfall.<br />
Figure 1: Sea surface temperature departure from normal in <strong>the</strong> equatorial<br />
Pacific.<br />
Figure 2. Sea surface<br />
temperature departure<br />
for <strong>the</strong> past year <strong>and</strong><br />
projection into <strong>the</strong> fall <strong>of</strong><br />
2010. Departure in<br />
Kelvin is shown on <strong>the</strong><br />
ordinate with time on <strong>the</strong><br />
abscissa.<br />
Figure 3: Mean temperature departure forecast for April (left) <strong>and</strong> May (right).<br />
As we head into <strong>the</strong> spring season, many have wondered if <strong>the</strong><br />
cold will continue or if <strong>the</strong> cold winter means <strong>the</strong> summer will be<br />
warmer than normal. <strong>The</strong>re is not a strong correlation between<br />
winter temperatures <strong>and</strong> <strong>the</strong> subsequent summer. <strong>The</strong> more<br />
significant factor will be <strong>the</strong> state <strong>of</strong> El Niño this summer. Currently<br />
<strong>the</strong> El Niño remains at moderate strength as depicted by<br />
warm water departures in <strong>the</strong> equatorial Pacific are shown in Figure<br />
1. It appears it will remain a factor through <strong>the</strong> spring <strong>and</strong> will<br />
weaken gradually during <strong>the</strong> summer.<br />
<strong>The</strong> atmospheric response to El Niño is not very strong during <strong>the</strong><br />
spring <strong>and</strong> summer months, though <strong>the</strong>re is some influence. During<br />
<strong>the</strong> spring season <strong>the</strong>re is a tendency for drier than normal<br />
conditions for Iowa. As we move into <strong>the</strong> summer, <strong>the</strong> odds tip<br />
slightly toward cooler than normal wea<strong>the</strong>r <strong>and</strong> slightly drier than<br />
normal conditions. <strong>The</strong>re are questions as to what <strong>the</strong> state <strong>of</strong> El<br />
Niño will be this summer. Various models are used as a guide<br />
<strong>and</strong> <strong>the</strong> overall consensus is <strong>that</strong> <strong>the</strong>re will be at least a weak<br />
signal into <strong>the</strong> boreal summer. That would suggest <strong>the</strong>re will be<br />
an influence on <strong>the</strong> wea<strong>the</strong>r in Iowa this summer, albeit a weak<br />
one. Figure 2 shows <strong>the</strong> central Pacific sea surface temperature<br />
departure (black line) <strong>and</strong> a series <strong>of</strong> forecasts (red <strong>and</strong> blue<br />
lines) through <strong>the</strong> time period centered on October 2010.<br />
Although no two years are <strong>the</strong> same, one can look at wea<strong>the</strong>r patterns <strong>of</strong> <strong>the</strong> recent<br />
past to give some indications <strong>of</strong> near term wea<strong>the</strong>r trends in <strong>the</strong> future. This forecast is<br />
based on <strong>the</strong> best fit from several <strong>of</strong> <strong>the</strong> years <strong>that</strong> were similar to <strong>the</strong> late winter <strong>and</strong><br />
spring so far. Considerations were also made for El Niño <strong>and</strong> o<strong>the</strong>r factors <strong>that</strong> control<br />
our wea<strong>the</strong>r. <strong>The</strong> effects <strong>of</strong> El Niño are likely to diminish<br />
with time as <strong>the</strong> current event has peaked <strong>and</strong> will decay<br />
slowly. As stated above, <strong>the</strong> effects during <strong>the</strong> spring are<br />
weak for temperature <strong>and</strong> tend toward drier wea<strong>the</strong>r overall.<br />
Looking at years similar to <strong>the</strong> recent past suggest<br />
temperatures are not likely to be much above or below<br />
normal for <strong>the</strong> months <strong>of</strong> April <strong>and</strong> May (Figure 3). <strong>The</strong>re<br />
is a tendency for cooler than normal conditions to settle<br />
into areas north <strong>of</strong> Iowa, with some <strong>of</strong> <strong>the</strong> cooler air spilling<br />
into <strong>the</strong> state periodically. For <strong>that</strong> reason, we look<br />
for a slight negative departure over <strong>the</strong> nor<strong>the</strong>ast. Warming<br />
this spring is expected to be fairly rapid to <strong>the</strong> south <strong>of</strong><br />
Iowa <strong>and</strong> some periods <strong>of</strong> above normal temperatures<br />
are expected to move into Iowa as we move through <strong>the</strong> spring, enough so <strong>that</strong> temperatures are expected to be slightly above<br />
normal on average over <strong>the</strong> southwest.<br />
<strong>The</strong>re is a somewhat stronger signal with spring precipitation. Though it does not look like <strong>the</strong> spring will be dry, <strong>the</strong> odds tip<br />
slightly toward <strong>the</strong> drier than normal side as <strong>the</strong> spring progresses. May is <strong>the</strong> most likely month to have sub-normal rainfall as<br />
<strong>the</strong> seasonal upper level high pressure begins to develop over <strong>the</strong> sou<strong>the</strong>rn U.S. <strong>and</strong> steers storm systems to <strong>the</strong> north <strong>of</strong> Iowa<br />
(Figure 4).<br />
As we move into <strong>the</strong> summer, again <strong>the</strong> influence <strong>of</strong> El Niño is expected to be minor both because <strong>the</strong>re is not a great deal <strong>of</strong><br />
influence by El Niño in <strong>the</strong> summer months, <strong>and</strong> also because it is expected to weaken considerably by this summer. Both <strong>the</strong><br />
influence from El Niño <strong>and</strong> <strong>the</strong> analog years <strong>of</strong> recent past wea<strong>the</strong>r suggest <strong>the</strong> summer will be fairly close to normal, in stark<br />
(Continued on page 9)
Volume 4, Issue 1<br />
Figure 4: Mean precipitation departure forecast for April (left) <strong>and</strong> May (right).<br />
Page 9<br />
contrast to last summer. <strong>The</strong> temperature departure is<br />
not expected to be very large, on <strong>the</strong> order <strong>of</strong> a half degree.<br />
Precipitation for <strong>the</strong> summer is likely to lean toward<br />
<strong>the</strong> drier side. Although drier than normal conditions are<br />
expected for <strong>the</strong> summer, <strong>the</strong> departure is not likely to be<br />
all <strong>that</strong> significant. With mean rainfall expected to be normal<br />
to about 10% below normal, it is very unlikely <strong>that</strong><br />
drought conditions will become established as antecedent<br />
soil conditions will be very moist <strong>and</strong> should carry through<br />
<strong>the</strong> summer given <strong>the</strong> mild temperatures expected (Figure<br />
5).<br />
<strong>The</strong>se outlooks are based more heavily on statistics than<br />
many <strong>of</strong> <strong>the</strong> methods used by <strong>the</strong> Climate Prediction Center<br />
(http://www.cpc.ncep.noaa.gov/). <strong>The</strong> complete set <strong>of</strong><br />
<strong>of</strong>ficial forecasts from <strong>the</strong> Climate Prediction Center can<br />
be found on our website (http://www.wea<strong>the</strong>r.gov/climate/<br />
climate_prediction.php?wfo=dmx).<br />
Figure 5: Mean temperature departure from normal forecast for <strong>the</strong> summer (left) <strong>and</strong><br />
mean rainfall departure for <strong>the</strong> summer (right).<br />
Fun Fact: <strong>The</strong> channel <strong>of</strong> air through which lightning<br />
passes can be heated to 50,000 °F. This is hotter than<br />
<strong>the</strong> surface <strong>of</strong> <strong>the</strong> Sun.<br />
<strong>Spring</strong> Flood Outlooks: How Do We Make <strong>The</strong>m? by Jeff Zogg, Senior Hydrologist<br />
By <strong>the</strong> time you receive this newsletter, this year's snow melt flood event will be winding down. You likely heard about our<br />
spring flood outlooks starting in late winter. For this spring <strong>the</strong>y mentioned a “high risk <strong>of</strong> significant flooding” beginning with<br />
our first outlook in late January. We highlighted <strong>the</strong>m on our Web site <strong>and</strong> many <strong>of</strong> our media partners referenced <strong>the</strong>m as<br />
well. This article will explain how we make our spring flood outlooks. As an example, below is how we made our March 5,<br />
2010 spring flood outlook. Since we issued three spring flood outlooks this season, we followed a similar process for each outlook<br />
<strong>and</strong> for each <strong>of</strong> our river forecast points.<br />
We first note <strong>the</strong> current hydrologic conditions as <strong>of</strong> March 2, 2010. By current hydrologic conditions we mean factors such as<br />
river levels, soil moisture, frost depth <strong>and</strong> snow pack. We typically choose a date <strong>that</strong> is a few days before <strong>the</strong> outlook's issuance<br />
date because it takes time to run our river models, analyze <strong>the</strong>ir output <strong>and</strong> prepare <strong>the</strong> outlook.<br />
We <strong>the</strong>n run our river forecast model in two different modes. <strong>The</strong> first mode is <strong>the</strong> conditional simulation (CS). In CS mode, we<br />
ultimately run our model 60 times for each river forecast point, with one run for each <strong>of</strong> <strong>the</strong> 60 years before <strong>the</strong> current year.<br />
For each run, we initially set up our model with <strong>the</strong> current hydrologic conditions as <strong>of</strong> March 2, 2010. This is called initializing<br />
<strong>the</strong> model to <strong>the</strong> current hydrologic conditions. <strong>The</strong>n, for each <strong>of</strong> <strong>the</strong> 60 model runs, we run our model using observed temperature<br />
<strong>and</strong> precipitation for a past year, <strong>and</strong> for roughly <strong>the</strong> three month period following March 2. In <strong>the</strong> case <strong>of</strong> our March<br />
5, 2010 outlook, we first initialize our model to <strong>the</strong> current hydrologic conditions as <strong>of</strong> March 2, 2010. <strong>The</strong>n, we run our model<br />
using observed temperature <strong>and</strong> precipitation from March 2, 1949 through May 7, 1949. Once our model finishes, we again<br />
initialize it to <strong>the</strong> current hydrologic conditions as <strong>of</strong> March 2, 2010. <strong>The</strong>n we run our model again, using observed temperature<br />
<strong>and</strong> precipitation from March 2, 1950 through May 7, 1950. We repeat this process for each year through 2008.<br />
<strong>The</strong> second mode in which we run our river forecast model is <strong>the</strong> historical simulation (HS). HS mode is quite different from CS<br />
mode. For starters, in HS mode we initialize our model to <strong>the</strong> current hydrologic conditions as <strong>of</strong> March 2, 2010 only once.<br />
<strong>The</strong>n, we run our model continuously for a 60-year period, using observed temperature <strong>and</strong> precipitation data for each day in<br />
<strong>that</strong> 60-year period. In o<strong>the</strong>r words, we start our model on March 2, 1949 <strong>and</strong> run it non-stop through May 7, 2008, using observed<br />
temperature <strong>and</strong> precipitation.<br />
After we run our model in CS <strong>and</strong> HS mode, we perform a separate analysis on each mode's results. For both CS <strong>and</strong> HS<br />
modes, our analyses reveal <strong>the</strong> single highest river level, or crest, observed in each <strong>of</strong> <strong>the</strong> March 2 through May 7 time periods,<br />
<strong>and</strong> for each <strong>of</strong> <strong>the</strong> 60 years from 1949 through 2008. In o<strong>the</strong>r words, our analyses <strong>of</strong> <strong>the</strong> CS <strong>and</strong> HS modes yield 60 crests for<br />
each mode. <strong>The</strong>n, for each mode, we rank <strong>the</strong> 60 crests from greatest to least <strong>and</strong> assign a corresponding probability <strong>of</strong> exceedance.<br />
In <strong>the</strong> case <strong>of</strong> <strong>the</strong> top crest, its rank is #1 <strong>and</strong> its probability <strong>of</strong> exceedance is <strong>the</strong> statistical formula 1/(60+1) =<br />
1.6%. In <strong>the</strong> case <strong>of</strong> <strong>the</strong> bottom crest, its rank is #60 <strong>and</strong> its probability <strong>of</strong> exceedance is <strong>the</strong> formula 60/(60+1) = 98.4%.<br />
Again, we use separate lists for CS <strong>and</strong> HS.<br />
(Continued on page 11)
Page 10 Volume 4, Issue 1<br />
Overview <strong>of</strong> <strong>the</strong> December 8-9, 2009 Blizzard by Ken Podrazik, General Forecaster<br />
Drifts at <strong>the</strong> NWS Office in Johnston, IA.<br />
Aubry Wilkins present. Photo taken by Jim<br />
W. Lee.<br />
<strong>The</strong> very active winter wea<strong>the</strong>r season<br />
began in early December when a major<br />
blizzard blasted across <strong>the</strong> state dropping<br />
anywhere from 8 to 16 inches <strong>of</strong> snow<br />
throughout much <strong>of</strong> Iowa (Figure 1). <strong>The</strong><br />
storm began early Tuesday morning on<br />
December 8 th , 2009 when light to moderate<br />
snowfall extended across central to sou<strong>the</strong>rn<br />
Iowa. <strong>The</strong> snow<br />
Figure 1: Snowfall<br />
totals by early<br />
Wednesday Dec 9th,<br />
2009.<br />
Figure 2: Radar<br />
Image 6pm Tuesday<br />
Dec 8th, 2009. Courtesy<br />
IEM.<br />
slowly spread over <strong>the</strong><br />
rest <strong>of</strong> <strong>the</strong> state <strong>and</strong><br />
intensified throughout <strong>the</strong> afternoon <strong>and</strong> into <strong>the</strong> evening<br />
hours, significantly affecting <strong>the</strong> Des Moines Metro area rush<br />
hour Tuesday night (Figure 2). Northwest winds increased<br />
to 25 to 35 mph with gusts over 50 mph at times late Tuesday<br />
night into early Wednesday morning. <strong>The</strong>re were even a<br />
couple <strong>of</strong> reports <strong>of</strong> wind gusts to 60 mph overnight Tuesday<br />
into Wednesday. <strong>The</strong>se strong winds <strong>and</strong> heavy snow produced<br />
large drifts throughout <strong>the</strong> state, with several over 6 feet! Visibility became<br />
reduced significantly across much <strong>of</strong> Iowa late Tuesday night into<br />
Wednesday. Widespread whiteout conditions were observed from early<br />
Wednesday morning through <strong>the</strong> early afternoon over <strong>the</strong> central to northcentral<br />
portions <strong>of</strong> <strong>the</strong> state (Figure 3). <strong>The</strong> heavy snow, large drifts, <strong>and</strong> reduced<br />
visibility caused several closures <strong>of</strong> roads <strong>and</strong> difficult travel (Figure 4).<br />
<strong>The</strong> very strong storm affected a great portion <strong>of</strong> <strong>the</strong> central United States. In<br />
fact, blizzard warnings were in effect from Tuesday night through Wednesday<br />
over eastern Nebraska, sou<strong>the</strong>rn Minnesota, nor<strong>the</strong>rn Missouri, <strong>the</strong> sou<strong>the</strong>rn<br />
half <strong>of</strong> Wisconsin, far nor<strong>the</strong>ast Kansas, <strong>and</strong><br />
<strong>the</strong> entire state <strong>of</strong> Iowa (Colored Orange in Figure<br />
5). A temperature gradient across Iowa late<br />
Tuesday night was about 25 degrees from<br />
sou<strong>the</strong>ast to northwest Iowa. By Wednesday<br />
afternoon, temperatures throughout <strong>the</strong> state<br />
plummeted into <strong>the</strong> single digits to around 10<br />
above, leading to wind chill values well below<br />
zero. <strong>The</strong> snow finally tapered <strong>of</strong>f by Wednesday<br />
afternoon <strong>and</strong> high pressure began to build<br />
into <strong>the</strong> region Wednesday night. By Thursday,<br />
clear skies allowed <strong>the</strong> large swath <strong>of</strong> snow<br />
throughout much <strong>of</strong> <strong>the</strong> region to be seen<br />
(Figure 6).<br />
Figure 3: Observed Visibility Wednesday<br />
morning. Courtesy IEM.<br />
Figure 4: Road conditions Wednesday morning. Courtesy<br />
Iowa State Patrol <strong>and</strong> IEM.<br />
Drifts in Grimes, IA. Photo taken by Ken<br />
Podrazik<br />
Figure 5 (left): Map <strong>of</strong> NWS homepage listed a<br />
wide area <strong>of</strong> blizzard warnings, winter storm<br />
warnings, winter wea<strong>the</strong>r advisories, <strong>and</strong> wind<br />
chill warnings across <strong>the</strong> majority <strong>of</strong> <strong>the</strong> central<br />
United States.<br />
Figure 6 (right): Visible satellite image Friday<br />
December 10, 2009.
Volume 4, Issue 1<br />
Page 11<br />
CS is termed as such because its results are weighted heavily toward<br />
<strong>Spring</strong> Flood Outlooks continued from page 9<br />
this year's current hydrologic conditions. Thus, you can consider <strong>the</strong><br />
CS probabilities as <strong>the</strong> actual risk for <strong>the</strong> coming three months <strong>of</strong> this<br />
year. HS is termed as such because its results are weighted much less by this year's current hydrologic conditions, <strong>and</strong> instead<br />
are weighted heavily by 60 years' worth <strong>of</strong> observed temperature <strong>and</strong> precipitation data. Since several decades' worth <strong>of</strong><br />
observed temperature <strong>and</strong> precipitation data is, by definition, climatology, you can interpret <strong>the</strong> HS probabilities as <strong>the</strong> “normal”<br />
or “climatological” risk.<br />
We <strong>the</strong>n plot <strong>the</strong> data for both CS <strong>and</strong> HS on an exceedance probability graph. <strong>The</strong> x-axis contains <strong>the</strong> exceedance probabilities<br />
<strong>and</strong> <strong>the</strong> y-axis contains <strong>the</strong> crest values. See Figure 1 for <strong>the</strong> exceedance probability graph for <strong>the</strong> Cedar River at Waterloo.<br />
<strong>The</strong> CS data is plotted on a black line with filled-in triangles. <strong>The</strong> HS data is plotted on a blue line with filled in circles.<br />
<strong>The</strong> valid time period <strong>of</strong> this graph is from March 5, 2010 through May 7, 2010. One can use <strong>the</strong> graph to determine <strong>the</strong> probability<br />
<strong>of</strong> exceeding a given crest value. Or, one can determine a crest value corresponding to a given exceedance probability.<br />
For example, to determine <strong>the</strong> probability <strong>of</strong> exceeding 15 feet, read across from <strong>the</strong> value <strong>of</strong> 15 feet on <strong>the</strong> y-axis. Find where<br />
it intersects <strong>the</strong> CS <strong>and</strong> HS plots, <strong>the</strong>n drop down to <strong>the</strong> x-axis to determine <strong>the</strong> corresponding probabilities. In this example,<br />
<strong>the</strong> CS probability is 73% <strong>and</strong> <strong>the</strong> HS exceedance probability is 18%.<br />
If <strong>the</strong> CS probabilities are greater than <strong>the</strong> HS probabilities, <strong>the</strong>n our river forecast model is telling us <strong>that</strong> <strong>the</strong> actual risk <strong>of</strong><br />
flooding this year is greater than normal. In <strong>the</strong> above example, this year's risk <strong>of</strong> flooding is 73%, compared to <strong>the</strong> normal risk<br />
<strong>of</strong> 18%. In o<strong>the</strong>r words, this year's risk <strong>of</strong> flooding is 55% greater than normal.<br />
Although <strong>the</strong>se outlooks are most popular from late<br />
winter into <strong>the</strong> spring snow melt season, we do<br />
update <strong>the</strong>m year-round <strong>and</strong> around <strong>the</strong> first <strong>of</strong><br />
each month. Just like our spring flood outlook,<br />
each updated monthly outlook covers <strong>the</strong> coming<br />
three months. You can use <strong>the</strong>se outlooks to determine<br />
<strong>the</strong> risk <strong>of</strong> flooding at your river forecast<br />
points <strong>of</strong> interest. You can find <strong>the</strong> probability <strong>of</strong><br />
exceedance information on our Web site<br />
(www.wea<strong>the</strong>r.gov/desmoines). In <strong>the</strong> left h<strong>and</strong><br />
menu, use <strong>the</strong> Rivers & Lakes link to call up information<br />
for your desired river forecast point. Click<br />
on <strong>the</strong> tab named “Chance <strong>of</strong> Exceeding Levels<br />
During Entire Period.”<br />
For more information, or if you have questions, feel<br />
free to contact me at jeff.zogg@noaa.gov.<br />
Figure 1.<br />
Exceedance probability<br />
graph for <strong>the</strong> Cedar<br />
River at Waterloo<br />
for <strong>the</strong> period from<br />
March 8, 2010 to<br />
June 6, 2010.<br />
Severe Wea<strong>the</strong>r Awareness Week: April 5-9 by Aubry Wilkins, Meteorologist Intern<br />
As winter finally draws to a close, it can only mean one thing: spring is right around <strong>the</strong> corner. And with spring comes severe<br />
wea<strong>the</strong>r. To help prepare Iowans for <strong>the</strong> upcoming severe wea<strong>the</strong>r season, Iowa Homel<strong>and</strong> Security <strong>and</strong> Emergency Management<br />
<strong>and</strong> <strong>the</strong> National Wea<strong>the</strong>r Service have declared <strong>the</strong> week <strong>of</strong> April 5-9, 2010 as Severe Wea<strong>the</strong>r Awareness Week. Severe<br />
Wea<strong>the</strong>r Awareness Week is an annual event which reminds Iowans <strong>that</strong> severe wea<strong>the</strong>r is a part <strong>of</strong> living in Iowa, <strong>and</strong><br />
<strong>that</strong> underst<strong>and</strong>ing <strong>the</strong> risks <strong>and</strong> how to respond to <strong>the</strong>m saves lives.<br />
Topics covered this year during Severe Wea<strong>the</strong>r Awareness Week include: flash flooding, receiving warnings, tornadoes, severe<br />
thunderstorms <strong>and</strong> family preparedness. <strong>The</strong> National Wea<strong>the</strong>r Service will issue informative public information statements<br />
each day about <strong>the</strong> daily topic. This year, Severe Wea<strong>the</strong>r Awareness Week is getting a fresh look, with additional information<br />
posted on our website at: www.wea<strong>the</strong>r.gov/desmoines.<br />
<strong>The</strong> highlight <strong>of</strong> <strong>the</strong> week will be <strong>the</strong> statewide tornado drill on Wednesday April 7, 2010. <strong>The</strong> drill will begin around 10:00 a.m.<br />
<strong>and</strong> conclude by 11:00 a.m. for all 99 counties in Iowa. All five National Wea<strong>the</strong>r Service <strong>of</strong>fices which serve Iowa will participate<br />
in <strong>the</strong> drill.<br />
Additional information about Severe Wea<strong>the</strong>r Awareness Week <strong>and</strong> links to preparedness material <strong>and</strong> educational material<br />
regarding severe wea<strong>the</strong>r can be found at: www.wea<strong>the</strong>r.gov/desmoines. Ano<strong>the</strong>r excellent source <strong>of</strong> information can be found<br />
at <strong>the</strong> BeReadyIowa.org website: www.BeReadyIowa.org.<br />
Media coverage is vital to <strong>the</strong> success <strong>of</strong> Severe Wea<strong>the</strong>r Awareness Week <strong>and</strong> will be greatly appreciated. Please contact Jeff<br />
Johnson at <strong>the</strong> National Wea<strong>the</strong>r Service by telephone at (515) 270-4501 or by e-mail at jeff.johnson@noaa.gov to schedule a<br />
flood safety <strong>and</strong>/or severe wea<strong>the</strong>r preparedness interview, or to partner in preparedness activities or productions.
Page 12<br />
NATIONAL<br />
WEATHER SERVICE<br />
DES MOINES IA<br />
9607 NW Beaver<br />
Johnston IA 50131-1908<br />
Phone: 515-270-4501<br />
Fax: 515-270-3850<br />
Visit us at:<br />
www.wea<strong>the</strong>r.gov/dmx<br />
Central Iowa<br />
<strong>The</strong> Wea<strong>the</strong>r Whisper<br />
Editors:<br />
Ben Moyer<br />
Ken Podrazik<br />
NWS Continues Call for Flood Impact Photos by Brad Small, Senior<br />
In <strong>the</strong> fall <strong>of</strong> 2009, <strong>the</strong> National Wea<strong>the</strong>r Service (NWS) in Des Moines began a very ambitious<br />
project hoping to document impacts from flooding <strong>that</strong> have affected our 47 river forecast points as<br />
well as o<strong>the</strong>r larger streams in central Iowa. <strong>The</strong> goal <strong>of</strong> <strong>the</strong> project is to ga<strong>the</strong>r detailed flooding<br />
effects from as many locations as possible <strong>and</strong> correlate those impacts with archived river stages.<br />
This information will <strong>the</strong>n be included in our Flood Warnings <strong>and</strong> Flood Statements giving our users<br />
guidelines regarding what infrastructure will be affected when water levels reach certain heights.<br />
Impacts include water threatening or inundating roads, farml<strong>and</strong>, buildings, or bridges.<br />
We have received several great photos already with this project, but we are still missing many impacts<br />
along forecast points within central Iowa. If you have any photos taken during recent flood<br />
events (such as 2008 <strong>and</strong> this year‟s flood from snowmelt ), <strong>the</strong> NWS would greatly appreciate<br />
receiving a copy <strong>of</strong> those to augment our project. <strong>The</strong> photos should detail specific impacts such<br />
as when flooding covers a bridge or road, or is affecting buildings or a significant amount <strong>of</strong> farml<strong>and</strong>.<br />
In addition, please provide <strong>the</strong> name <strong>of</strong> <strong>the</strong> river or creek, <strong>the</strong> date <strong>and</strong> approximate time <strong>the</strong><br />
photo was taken. O<strong>the</strong>r information such as building or street names is greatly appreciated. Any<br />
pictures within <strong>the</strong> past five years from o<strong>the</strong>r flooding events would be extremely helpful. An example<br />
is provided below. A map <strong>of</strong> <strong>the</strong>se locations can be found by visiting our Advanced Hydrologic<br />
Prediction Service.<br />
Please submit pictures via e-mail to<br />
dmx.spotter@noaa.gov with <strong>the</strong> subject<br />
titled „Impact Flooding Pictures‟<br />
or via hard copy to our <strong>of</strong>fice at:<br />
National Wea<strong>the</strong>r Service<br />
Impact Statement Project<br />
9607 NW Beaver Dr.<br />
Johnston, IA 50131<br />
Meteorologist, <strong>and</strong> Ken Podrazik, General Forecaster<br />
Des Moines River <strong>and</strong> tributaries<br />
(specifically outside Polk County)<br />
Raccoon River<br />
North Raccoon River<br />
Middle Raccoon River<br />
South Raccoon River<br />
East Fork Des Moines River<br />
Boone River<br />
Beaver Creek<br />
Walnut Creek<br />
Fourmile Creek<br />
North River<br />
South River<br />
Cedar Creek<br />
White Breast Creek<br />
English Creek<br />
Cedar River <strong>and</strong> tributaries<br />
Winnebago River<br />
Shell Rock River<br />
Beaver Creek<br />
Blackhawk Creek<br />
West Fork Cedar River<br />
Iowa River <strong>and</strong> tributaries<br />
South Fork Iowa River<br />
South Skunk River <strong>and</strong> tributaries<br />
Squaw Creek<br />
Indian Creek<br />
Chariton River <strong>and</strong> tributaries<br />
South Fork Chariton River<br />
Thompson River<br />
East Fork 102 River<br />
Body <strong>of</strong> Water: Iowa River<br />
Location: Rowan Gage site on 200 th Street in Rowan, IA<br />
Date: March 16, 2010<br />
Time: Approximately 900am CDT