Rainfall Totals from the Hermosa Flash Flood of 17 August 2007
Rainfall Totals from the Hermosa Flash Flood of 17 August 2007
Rainfall Totals from the Hermosa Flash Flood of 17 August 2007

Create successful ePaper yourself
Turn your PDF publications into a flip-book with our unique Google optimized e-Paper software.
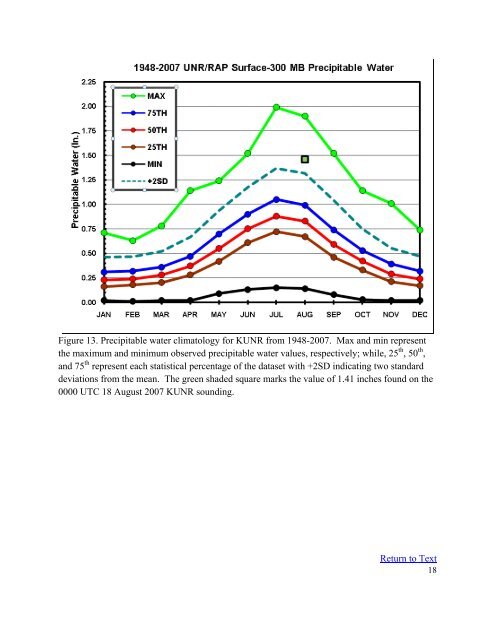
Figure 13. Precipitable water climatology for KUNR <strong>from</strong> 1948-<strong>2007</strong>. Max and min represent<br />
<strong>the</strong> maximum and minimum observed precipitable water values, respectively; while, 25 th , 50 th ,<br />
and 75 th represent each statistical percentage <strong>of</strong> <strong>the</strong> dataset with +2SD indicating two standard<br />
deviations <strong>from</strong> <strong>the</strong> mean. The green shaded square marks <strong>the</strong> value <strong>of</strong> 1.41 inches found on <strong>the</strong><br />
0000 UTC 18 <strong>August</strong> <strong>2007</strong> KUNR sounding.<br />
Return to Text<br />
18