THE WEATHER WHISPER - Central Region Headquarters - NOAA
THE WEATHER WHISPER - Central Region Headquarters - NOAA
THE WEATHER WHISPER - Central Region Headquarters - NOAA

Create successful ePaper yourself
Turn your PDF publications into a flip-book with our unique Google optimized e-Paper software.
Volume 7, Issue 1 The Weather Whisper Spring 2013<br />
National Weather Service Des Moines’ Newsletter<br />
<strong>THE</strong> WEA<strong>THE</strong>R <strong>WHISPER</strong><br />
NWS Des Moines Hosts<br />
Decision Support<br />
Services Workshop<br />
by Mindy Beerends, General Forecaster<br />
In mid-January NWS Des Moines hosted a<br />
Decision Support Services Workshop, with<br />
a second workshop postponed until late<br />
April due to a winter storm in late February.<br />
Many officials from the central Iowa<br />
emergency management community and<br />
one first responder were in attendance at<br />
the first workshop with several more core<br />
partners registered for the second. The<br />
workshop focused on the partnership between<br />
the National Weather Service and<br />
the emergency management community<br />
and how we can work together to provide<br />
life-saving information during hazardous<br />
weather situations.<br />
Iowa State Emergency Operations Center<br />
(EOC) or remotely via the internet or telephone.<br />
The workshop discussed both current and<br />
future DSS activities both here at the<br />
NWS Des Moines office and throughout<br />
the NWS as a whole. Some of the current<br />
services provided by the NWS Des Moines<br />
are partner webinars prior to major<br />
events, web briefings prior to high-end<br />
events, special event support, post-event<br />
services such as storm damage surveys,<br />
staffing of the State EOC when needed,<br />
state agency briefings and training. Over<br />
the past 20 years, NWS Des Moines has<br />
had to provide DSS to the State EOC nine<br />
times for a variety of activations. The<br />
past three activations involved virtual<br />
support since the events have been of<br />
long duration. Training opportunities have<br />
consisted of annual storm spotter training<br />
presentations and, new for 2013, a webinar<br />
training series for emergency managers<br />
and first responders.<br />
IN THIS ISSUE<br />
Impact Based<br />
Warnings<br />
Severe Weather<br />
Awareness Week<br />
Page 2<br />
Page 3<br />
Spotter Training Page 3<br />
Spring Flood Outlook Page 4<br />
WEA Pages 4-5<br />
Word Search Page 5<br />
Fire Weather Page 6<br />
Employee Spotlight Page 6<br />
Co-OP Awards Page 7<br />
Winter Storms<br />
Summary Maps<br />
Pages 8-9<br />
Climate Data Pages 9-10<br />
Spring to Summer<br />
Outlook<br />
Spring 2013<br />
Pages 11-12<br />
Decision Support Services (DSS) consist<br />
of the NWS Des Moines becoming part of<br />
a team of decision makers and providing<br />
concise interpretation of weather data in<br />
a fast, reliable and accurate manner to<br />
the core partners such as the emergency<br />
management community. The primary<br />
goal of the services would be to provide<br />
focused support to the decision makers<br />
for high impact events, emergencies, or<br />
disasters where weather is a factor in the<br />
decision making. The service and support<br />
could be performed on-site such as at the<br />
Communication is intricately woven<br />
throughout the process and NWS Des<br />
Moines uses many different types of communication<br />
to interact with core partners<br />
and the public. These include a range of<br />
communication types such as the telephone,<br />
<strong>NOAA</strong> Weather Radio, amateur<br />
radio, and an 800 MHz radio and newer<br />
avenues such as internet chat, email, text<br />
messages, social media and online reporting<br />
forms. All of these allow us to be connected<br />
better than ever before with the<br />
public and our core partners.<br />
(Continued on page 2)<br />
Editors<br />
Ken Podrazik<br />
Aubry Bhattarai<br />
Cover photo<br />
courtesy of Jim Lee
The Weather Whisper Spring 2013<br />
Volume 7, Issue 1<br />
Impact Based Warnings by Jeff Johnson, Warning Coordination Meteorologist<br />
On April 1, 2013, the National Weather Service in Des Moines, IA will start an Impact Based Warnings (IBW)<br />
demonstration or test. In 2012, National Weather Service offices in Missouri and eastern Kansas conducted a test<br />
project concerning wording contained in National Weather Service tornado and severe thunderstorm warnings.<br />
The test was successful to the point where it will be expanded across 11 states, including Iowa, in 2013. The goal<br />
of the test is to better communicate threats to partners and the public through changes to warning wording and<br />
an expansion of “tags.” All changes to tornado and severe thunderstorm warnings will work within the boundaries<br />
of well-established weather enterprise infrastructure to ensure easy absorption into mass communication channels.<br />
A significant change will be the expansion of “event tags” at the bottom of tornado and severe thunderstorm<br />
warnings. The additional event tags will contain more specific information about threats as a quick means to provide<br />
partners with potential high impact risk signals that prompt faster protective actions. Other changes include<br />
enhancements to the warning wording to make it easier to identify the most valuable information.<br />
Tornado Tag:<br />
TORNADO...RADAR<br />
INDICATED<br />
TORNADO...OBSERVED<br />
Tornado Damage Threat Tag<br />
New Warning Tags—Start April 1st!<br />
Used When:<br />
Evidence on radar and near storm environment is supportive of a<br />
tornado, but there is no confirmation.<br />
A tornado is confirmed by spotters or through other means.<br />
NO TAG<br />
TORNADO DAMAGE<br />
THREAT...CONSIDERABLE<br />
TORNADO DAMAGE<br />
THREAT...CATASTROPHIC<br />
Tornado Tag in Severe<br />
Thunderstorm Warnings<br />
TORNADO...POSSIBLE<br />
Use most of the time, when tornado damage possible within the warning<br />
polygon. Tornado duration generally expected to be short-lived.<br />
There is credible evidence that a tornado, capable of producing<br />
considerable damage, is imminent or ongoing.<br />
This is the same as a tornado emergency! A severe threat to human life<br />
and catastrophic damage from a tornado is occurring. Only used with a<br />
reliable confirmation of a violent tornado.<br />
A severe thunderstorm has potential for producing a tornado although<br />
forecaster confidence is not high enough to prompt a tornado warning.<br />
DSS Workshop<br />
(Continued from page 1)<br />
Over the past year the NWS has put forth a strategic plan, “Build a Weather-Ready Nation.” An overarching goal<br />
for this plan is for the NWS to focus on DSS, improve technology for tracking and forecasting storms, expand<br />
ways of disseminating information, and increase preparedness for weather events both locally and nationally. To<br />
achieve this goal, there are many pilot projects that have been put in place across the NWS over the past year to<br />
study their functionality for implementation nationwide in the future. Some of these projects include the development<br />
of a national NWS Operations Center and <strong>Region</strong>al Operations Centers which function similarly to state<br />
EOCs in that they take information from around the region/nation and brief high level cabinet member government<br />
officials of regional/national hazardous weather situations.<br />
DSS goals for the future also include integrating social science principles into warning systems so that we can<br />
better prepare communities and the public for hazardous weather. The NWS will continue to use state-of-the-art<br />
technology and science to provide the best services possible. This will include development of digital datasets<br />
that can be accessed by all and a shift from specific product-centric mindset to an impact-based mindset when<br />
issuing products. Overall the workshop was a success and allowed us to gain a better understanding of what the<br />
emergency management community needs from us to better serve their specific entities and how we can all<br />
work together to build community resilience to hazardous weather!<br />
2
Volume 7, Issue 1 The Weather Whisper Spring 2013<br />
Severe Weather Awareness Week 2013 by Aubry Bhattarai, General Forecaster<br />
With spring time right around the corner, we begin to think about longer days<br />
and outdoor activities. But spring time also brings another severe weather<br />
season to Iowa. To help Iowans prepare for the hazards of spring, the National<br />
Weather Service and Iowa Homeland Security and Emergency Management<br />
have declared the week of March 25-29 as Severe Weather Awareness Week.<br />
Please note this week is earlier than in previous years. The dates have changed<br />
to correspond with the state of Nebraska’s Severe Weather Awareness Week.<br />
Severe Weather Awareness Week is an annual event to remind Iowans that<br />
severe weather is part of being in Iowa and that understanding the risks and<br />
how to respond can save lives.<br />
Shelf cloud over Polk County, Iowa in<br />
2012. Courtesy Tom Reis.<br />
Tornado near New Hartford, IA in<br />
2008. Courtesy Rod Donavon.<br />
During Severe Weather Awareness Week, the National Weather Service will<br />
promote severe weather safety and preparedness by issuing informative Public<br />
Information Statements. Daily topics will include flash flooding, receiving<br />
warnings, tornadoes, severe thunderstorms and family preparedness. Severe<br />
Weather Awareness Week is an excellent time to review your severe weather<br />
preparedness plans and to create a preparedness kit. You can find more<br />
information about the weather hazards in Iowa on new preparedness pages<br />
developed by the National Weather Service Des Moines at: www.weather.gov/<br />
dmx/?n=preparedness. You can find additional information at:<br />
www.BeReady.Iowa.Gov.<br />
The highlight of the week will be the statewide tornado drill on Wednesday<br />
March 27, 2013. This will begin around 10:00 am and conclude by 11:00 am for<br />
all 99 Iowa counties. All five Iowa National Weather Service offices which serve<br />
Iowa will participate in the drill. Media coverage is vital to the success of Severe<br />
Weather Awareness Week and is greatly appreciated. Please contact Jeff<br />
Johnson at the National Weather Service Des Moines by e-mail at<br />
jeff.johnson@noaa.gov to schedule a flood safety and/or a severe weather<br />
preparedness interview, or to partner in preparedness activities or productions.<br />
Spotter Training 2013<br />
by Jeff Johnson, Warning Coordination Meteorologist<br />
The National Weather Service (NWS) and emergency managers will be<br />
hosting spotter training classes across central Iowa this spring. This year,<br />
there will be a combination of in-person spotter training classes scattered<br />
across central Iowa and webinar-based distance learning classes. Inperson<br />
spotter training classes will be offered in larger cities and towns<br />
and in several rural counties and small towns. Every county in the NWS<br />
Des Moines County Warning Area will have an in-person spotter training<br />
class at least every other year. To supplement in-person training, the NWS<br />
will conduct weekly distance learning webinars using the join.me application.<br />
All webinars are open to all spotters!<br />
One advanced spotter class will be offered on April 11. The advanced class<br />
will build on what is taught in the regular class. It is intended for those<br />
who wish to do mobile spotting and desire a deeper understanding of meso<br />
-scale and storm-scale meteorology as it relates to storm spotting. Spotters<br />
interested in attending this class should attend a regular spotter class<br />
either in-person or by webinar. The advanced presentation will also be offered<br />
in webinar form on April 16.<br />
For schedule information and to learn more about how to view a webinar,<br />
please visit our news story on our website titled 2013 Spotter Training.<br />
Spotter training in Warren County, IA in 2013.<br />
Spotter training in Polk County, IA in 2012.<br />
3
The Weather Whisper Spring 2013<br />
Volume 7, Issue 1<br />
2013 Spring Flood<br />
Outlook<br />
by Jeff Zogg, Senior Service Hydrologist<br />
The risk of flooding this spring is<br />
presently near or below average<br />
along all streams in the NWS Des<br />
Moines service area. The reason for<br />
this outlook can be understood by<br />
examining the major factors that<br />
influence the risk of flooding. Those<br />
factors are listed below, along with<br />
their current conditions as of March<br />
6, and how each factor contributes<br />
to the spring flooding risk.<br />
<br />
Snow cover. The snow pack is<br />
near or above average for this time<br />
of year. The current snow cover<br />
conditions may slightly increase the<br />
risk of flooding.<br />
<br />
Soil moisture. Soil moisture is<br />
below average (i.e., at or below the<br />
30th percentile). The driest conditions<br />
are in northwest Iowa where<br />
values are at or below the 10th percentile.<br />
The current soil moisture<br />
conditions would tend to lower the<br />
risk of flooding.<br />
<br />
Frost depth. Ground frost has<br />
penetrated much more deeply this<br />
year than last year. Frost depths<br />
Wireless Emergency Alerts to<br />
Continue for Severe Weather<br />
Season by Aubry Bhattarai, General Forecaster<br />
range from around 10 inches in<br />
southern Iowa, to 20 or more inches<br />
in northern parts of the state. The<br />
current frost depth conditions would<br />
tend to increase the risk of flooding.<br />
<br />
River levels. River levels are<br />
generally below or much below average<br />
(i.e., 24th percentile or lower).<br />
The current river level conditions<br />
would tend to decrease the risk<br />
of flooding.<br />
Throughout the winter season, some people may have<br />
experienced receiving National Weather Service warnings<br />
on their cell phones. These alerts are Wireless<br />
Emergency Alerts (WEA) and select high impact NWS<br />
warnings are sent to cell phones. Additional alerts from<br />
other government agencies, such as FEMA, may also be<br />
sent to your phone. Here is how it works: If you are at<br />
home, or traveling in an area where a warning has<br />
been issued, your phone will receive alerts broadcast by<br />
nearby cell towers. If your phone is enabled to receive<br />
alerts, your phone will receive an alert that resembles a<br />
text message, the message will be no longer than 90<br />
characters. The alert will have a special tone and vibration,<br />
repeated twice, so that you will be able to tell it<br />
apart from a regular message. If you receive an alert,<br />
you should follow any action advised by the emergency<br />
message and seek additional details.<br />
Also, “concrete frost” exists across<br />
northern Iowa, especially north of<br />
U.S. Highway 20. The combination<br />
of frozen ground as well as ice in the<br />
upper-most layer of the ground has<br />
produced this situation. Runoff from<br />
snow melt and rainfall will be higher<br />
than average until the ground<br />
thaws. Thus, the risk of flooding in<br />
that region will be higher than average,<br />
again until the ground thaws.<br />
The risk of flooding cannot be determined<br />
solely by considering the current<br />
conditions. We also need to<br />
consider the expected conditions<br />
going forward, such as precipitation.<br />
The precipitation outlook for March<br />
through May calls for equal chances<br />
of above, near and below average<br />
precipitation across much of the<br />
NWS Des Moines service area. With<br />
the absence of no strong indication<br />
regarding precipitation trends, the<br />
impact on the risk of flooding is inconclusive.<br />
Of course heavy rainfall<br />
may lead to localized flooding or<br />
flash flooding especially if it falls in<br />
the area of “concrete frost” north of<br />
U.S. Highway 20.<br />
Finally, it should be noted that ice is<br />
prevalent on some streams. If river<br />
levels do rise, breakup ice jams may<br />
result. Typically breakup ice jams<br />
can cause flooding and sometimes<br />
flash flooding. With river levels running<br />
below average, though, the risk<br />
of flooding due to them will be lower<br />
than average however.<br />
On March 7, NWS Des Moines issued<br />
the second and final spring flood<br />
outlook for the season. Refer to the<br />
NWS Des Moines Web site at http://<br />
www.weather.gov/desmoines<br />
more information.<br />
for<br />
severe weather season, alerting for tornado warnings<br />
and flash flood warnings. If you wish to receive these<br />
potentially lifesaving messages, check to ensure they<br />
are activated on your phone; some people may have<br />
deactivated the alerts during the winter season.<br />
For more information about wireless alerts, visit:<br />
http://www.crh.noaa.gov/news/display_cmsstory.php?<br />
storyid=83063&source=0<br />
The service is free of charge and messages will not<br />
count towards texting or data limits on your wireless<br />
plan. It comes enabled on newer cell phones depending<br />
on the carrier. WEA messages will continue during the<br />
On the following page is a list of National Weather Service<br />
warnings which will be sent via Warning Emergency Alerts to cell<br />
phones. The warning type and sample message are shown.<br />
4
Volume 7, Issue 1 The Weather Whisper Spring 2013<br />
Warning Type:<br />
Tsunami Warning<br />
Tornado Warning<br />
Extreme Wind Warning<br />
Flash Flood Warning<br />
Hurricane Warning<br />
Tyhoon Warning<br />
Blizzard Warning<br />
Ice Storm Warning<br />
Lake Effect Snow Warning<br />
Dust Storm Warning<br />
CMAS Message:<br />
Tsunami Warning in this area. Avoid coastal areas. Check local media. –NWS<br />
Tornado Warning in this area til hh:mm tzT. Take shelter now. –NWS<br />
Extreme Wind Warning this area til hh:mm tzT ddd. Take shelter. –NWS<br />
Flash Flood Warning this area til hh:mm tzT. Avoid Flooded areas. Check local media. –NWS<br />
Hurricane Warning this area til hh:mm tzT ddd. Check local media and authorities. –NWS<br />
Typhoon Warning this area til hh:mm tzT ddd. Check local media and authorities. –NWS<br />
Blizzard Warning this area til hh:mm tzT ddd. Prepare. Avoid Travel. Check media. –NWS<br />
Ice Storm Warning this area til hh:mm tzT ddd. Prepare. Avoid Travel. Check media. –NWS<br />
Lake Effect Snow Warning this area til hh:mm tzT ddd. Avoid Travel. Check media. –NWS<br />
Dust Storm Warning this area til hh:mm tzT ddd. Avoid travel. Check local media. –NWS<br />
List of National Weather Service warnings which will be sent via Warning Emergency Alerts to cell phones. The warning type and<br />
sample message are shown.<br />
Cloud Types Word Search<br />
R O O U S U R U C N C A A S S<br />
D S U L U M U C O T L A L U S<br />
D D U O L C F L E H S R T T I<br />
T D S B U T N S T F U A O A L<br />
S U L U M U C O T A R T S R S<br />
A O M O U I L A N T U R T T W<br />
D L A U C S N U S A O F R S A<br />
R C U U O U P O U L A A A O V<br />
I L O R R D R N L R T C T B E<br />
T L S T R R A C D U L U U M C<br />
T A S A I L L N S R M M S I L<br />
L W F C C O W U R U L U C N O<br />
U T C O U O U U O O L L C R U<br />
O R T D D M A M M A T U S A D<br />
L R O T O T C I R R U S I M E<br />
altocumulus<br />
altostratus<br />
cirrocumulus<br />
cirrostratus<br />
cirrus<br />
cumulonimbus<br />
cumulus<br />
downdraft<br />
mammatus<br />
nimbostratus<br />
roll cloud<br />
shelf cloud<br />
stratus<br />
stratocumulus<br />
tornado<br />
updraft<br />
wall cloud<br />
wave cloud<br />
Answer Key<br />
5
The Weather Whisper Spring 2013<br />
Volume 7, Issue 1<br />
Fire Weather Products Overview<br />
by Frank Boksa, General Forecaster<br />
As Fire Weather Season ramps up for 2013 I wanted<br />
to take a minute to remind everyone of the products<br />
the National Weather Service (NWS) issues and<br />
what they are intended for.<br />
The Fire Weather Planning Forecast is a product that<br />
is issued daily by 6 AM from March 1 through<br />
November 15. During peak spring (March 1-June 1)<br />
and fall (September 1-November 15) seasons this<br />
product is issued twice daily by 6 AM and 4 PM. This<br />
product is for decision support for those responsible<br />
for planning prescribed burns and to the general<br />
public who plans a legal burn on their property. The<br />
product is a 7 day forecast with the first 36 hours<br />
broken into a tabular format that defines, in 12 hour<br />
increments, specific parameters such as relative<br />
humidity, precipitation, mixing height, transport<br />
winds, the grassland fire danger index as well as the<br />
Haines index.<br />
The Fire Weather Watch is a public product that the<br />
NWS issues from 24 to 48 hours in advance of<br />
whenever there is a reasonable level of confidence<br />
that an area will have sustained wind speeds at or<br />
above 25 mph along with a minimum relative<br />
humidity of 25 percent or less and fuels (grasses<br />
and tinder) are sufficiently dry that they will quickly<br />
catch fire and/or allow for a fire to spread quickly.<br />
The intention of this product is for decision support<br />
for those who are in charge of any burning taking<br />
place in a county either on private or public land. It<br />
should raise a level of concern that any burning<br />
could lead to fires that get out of control. In general<br />
if a watch is in place, people planning a burn should<br />
consider alternative dates.<br />
The Red Flag Warning is a public fire weather<br />
warning product that the NWS issues whenever we<br />
are expecting wind speeds at or above 25 mph in<br />
combination with a relative humidity of 25 percent<br />
or less and dry fuels. This product is a warning to<br />
people that it is dangerous to burn and burning is<br />
not recommended. The Red Flag Warning is issued<br />
up to 24 hours in advance of when we expect<br />
meteorological conditions and dryness of fuels to<br />
create an explosive environment for fires to develop<br />
or spread. During a Red Flag Warning event,<br />
decision makers in the fire weather community as<br />
well as state and county officials may want to<br />
consider burn bans or to begin contingency planning<br />
for additional staff to handle fires that could quickly<br />
get out of control.<br />
For marginal fire weather conditions the NWS may<br />
issue a Special Weather Statement. The intent of<br />
this product is to convey to the general public that<br />
there is a concern for fire danger and that they<br />
should remain alert for possible upgrades to a red<br />
flag warning.<br />
The Spot Forecast is not a public product. Only<br />
people from government agencies or public agencies<br />
with a valid contract to do work for a government<br />
agency can request a spot forecast.<br />
For information on the 2013 Annual Operating Plan<br />
and to view forecasts and fire weather planning<br />
tools, please visit our website at:<br />
http://www.crh.noaa.gov/dmx/firewx.php<br />
Employee Spotlight Kurt Kotenberg, Meteorologist Intern<br />
Kurt Kotenberg was born and raised in Madison, WI and graduated from<br />
Wisconsin-Milwaukee with both a B.S. and a Master’s Degree in<br />
Atmospheric Sciences. Under the guidance of Dr. Vincent Larson, Kurt coauthored<br />
two published papers relating to altocumulus clouds and their<br />
radiative properties. At UWM, Kurt played on the Men’s Volleyball team for<br />
his first two years and went on many a storm chase. After graduating, Kurt<br />
spent four years in front of the camera as a broadcast meteorologist at<br />
WEAU-TV (NBC Affiliate) in Eau Claire, WI. While Kurt enjoyed being on the<br />
TV and radio, he could make a bigger and better impact on serving the<br />
public from the National Weather Service. So in 2010, Kurt decided to<br />
make the career switch and was hired as a Meteorologist at the National<br />
Weather Service forecast office in Midland, Texas. Kurt learned a lot in the<br />
two years he spent in Midland, especially about fire weather; since in 2011,<br />
over 1 million acres of land were burned in hot, dry west Texas.<br />
Kurt’s better half, Erin, made the move from Wisconsin to Texas with him<br />
as well. This past June they were married in her hometown of Black River<br />
Falls, WI. Erin taught 10th grade World History in Midland and got her<br />
teaching license from UW-Eau Claire in Broadfield Social Studies/World<br />
History. Kurt and Erin are both beyond excited to have this opportunity to<br />
move back up north and are looking forward to enjoying all of the great<br />
experiences Iowa has to offer!<br />
Kurt Kotenburg: Latest Addition to the<br />
NWS Des Moines Team<br />
6
Volume 7, Issue 1 The Weather Whisper Spring 2013<br />
2013 Cooperative Observer Length of Service Awards<br />
by Brad Fillbach, Hydro-Meteorological Technician/Cooperative Program Manager<br />
John Beltz (left) of Jefferson, Iowa receives<br />
his 15 year length of service award from Jeff<br />
Johnson (right) WCM, WFO Des Moines.<br />
Randy Wheatley of Adair, Iowa receives his<br />
30 year length of service award. Aubry<br />
Bhattarai, general forecaster, WFO Des<br />
Moines, made the presentation.<br />
Craig Hall (right) of Brooklyn, Iowa receives his 15 year Length of<br />
Service award from Chris Southerlin (left), electronics technician,<br />
WFO Des Moines.<br />
Jim Lee (left), general forecaster, WFO Des Moines, presents Paul<br />
Fobian of New Hartford, IA with his 35 year Length of Service<br />
award.<br />
Fun Fact:<br />
Des Moines<br />
climate<br />
statistics<br />
comparing<br />
2012 to 2013<br />
March 2012 High 2013 High 2012 Low 2013 Low 2012 Average 2013 Average<br />
14 81 52 57 28 69 40<br />
15 81 63 45 32 63 48<br />
16 84 39 58 28 71 34<br />
17 83 41 63 23 73 32<br />
18 83 36 62 22 73 29<br />
19 81 41 60 18 71 30<br />
7
The Weather Whisper Spring 2013<br />
Volume 7, Issue 1<br />
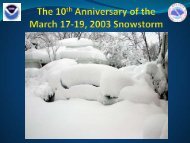
Summary of the 2012-13<br />
Winter Storms<br />
by Ken Podrazik, General Forecaster<br />
The first major winter storm of the 2012-2013 winter season was<br />
a major blizzard that brought several inches of snow across<br />
central Iowa on December 19-20, 2012. The heaviest band of<br />
snow set up from just southwest of Des Moines and extended<br />
northeast through Waterloo. There were several reports of a foot<br />
of snow from eastern Dallas County to Polk County northeast into<br />
Marshall County. Visibility of less than a quarter mile to even<br />
white-out conditions occurred overnight Wednesday night the<br />
19th into Thursday morning on the 20th. Thundersnow was<br />
reported at several locations across central Iowa late Wednesday<br />
night the 19th. Click image to enlarge.<br />
A much anticipated winter storm on Thursday February 21, 2013,<br />
brought anywhere from 5 to 10 inches of snow across much of<br />
Iowa, with the heaviest snow band set up across northwest Iowa.<br />
Click image to enlarge.<br />
A long duration band of moderate to heavy snow developed over<br />
Missouri and shifted northward into <strong>Central</strong> and Northeast Iowa<br />
on February 26, 2012. A very sharp edge from little or no snow<br />
accumulations to heavy snow occurred with this storm. There<br />
were several counties where the northwest portions received<br />
only a trace to 2 inches, while the southeast sections received<br />
anywhere from 6 to 10 inches. Guthrie, Hamilton, and Butler<br />
Counties are marked with a star indicating the sharp edge of the<br />
heaviest snowfall across these counties. Click image to enlarge.<br />
8
Volume 7, Issue 1 The Weather Whisper Spring 2013<br />
March 10-11, 2013 another band of heavy snow dropped anywhere from 5 to 12 inches across west central to<br />
north central Iowa. The heaviest snowfall was located over portions of northwest Iowa where 11 to 14 inches<br />
accumulated from Fort Dodge to Cherokee, Iowa. Click image to enlarge.<br />
Climatological Data for November 2012 through February 2013<br />
Location<br />
Month<br />
Average<br />
Temp<br />
Departure Highest Lowest Rain / Snow Departure<br />
Nov 40.9°F +3.0°F 73°F (9 th ) 16°F (26 th ,25 th ) 2.29” / T +0.19” / -4.5”<br />
Des<br />
Moines<br />
Dec 23.5°F -1.4°F 61°F (30 th ) 1°F (12 th ) 0.77” / 9.7” -0.56” / +2.0”<br />
Jan 18.5°F -1.9°F 41°F (5 th ) -3°F (21 st ) 1.07” / 12.8” +0.04” / +4.0”<br />
Feb 26.7°F +0.1°F 68°F (17 th ) -9°F (8 th ) 0.77” / 10.3” -0.42” / +2.1”<br />
Nov 34.2°F +1.4°F 70°F (9 th ) 11°F (27 th ,25 th ) 2.64” / M +0.68” / M<br />
Mason<br />
City<br />
Waterloo<br />
Ottumwa<br />
Dec 15.5°F -3.5°F 39°F (30 th ) -9°F (13 th ) 2.67” / M +1.59” / M<br />
Jan 10.7°F -3.2°F 32°F (29 th ,28 th ) -22°F (21 st ) 1.07” / M +0.09” / M<br />
Feb 19.6°F -1.0°F 56°F (17 th ) -15°F (10 th ,8 th ) 0.94” / M +0.02” / M<br />
Nov 36.8°F +1.7°F 70°F (9 th ) 13°F (26 th ) 1.51” / T -0.59” / -4.8”<br />
Dec 16.9°F -4.7°F 43°F (30 th ) -14°F (19 th ) 2.05” / 24.7” +0.94” / +17.2”<br />
Jan 13.7°F -2.4°F 33°F (17 th ,5 th ) -21°F (21 st ) 1.04” / 13.3” +0.20” / +5.1”<br />
Feb 21.7°F -0.9°F 62°F (17 th ) -15°F (10 th ) 1.72” / 9.2” +0.67” / +1.9”<br />
Nov 41.2°F +1.8°F 72°F (10 th ,9 th ) 16°F (26 th ) 1.10” / M -1.32” / M<br />
Dec 23.0°F -3.6°F 57°F (30 th ) -4°F (13 th ) 0.94” / M -0.38” / M<br />
Jan 17.8°F -4.2°F 39°F (5 th ) -7°F (21 st ) 0.40” / M -0.60” / M<br />
Feb 25.6°F -2.3°F 68°F (17 th ) -10°F (3 rd ) 1.03” / M -0.13” / M<br />
9
The Weather Whisper Spring 2013<br />
Volume 7, Issue 1<br />
Iowa Statewide Averages and Rankings for Temperature and<br />
Precipitation by Craig Cogil, Lead Forecaster<br />
Month<br />
Temperature<br />
Departure<br />
from Normal<br />
Rainfall<br />
Departure<br />
from Normal<br />
Temperature<br />
Ranking<br />
Precipitation<br />
Ranking<br />
December 2012 27.6°F +4.7°F 1.57” +0.23” 39 th Warmest 34 th Wettest<br />
January 2013 21.6°F +2.2°F 0.96” +0.04” 44 th Warmest 66 th Wettest<br />
February 2013 23.6°F -0.4°F 1.31” +0.26” 66 th Warmest 40 th Wettest<br />
Winter 2012-<br />
2013<br />
24.3°F +2.2°F 3.84” +0.53” 41 st Warmest 42 nd Wettest<br />
Rankings for December are based upon 140 years of records. The January and February numbers cover the past 141 years.<br />
All values are preliminary.<br />
Temperatures:<br />
Temperatures during meteorological winter<br />
(December-February) were generally above normal<br />
for the period. Readings were not nearly as warm<br />
or extreme as last winter when seasonal averages<br />
were around 6 degrees above normal. However,<br />
other than a few bursts of colder air, temperatures<br />
were fairly steady above normal for much of the<br />
winter. The warmest areas were in far southern<br />
and portions of eastern Iowa, which ran from 3 to 4<br />
degrees above normal. Overall, the winter season<br />
was 2.2 degrees above normal across Iowa which is<br />
the 42 nd warmest in the past 140 years.<br />
Precipitation:<br />
Snow and rainfall were quite variable over the state<br />
during the winter season with the southeast third<br />
of Iowa receiving the most moisture. The southeast<br />
portions of the state saw precipitation totals<br />
that were in excess of 130 percent of normal with<br />
several storms visiting during the winter. While<br />
this precipitation is much needed given the ongoing<br />
drought, much of the snow and rain ran off into<br />
streams and rivers as the ground was frozen.<br />
Meanwhile, the northwest half of Iowa struggled to<br />
receive as much precipitation allowing the drought<br />
to persist in those locations.<br />
Fun Fact: According to the World Meteorological Organization, the world's lowest<br />
average yearly precipitation is 0.03 inches during a 59-year period at Arica, Chile. In addition,<br />
no rain fell from October 1903 to January 1918. That is more than 14 years without rainfall!<br />
10
Volume 7, Issue 1 The Weather Whisper Spring 2013<br />
Outlook for Spring into Summer 2013<br />
by Miles Schumacher, Lead Forecaster<br />
Winter of 2012-13 was once again relatively mild,<br />
though colder than last winter. Temperatures have<br />
been warmer than normal for 17 of the last 18<br />
months. The drought conditions across the central<br />
U.S., the most widespread since 1956, were eased<br />
somewhat during the late fall and winter months.<br />
Above normal precipitation occurred over the<br />
southeast half of the state, but dry conditions held<br />
strong in the northwest.<br />
The weakening El Niño signal in the equatorial<br />
Pacific continued to fade through the winter months.<br />
In fact, the average temperature across the<br />
equatorial Pacific was slightly below normal through<br />
much of the winter. The circled area in figure 1<br />
shows the rather chaotic water temperature pattern.<br />
It is neither a clear La Niña (cold) nor El Niño<br />
(warm) event. One of the factors that helped to<br />
prevent the El Niño that began to develop last<br />
summer from continuing into this past winter was<br />
the effect of what is known as the Pacific Decadal<br />
Oscillation (PDO). We are presently in the cold<br />
phase of PDO. The evidence for this is also shown in<br />
figure 1 with the horseshoe pattern of cold water<br />
along the west coast of North America that sweeps<br />
southwest into the equatorial region.<br />
Figure 2: Sea surface temperature departure for the past two 3-<br />
month seasons, and the projection into the Fall of 2013.<br />
Departure in degrees C is shown on the ordinate, with time on<br />
the abscissa.<br />
The atmosphere typically follows a three to seven<br />
year cycle between El Niño and La Niña. Depending<br />
on the phase of the PDO, El Niño/La Niña is favored<br />
during warm/cold phase of the PDO. The Pacific is<br />
currently in the cold phase of PDO. La Niña<br />
conditions are favored by a two to one margin<br />
during the cold phase. For that reason, it is unlikely<br />
that there will be a change toward El Niño this<br />
spring or summer. The pattern is more typical of<br />
Figure 1: Sea surface temperature departure from normal over the<br />
equatorial Pacific.<br />
what was observed during the last cold phase of the<br />
PDO, roughly 1947-1977. Model forecasts suggest<br />
we are unlikely to progress into an El Niño pattern<br />
during the upcoming summer. In fact, many of the<br />
model runs suggest a slight cool pattern will persist.<br />
Figure 2 shows the observed central Pacific sea<br />
surface temperature departure (solid black line) and<br />
a series of 25 forecasts, seventeen of which are<br />
based on dynamic models, eight of which are<br />
statistically based. The mean forecast from the<br />
dynamic models is shown in a wider yellow line; a<br />
wider pale blue line depicts the statistical model<br />
average. The mauve colored wider line is the<br />
Climate Prediction Center consolidation. These<br />
forecasts are based on average conditions through<br />
the first part of February of 2013. As can be seen in<br />
figure 2, the most likely outcome for this spring and<br />
summer is slightly cool neutral pattern. To be either<br />
an El Niño or La Niña, the average temperature<br />
departure must be 0.5°C or more above or below<br />
normal respectively for three consecutive 90 day<br />
seasons.<br />
Although in meteorology no two years are the same<br />
strictly speaking, one can look at weather patterns<br />
of the recent past to give some indications of near<br />
term weather trends in the future. This forecast is<br />
based in large part on the best fit from several of<br />
the years that were similar to the winter season just<br />
past. Considerations were also made for the state of<br />
the Pacific and expected El Niño neutral conditions<br />
and other factors that influence our weather pattern.<br />
Though there is not a strong correlation with the<br />
tendency for cool water in the equatorial Pacific,<br />
there are statistical leanings toward dry conditions<br />
during the summer months during multi-year cool<br />
phases. It is also typical that the year following a<br />
significant drought, such as we saw last year, tends<br />
to be drier than normal as well. This was the case in<br />
the summer of 1957 following the severe drought of<br />
1956.<br />
(Continued on page 12)<br />
11
The Weather Whisper Spring 2013<br />
Spring/Summer<br />
Outlook<br />
(Continued from page 11)<br />
The negative PDO pattern,<br />
shown in figure 1, tends to<br />
result in the development of<br />
upper level low pressure off the<br />
west coast of the U.S. during<br />
the spring season. The two<br />
most notable effects of that are<br />
an enhanced chance for cold air<br />
to push south into the western<br />
U.S. and a better chance for<br />
moisture from the Gulf of<br />
Mexico to reach Iowa.<br />
With this pattern there is a<br />
greater likelihood for the<br />
pattern to be more variable with<br />
strong shifts between above and<br />
below normal temperatures,<br />
unlike the persistent warmth<br />
that was observed last year.<br />
W a r m e r t h a n n o r m a l<br />
temperatures are more likely<br />
over the southeast U.S., with<br />
c o o l e r t h a n n o r m a l<br />
t e m p e r a t u r e s o v e r t h e<br />
northwest U.S. Iowa is expected<br />
to be in between. Gulf moisture<br />
is likely to be drawn north into<br />
Iowa with greater than normal<br />
precipitation expected over<br />
much of the southeast half of<br />
the state. See figure 3<br />
The atmosphere is expected<br />
respond to the overall neutral<br />
Pacific Ocean temperatures.<br />
Perhaps a stronger driver as we<br />
move into the summer months<br />
will be the antecedent soil<br />
moisture. With the drought<br />
conditions as severe as they<br />
were last summer, and with<br />
only minor recovery through the<br />
winter months, there will be an<br />
enhanced probability of warmer<br />
than normal temperatures.<br />
Some improvement is expected<br />
to take place during the spring.<br />
Drought conditions will likely<br />
persist through the summer,<br />
however not as severe as they<br />
were in the summer of 2012.<br />
For the summer, temperatures<br />
Figure 3: Mean Temperature (left) and Precipitation (right) departure for March<br />
through April.<br />
Volume 7, Issue 1<br />
are most likely to average<br />
above normal across the state.<br />
Although the number of days<br />
above 90 degrees is likely to be<br />
less than in the summer of<br />
2012, Iowa is likely to have<br />
about 150% of the normal<br />
number. Rainfall across the<br />
state is also expected to be less<br />
than normal. Indications are<br />
that July may be well have the<br />
greatest departure in both<br />
temperature and rainfall,<br />
making it a hot and dry month<br />
with the potential of rainfall<br />
being 50% short of normal.<br />
Indications for dry weather in<br />
June and August are not as<br />
strong. From statistical analysis<br />
of years similar to 2012 into<br />
early 2013, indications are that<br />
the summer will be warmer and<br />
drier than normal but not as<br />
intense as last year. See figure<br />
4 for details.<br />
It will be important to monitor<br />
the oceanic and atmospheric<br />
patterns over the next several<br />
months. Although precipitation<br />
this spring is most likely to be<br />
normal to above, it is not likely<br />
to completely recharge the soil<br />
moisture to relieve the<br />
extremely dry conditions of the<br />
northwest. Some improvement<br />
is expected however, especially<br />
over the east. Warmer than<br />
normal temperatures this<br />
summer will put additional<br />
stress on water resources.<br />
These outlooks are based more<br />
heavily on statistics than many<br />
of the methods used by the<br />
Climate Prediction Center. The<br />
complete set of official forecasts<br />
from the Climate Prediction<br />
Center can be found on our<br />
website.<br />
Figure 4: Mean Temperature (left) and Precipitation (right) departure forecast for<br />
June through August.<br />
We want your feedback! We want to hear about your favorite stories and features, or if there<br />
is something you would like to see in an upcoming issue, let us know! Contact the editors at:<br />
Kenneth.Podrazik@noaa.gov or Aubry.Bhattarai@noaa.gov<br />
12
Volume 7, Issue 1 The Weather Whisper Spring 2013<br />
National Weather Service Des Moines<br />
9607 NW Beaver Drive<br />
Johnston, Iowa 50131-1908<br />
Phone: 515-270-2614<br />
Fax: 515-270-3850<br />
Visit us at: www.weather.gov/desmoines<br />
13