Report from the Commission
Report from the Commission
Report from the Commission

You also want an ePaper? Increase the reach of your titles
YUMPU automatically turns print PDFs into web optimized ePapers that Google loves.
COMMISSION OF THE EUROPEAN COMMUNITIES<br />
Brussels, 17.07.2002<br />
COM(2002) 407 final<br />
REPORT FROM THE COMMISSION<br />
Implementation of Council Directive 91/676/EEC concerning <strong>the</strong> protection of waters<br />
against pollution caused by nitrates <strong>from</strong> agricultural sources<br />
Syn<strong>the</strong>sis <strong>from</strong> year 2000 Member States reports
REPORT FROM THE COMMISSION<br />
Implementation of Council Directive 91/676/EEC concerning <strong>the</strong> protection of waters<br />
against pollution caused by nitrates <strong>from</strong> agricultural sources<br />
Syn<strong>the</strong>sis <strong>from</strong> year 2000 Member States reports<br />
The information contained in this report is without prejudice to any fur<strong>the</strong>r<br />
<strong>Commission</strong> assessment in <strong>the</strong> framework of infringement proceedings<br />
TABLE OF CONTENTS<br />
INTRODUCTION<br />
A. General Context............................................................................................................ 3<br />
B. State of implementation of <strong>the</strong> Directive.................................................................... 10<br />
B.1. Overview of exhaustivity of reports. .......................................................................... 11<br />
B.2. Water Quality ............................................................................................................. 13<br />
B.2.1 Water monitoring networks........................................................................................ 13<br />
B.2.2 Results of water quality survey................................................................................... 18<br />
B.2.3 Forecast of water quality evolution ............................................................................ 21<br />
B.3. Vulnerable zones designation and revision ................................................................ 22<br />
B.4. Action Programmes Assessment ................................................................................ 25<br />
B.5. A preliminary assessment of <strong>the</strong> economics of Action Programmes ......................... 31<br />
C. THE ACTIONS OF THE EUROPEAN COMMISSION .......................................... 37<br />
D. CONCLUSION .......................................................................................................... 40<br />
2
INTRODUCTION<br />
Council Directive 91/676/EEC (hereafter referred to as <strong>the</strong> Nitrates Directive) concerning <strong>the</strong><br />
protection of waters against pollution caused by nitrates <strong>from</strong> agricultural sources was adopted<br />
on 12 December 1991. A sister Directive 91/271/EEC (Urban Waste Water Treatment) was<br />
adopted on 21 May 1991.<br />
Article 10 of <strong>the</strong> Nitrates Directive requires that Member States submit a report to <strong>the</strong><br />
<strong>Commission</strong> every four years following its notification. This report should include<br />
information pertaining to codes of good farm practice, designated nitrate vulnerable zones<br />
(NVZs), results of water monitoring and a summary of relevant aspects of actions<br />
programmes for vulnerable zones.<br />
This <strong>Commission</strong> report (required by article 11) is a syn<strong>the</strong>sis of <strong>the</strong> information transmitted<br />
during 2000-2001 by Member States (2 nd reporting exercise). It is completed by aggregated<br />
maps and analysis of pressure <strong>from</strong> nitrogen <strong>from</strong> agricultural sources in <strong>the</strong> EU maps, of<br />
present NVZs and by a comparative table on <strong>the</strong> main content and deficiencies of <strong>the</strong> first<br />
action programmes (1996-1999).<br />
This report was prepared in order to provide an overview of <strong>the</strong> current situation with regard<br />
to <strong>the</strong> directive toge<strong>the</strong>r with possible pathways for <strong>the</strong> future. It illustrates, with some case<br />
studies, <strong>the</strong> positive effects of some farm practices on <strong>the</strong> quality of water. However, it is<br />
emphasised that <strong>the</strong>re is a considerable time lag between improvements at farm and soil level<br />
and a response in waterbody quality.<br />
A. GENERAL CONTEXT<br />
Increasing public concerns about steadily increasing nitrate concentrations in drinking water<br />
resources, and disturbance of aquatic ecosystems by eutrophication 1 , ( <strong>the</strong> best known<br />
examples being <strong>the</strong> south-eastern North Sea, Brittany “Abers” or <strong>the</strong> Adriatic Sea and Venice<br />
lagoons, where algae blooms have been occurring more and more frequently <strong>from</strong> <strong>the</strong> 70’s ),<br />
were <strong>the</strong> trigger for action to improve water quality.<br />
1<br />
Excessive growth of algae and plants, with potential adverse effects on biodiversity or human uses of<br />
water. The precise definition in <strong>the</strong> Directive (art. 2.i ) is “Enrichment of water by nitrogen compounds,<br />
causing an accelerated growth of algae and higher forms of plant life to produce an undesirable<br />
disturbance to <strong>the</strong> balance of organisms present in <strong>the</strong> water and to <strong>the</strong> quality of <strong>the</strong> water concerned”.<br />
3
MAP I.Satellite picture of EU seas chlorophyll-a concentrations. Average summer 2000. The<br />
red and yellow areas show strong phytoplancton development, one of <strong>the</strong> most visible<br />
symptoms of eutrophication, with potential adverse effects (toxic dinoflagellates, oxygen<br />
depletion, changes in bottom flora and fauna, etc).<br />
N.B.: Interferences of humid and suspended matters near estuaries have to be taken into account<br />
In agriculture, <strong>the</strong> trend towards greater intensification, and higher productivity during much<br />
of <strong>the</strong> past fifty years, was accompanied by a significant increase in fertiliser use and, as<br />
shown by fig. I, particularly inorganic nitrogen use.<br />
4
12<br />
10<br />
N consumption (Mt/year)<br />
8<br />
6<br />
4<br />
2<br />
0<br />
1930 1935 1940 1945 1950 1955 1960 1965 1970 1975 1980 1985 1990 1995<br />
FIG.1 Mineral N fertilisers consumption – E.U.15 Member States, <strong>from</strong> 1930 to 1999 Source<br />
EFMA (Millions of tons of nitrogen per year).<br />
Inorganic N use reached a peak of 11 millions tons annually in <strong>the</strong> mid 1980s before falling<br />
somewhat to approximately 9-10 Millions tons more recently.<br />
Animal numbers increased during most of this period , contributing to a greater overall N<br />
burden through manure. Crop production also increased. Changes in agricultural policy<br />
leading to milk quotas in 1984, and suckler cow and ewe premium quotas in 1992, have since<br />
stabilised or contributed to a reduction in cattle and sheep numbers, but both <strong>the</strong> pig and<br />
poultry sectors have continued to expand. In addition, animal numbers on individual farms are<br />
expanding and over 40% of <strong>the</strong> E.U.’s dairy herd is held on farms of more than 50 cows while<br />
<strong>the</strong> vast majority of <strong>the</strong> breeding pig herd contain more than 100 sows.<br />
Globally <strong>the</strong> nitrogen "pressure" on EU agricultural soils <strong>from</strong> animal husbandry (mainly<br />
cows, pigs, poultry and sheep), also is approximately 8 millions tons annually spread on<br />
agricultural soils (MAP III), so <strong>the</strong> total diffuse nitrogen "pressure" <strong>from</strong> agriculture reaches<br />
almost 18 millions tons (MAP IV).<br />
During this 50 years period, a reduction of permanent grassland and of “buffer” areas (ditches<br />
and hedges, wetlands, etc.) which favours erosion, run-off and quicker drainage of nutrients to<br />
<strong>the</strong> aquatic ecosystems and to groundwaters has been a feature of changing farming.<br />
In France, 67% of wetlands have disappeared within <strong>the</strong> last century. The same phenomena<br />
occurred since <strong>the</strong> 1950s for 84% of peat soils in <strong>the</strong> United Kingdom, and 57% of German<br />
and 60% of Spanish wetlands, due to agricultural drainage, tree planting and landfilling for<br />
urban purposes. Such wetlands are able, through natural denitrification and plant assimilation,<br />
to remove <strong>from</strong> water up to 2 kgs Nitrogen/hectare x day (almost 0.8 Ton N/hectare each<br />
year)(Fleischer et al, 1997). Their loss, <strong>the</strong>refore, is detrimental to water quality.<br />
Agricultural policy has responded to some of <strong>the</strong>se trends principally through <strong>the</strong> introduction<br />
of agri-environment measures in 1992 and <strong>the</strong>ir expansion in <strong>the</strong> Agenda 2000 CAP-<br />
REFORM.<br />
Finally, greater density of livestock buildings, and manure storage and spreading, has resulted<br />
in strong ammonia volatilisation, and atmospheric deposition on neighbouring soils and<br />
waters with values up to 50-60 kgs of nitrogen per hectare per year being recorded in regions<br />
with intensive livestock activities (EMEP, 1999; RIVM, 2000).<br />
Map II. shows average N inland deposition.<br />
5
As a marine example, on <strong>the</strong> North Sea a direct deposition up to 0.3 millions Tons N/year<br />
(20% of <strong>the</strong> aquatic inputs <strong>from</strong> riverine countries) has been estimated (EMEP, 1999).<br />
The following drawing summarises all <strong>the</strong> “pathways” of loss of nitrogen to <strong>the</strong> aquatic<br />
environment, including <strong>the</strong> "soil / air / soil & water" cycle:<br />
Soil/Air/Water<br />
The pathways of agricultural N<br />
Deposition<br />
Greenhouse<br />
gas effect<br />
Acidification<br />
Ammonia<br />
Run off<br />
Drainage<br />
Ammonia &<br />
Nitrous oxide<br />
Nutrient overload<br />
Eutrophication<br />
NPK<br />
Ammonia & Nitrate leaching<br />
Groundwaters<br />
pollution<br />
Ammonia & Nitrate leaching<br />
FIG. 2 The agricultural nitrogen air/soil/water exchanges and possible impacts.<br />
POSSIBLE IMPACTS:<br />
- A part of this nitrogen loss (50-80%) is recycled to water and soils, causing<br />
groundwaters enrichment, eutrophication of surface waters, in synergy with phosphorus, and<br />
contributing to “acid rain” damages on terrestrial flora and soils; ano<strong>the</strong>r part, up to 20-<br />
50%, is “denitrified” into inert nitrogen gas (and some N2O with a greenhouse gas effect), by<br />
soil and sediment bacteria, or by natural chemical reduction in certain types of soils and<br />
groundwaters.<br />
- Mineral fertilisers directly introduce ammonium and nitrates into groundwaters by<br />
leaching, and into surface waters by run-off and subsoil “drainage”. The extent of this<br />
depends on ground conditions at time of spreading.<br />
- Organic N (in manure) uses <strong>the</strong> same “pathways”, plus additional losses to <strong>the</strong><br />
atmosphere in <strong>the</strong> form of ammonia (volatilisation) and N2O (incomplete denitrification).<br />
These range <strong>from</strong> 10 % to 30% of <strong>the</strong> initial N excreted by animals, and are re-deposited on<br />
<strong>the</strong> soil and waterbodies in rain (wet deposition) or directly (dry atmospheric deposition).<br />
6
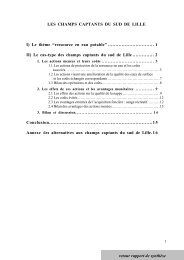
M A P P I N G N F R O M A G R I C U L T U R E<br />
b a s e d o n E u r o s t a t N e w C ro n o s 1 9 9 7<br />
Atm<br />
ospheric N D eposition<br />
R<br />
D e ngss ity<br />
_, kvg /<br />
7<br />
h a<br />
.s<br />
/ y eha pr<br />
1 - 5<br />
5 - 10<br />
10 - 15<br />
15 - 20<br />
20 - 25<br />
25 - 30<br />
>= 30<br />
C a t c h m e n t - b a s e d I n f o r m a t i o n S y s t e m<br />
D a ta S o u rc e s:<br />
C ontact:<br />
S tatistics:<br />
R . H ie derer<br />
- E u r o s t a t N e w C ro n o s d a t a b a s e , N it r a t e B a l a n c e<br />
Jo int R ese arch C entre<br />
S p a ti a l U n its :<br />
TP 262<br />
- G I S C O N U T S V 7<br />
210 20 Ispra (V A) - Italy<br />
P ro c e s s i n g :<br />
Te l: + 39 033 2 78 5 7 98<br />
- A p p e n d m i s s in g d a ta , r e - m a p p e d t o R E G I O f r a m e<br />
Fa x: + 39 0 332 78 9 8 03<br />
e -m a il: ro l a m d . h ie d e re r@ jrc . it<br />
Average nitrogen atmospheric deposition - (kg N/ha/year).<br />
MAP III.<br />
Livestock manure nitrogen pressure (per type of animals).<br />
7
The total nitrogen “pressure” on agricultural soils of Europe is summarised in MAP IV, which<br />
also indicates <strong>the</strong> origin of <strong>the</strong> different nitrogen inputs to soil:<br />
MAP IV.<br />
fixation.<br />
Total nitrogen pressure <strong>from</strong> agriculture, air deposition and biological<br />
In order to limit <strong>the</strong> losses linked to agricultural activities, <strong>the</strong> main types of actions that <strong>the</strong><br />
Nitrates directive promotes (in annexes II-codes of good practice, and III-actions programmes)<br />
simultaneously concern:<br />
8
– Crop rotations, soil winter cover, catch crops, in order to limit leaching during <strong>the</strong> wet<br />
seasons.<br />
– Use of fertilisers and manure, with a balance between crop needs, N inputs and soil<br />
supply, frequent manure and soil analysis, mandatory fertilisation plans and general<br />
limitations per crop for both mineral and organic N fertilisation.<br />
– Appropriate N spreading calendars and sufficient manure storage, for availability only<br />
when <strong>the</strong> crop needs nutrients, and good spreading practices.<br />
– “Buffer”effect of non-fertilised grass strips and hedges along watercourses and ditches.<br />
– Good management and restrictions of cultivation on steeply sloping soils, and of<br />
irrigation.<br />
The nitrogen surplus (difference between inputs and outputs by crops, meat or milk<br />
production), can be a good indicator of potential losses to environment, at farm, local or<br />
regional level. A big heterogeneity can be noticed between EU regions, as shown by MAP IV<br />
bis (Eurostat, focus N° 8, y. 2000, <strong>from</strong> 1997 Member States statistics) with surplus ranging<br />
<strong>from</strong> 0 up to 300 kg N/ha, <strong>the</strong> maximum being reached in areas with an excessive density of<br />
livestock breeding. But high N surplus, and associated risks of losses to water, can also be<br />
found in regions of intensive fruit and vegetable cropping, or cereals and maïze with<br />
unbalanced fertilisation and practices favouring N losses (such as bare soils in winter).<br />
MAP IV bis. NITROGEN SURPLUS FROM AGRICULTURE IN EU REGIONS<br />
9