CEB Investors' and Analysts' Briefing 4Q10 - Cebu Pacific Air
CEB Investors' and Analysts' Briefing 4Q10 - Cebu Pacific Air
CEB Investors' and Analysts' Briefing 4Q10 - Cebu Pacific Air

You also want an ePaper? Increase the reach of your titles
YUMPU automatically turns print PDFs into web optimized ePapers that Google loves.
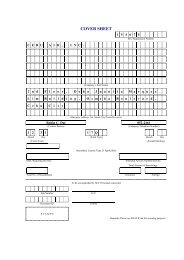
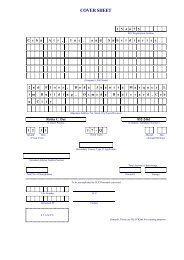
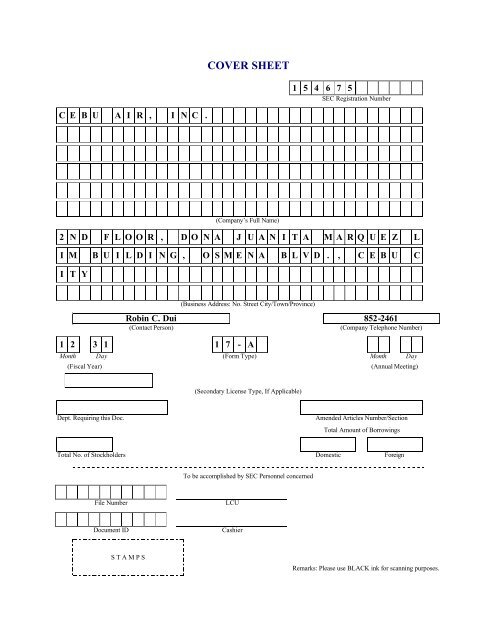
COVER SHEET<br />
1 5 4 6 7 5<br />
SEC Registration Number<br />
C E B U A I R , I N C .<br />
(Company’s Full Name)<br />
2 N D F L O O R , D O N A J U A N I T A M A R Q U E Z L<br />
I M B U I L D I N G , O S M E N A B L V D . , C E B U C<br />
I T Y<br />
(Business Address: No. Street City/Town/Province)<br />
Robin C. Dui 852-2461<br />
(Contact Person)<br />
(Company Telephone Number)<br />
1 2 3 1 1 7 - A<br />
Month Day (Form Type) Month Day<br />
(Fiscal Year)<br />
(Annual Meeting)<br />
(Secondary License Type, If Applicable)<br />
Dept. Requiring this Doc.<br />
Amended Articles Number/Section<br />
Total Amount of Borrowings<br />
Total No. of Stockholders Domestic Foreign<br />
To be accomplished by SEC Personnel concerned<br />
File Number<br />
LCU<br />
Document ID<br />
Cashier<br />
S T A M P S<br />
Remarks: Please use BLACK ink for scanning purposes.
SECURITIES AND EXCHANGE COMMISSION<br />
SEC FORM 17-A<br />
ANNUAL REPORT PURSUANT TO SECTION 17<br />
OF THE SECURITIES REGULATION CODE AND SECTION 141<br />
OF THE CORPORATION CODE OF THE PHILIPPINES<br />
1. For the fiscal year ended December 31, 2010<br />
2. SEC Identification No. 154675<br />
3. BIR Tax Identification No. 000-948-229-000<br />
<strong>Cebu</strong> <strong>Air</strong>, Inc.<br />
4. Exact name of issuer as specified in its charter<br />
<strong>Cebu</strong> City, Philippines<br />
5. Province, country or other jurisdiction of incorporation or organization<br />
6. Industry Classification Code: (SEC Use Only)<br />
2 nd Floor, Dona Juanita Marquez Lim Building, Osmena Blvd., <strong>Cebu</strong> City 6000<br />
7. Address of issuer's principal office Postal Code<br />
(032) 255-4552<br />
8. Issuer's telephone number, including area code<br />
Not Applicable<br />
9. Former name, former address <strong>and</strong> former fiscal year, if changed since last report<br />
10. Securities registered pursuant to Sections 8 <strong>and</strong> 12 of the Code, or Sections 4 <strong>and</strong> 8 of the<br />
RSA<br />
Title of Each Class<br />
Common Stock, P1.00 Par Value<br />
Number of Shares of Common<br />
Stock Outst<strong>and</strong>ing <strong>and</strong> Amount<br />
of Debt Outst<strong>and</strong>ing<br />
613,236,550 shares<br />
11. Are any or all of the securities listed on the Philippine Stock Exchange?<br />
Yes [x] No [ ]
12. Indicate by check mark whether the registrant:<br />
(a) has filed all reports required to be filed by Section 17 of the Code <strong>and</strong> SRC Rule 17<br />
thereunder or Sections 11 of the RSA <strong>and</strong> RSA Rule 11(a)-1 thereunder, <strong>and</strong> Sections 26 <strong>and</strong><br />
141 of the Corporation Code of the Philippines, during the preceding twelve (12) months (or<br />
for such shorter period the registrant was required to file such reports)<br />
Yes [x] No [ ]<br />
(b) has been subject to such filing requirements for the past 90 days.<br />
Yes [x] No [ ]<br />
13. State the aggregate market value of the voting stock held by non-affiliates of the registrant.<br />
The aggregate market value shall be computed by reference to the price at which the stock<br />
was sold, or the average bid <strong>and</strong> asked prices of such stock, as of a specified date within 60<br />
days prior to the date of filing. If a determination as to whether a particular person or entity is<br />
an affiliate cannot be made without involving unreasonable effort <strong>and</strong> expense, the aggregate<br />
market value of the common stock held by non-affiliates may be calculated on the basis of<br />
assumptions reasonable under the circumstances, provided the assumptions are set forth in<br />
this Form.<br />
The aggregate market value of stocks held by non-affiliates is P23,897,216,250.
TABLE OF CONTENTS<br />
Page No.<br />
PART I – BUSINESS AND GENERAL INFORMATION<br />
Item 1 Business.........................................................................................................1<br />
Item 2 Properties…………………………………………………………………. 14<br />
Item 3 Legal Proceedings…………………………………………………………14<br />
Item 4 Submission of Matters to a Vote of Security Holders……………………. 14<br />
PART II – OPERATIONAL AND FINANCIAL INFORMATION<br />
Item 5<br />
Item 6<br />
Market for Registrant’s Common Equity <strong>and</strong><br />
Related Stockholder Matter………………………………………………. 15<br />
Management’s Discussion <strong>and</strong> Analysis or<br />
Plan of Operation…………………………………………………………. 17<br />
Item 7 Financial Statements……………………………………………………… 30<br />
Item 8<br />
Changes in <strong>and</strong> Disagreements with Accountants on<br />
Accounting <strong>and</strong> Financial Disclosure…………………………………….. 30<br />
Item 9 Independent Public Accountants <strong>and</strong> Audit Related Fee………………… 30<br />
PART III – CONTROL AND COMPENSATION INFORMATION<br />
Item 10 Board of Directors <strong>and</strong> Executive Officers of the Registrant…………….. 32<br />
Item 11 Executive Compensation…………………………………………………. 39<br />
Item 12<br />
Security Ownership of Certain Beneficial Owners <strong>and</strong><br />
Management……………………………………………………………… 40<br />
Item 13 Certain Relationships <strong>and</strong> Related Transactions…………………………. 42<br />
PART IV – CORPORATE GOVERNANCE<br />
Item 14 Corporate Governance……………………………………………………. 42<br />
PART V – EXHIBITS AND SCHEDULES<br />
Item 15 Exhibits <strong>and</strong> Reports on SEC Form 17-C………………………………… 43<br />
SIGNATURES ..................................................................................................................... 44<br />
INDEX TO FINANCIAL STATEMENTS AND<br />
SUPPLEMENTARY SCHEDULES…………………………………………………….. 46
PART 1 – BUSINESS AND GENERAL INFORMATION<br />
Item 1.<br />
Business<br />
<strong>Cebu</strong> <strong>Air</strong>, Inc. (the Company) is an airline that operates under the trade name “<strong>Cebu</strong> <strong>Pacific</strong> <strong>Air</strong>”<br />
<strong>and</strong> is the leading low-cost carrier in the Philippines. It pioneered the “low fare, great value”<br />
strategy in the local aviation industry by providing scheduled air travel services targeted to<br />
passengers who are willing to forego extras for fares that are typically lower than those offered by<br />
traditional full-service airlines while offering reliable services <strong>and</strong> providing passengers with a<br />
fun travel experience.<br />
The Company was incorporated in August 26, 1988 <strong>and</strong> was granted a 40-year legislative<br />
franchise to operate international <strong>and</strong> domestic air transport services in 1991. It commenced its<br />
scheduled passenger operations in 1996 with its first domestic flight from Manila to <strong>Cebu</strong>. In<br />
1997, it was granted the status as an official Philippine carrier to operate international services by<br />
the Office of the President of the Philippines, pursuant to Executive Order (EO) No. 219.<br />
International operations began in 2001 with flights from Manila to Hong Kong.<br />
In 2005, the Company adopted the low cost carrier (LCC) business model. The core element of<br />
the LCC strategy is to offer affordable air servic es to passengers. This is achieved by having:<br />
high-load, high-frequency flights; high aircraft utilization; a young <strong>and</strong> simple fleet composition;<br />
<strong>and</strong> having low distribution costs.<br />
The Company operates an extensive route network serving 50 domestic routes <strong>and</strong> 23<br />
international routes with a total of 1,832 scheduled weekly flights. It operates from four hubs,<br />
including the Ninoy Aquino International <strong>Air</strong>port (NAIA) Terminal 3 located in Pasay City,<br />
Metro Manila; Mactan-<strong>Cebu</strong> International <strong>Air</strong>port located in Lapu-Lapu City, part of<br />
Metropolitan <strong>Cebu</strong>; Diosdado Macapagal International <strong>Air</strong>port located in Clark, Pampanga; <strong>and</strong><br />
Davao International <strong>Air</strong>port located in Davao City, Davao del Sur.<br />
As of December 31, 2010, the Company operated a fleet of 31 aircraft which comprises of ten<br />
<strong>Air</strong>bus A319, 14 <strong>Air</strong>bus A320, <strong>and</strong> seven ATR 72-500 aircraft. It operates its <strong>Air</strong>bus aircraft on<br />
both domestic <strong>and</strong> international routes <strong>and</strong> operates the ATR 72-500 aircraft on domestic routes,<br />
including destinations with runway limitations. The average aircraft age of the Company’s fleet<br />
is approximately 3.1 years as of December 31, 2010.<br />
The Company has three principal distribution channels: the internet; direct sales through booking<br />
sales offices, call centers <strong>and</strong> government/corporate client accounts; <strong>and</strong> third-party sales outlets.<br />
Aside from passenger service, it also provides airport-to-airport cargo services on its domestic<br />
<strong>and</strong> international routes. In addition, the Company offers ancillary services such as cancellation<br />
<strong>and</strong> rebooking options, in-flight merch<strong>and</strong>ising such as sale of duty-free products on international<br />
flights, excess baggage <strong>and</strong> travel-related products <strong>and</strong> services.<br />
1
Third Party Sales Outlets<br />
As of December 31, 2010, the Company had a network of distributors in the Philippines selling<br />
its domestic <strong>and</strong> international air services within an agreed territory or geographical coverage.<br />
Each distributor maintains <strong>and</strong> grows its own client base <strong>and</strong> can impose on their clients a service<br />
or transaction fee. Typically, a distributor’s client base would include agents, travel agents or end<br />
customers. The Company also had a network of foreign general sales agents, wholesalers, <strong>and</strong><br />
preferred sales agents who market, sell <strong>and</strong> distribute its air services in other countries.<br />
Publicly-Announced New Product or Service<br />
The Company continues to analyze its route network. The Company can opt to increase<br />
frequencies on existing routes or add new routes/destinations. The Company can also opt to<br />
eliminate unprofitable routes <strong>and</strong> redeploy capacity.<br />
The Company plans to exp<strong>and</strong> its fleet over the course of the next four years to 47 aircraft by the<br />
end of 2014 (net of redelivery of six leased aircraft). It has already signed a purchase agreement<br />
in February 2007 (as amended) on the basis of which it has firm orders for 22 <strong>Air</strong>bus A320<br />
aircraft, which are scheduled to be delivered starting October 2010, three of which have already<br />
arrived as of December 31, 2010. It has also entered into operating lease agreements for two<br />
<strong>Air</strong>bus A320 aircraft.<br />
The additional aircraft will support the Company’s plans to increase frequency on current routes<br />
<strong>and</strong> to add new city pairs <strong>and</strong> destinations. The Company has increased frequencies on domestic<br />
routes such as Manila to Cagayan de Oro, <strong>Cebu</strong>, Davao, Gen. Santos, <strong>and</strong> Puerto Princesa <strong>and</strong><br />
international routes such as Manila to Hong Kong, Singapore, Kuala Lumpur, Bangkok, <strong>and</strong><br />
Incheon. The Company plans to launch services from Manila to Pusan which is expected to start<br />
in 2011.<br />
Competition<br />
The Philippine aviation authorities deregulated the airline industry in 1995 eliminating certain<br />
restrictions on domestic routes <strong>and</strong> frequencies which resulted in fewer regulatory barriers to<br />
entry into the Philippine domestic aviation market. On the international market, although the<br />
Philippines currently operates under a bilateral framework, whereby foreign carriers are granted<br />
l<strong>and</strong>ing rights in the Philippines on the basis of reciprocity as set forth in the relevant bilateral<br />
agreements between the Philippine government <strong>and</strong> foreign nations, the Philippine government<br />
may consider liberalizing the Philippine aviation industry by allowing foreign carriers to exercise<br />
“freedoms of the air” traffic rights beyond those that were established under the bilateral<br />
agreements. The Philippine government may pursue “Open Skies” arrangements or policies such<br />
as ASEAN Open Skies. It may also pursue arrangements or policies similar to EO 29 or EO 500-<br />
A. This will significantly increase competition in the airline business. This will also allow the<br />
Company to exp<strong>and</strong> its route network.<br />
The Company faces intense competition on both its domestic <strong>and</strong> international routes. The level<br />
<strong>and</strong> intensity of competition varies from route to route based on a number of factors. Principally,<br />
it competes with other airlines that service the routes it flies. However, on certain domestic<br />
3
outes, the Company also considers alternative modes of transportation, particularly sea <strong>and</strong> l<strong>and</strong><br />
transport, to be competitors for its services. Substitutes to its services also include video<br />
conferencing <strong>and</strong> other modes of communication.<br />
The Company’s main competitor in the Philippines is Philippine <strong>Air</strong>lines (“PAL”), a full-service<br />
Philippine flag carrier. Most of the Company’s domestic <strong>and</strong> international destinations are also<br />
serviced by PAL. The Company also competes in the Philippines with <strong>Air</strong> Philippines Express, a<br />
domestic operator with relations to PAL. Certain smaller airlines, including Zest <strong>Air</strong> <strong>and</strong> South<br />
East Asian <strong>Air</strong>lines also compete with the Company domestically. According to Civil<br />
Aeronautics Board (CAB) data, the Company is the leading domestic airline in the Philippines by<br />
passengers carried, with a market share of 48.2% for the year ended December 31, 2010.<br />
The Company intends to capture a portion of the growing tourist market <strong>and</strong> the large OFW<br />
population. The Company is a leading low-cost airline offering services to more destinations <strong>and</strong><br />
serving more routes with a higher frequency between the Philippines <strong>and</strong> other ASEAN countries<br />
than any other airline in the Philippines. The Company currently competes with the following<br />
LCC’s <strong>and</strong> full-service airlines in its international operations: <strong>Air</strong>Asia, Tiger <strong>Air</strong>ways, Jetstar<br />
<strong>Air</strong>ways, PAL, Cathay <strong>Pacific</strong>, Singapore <strong>Air</strong>lines, Thai <strong>Air</strong>ways, among others.<br />
Recently, <strong>Air</strong>Asia has confirmed the set up of a joint venture in the Philippines which is targeted<br />
to start operations in the third quarter of 2011. The Philippine joint venture will operatate out of<br />
Clark in Pampanga initially with two A320 aircraft. <strong>Air</strong>Asia has been operating in the<br />
Philippines since 2005, with one daily flight between Kuala Lumpur <strong>and</strong> Clark, <strong>and</strong> one daily<br />
flight between Kota Kinabalu <strong>and</strong> Clark.<br />
In addition, Tiger <strong>Air</strong>ways <strong>and</strong> Philippine carrier Seair initially set-up a “Partner <strong>Air</strong>line”<br />
program. Seair will operate Singapore flights to/from Clark flights using two 144-seater A319<br />
aircraft leased from Tiger. Seair’s seats <strong>and</strong> ancillary services for this route will be sold through<br />
Tiger’s website. Tiger recently took 32.5% stake in Seair.<br />
Jetstar <strong>Air</strong>ways also recently announced that it is in talks with various local companies, looking<br />
for a Filipino partner. Jetstar <strong>Air</strong>ways wants to tap markets outside Manila such as <strong>Cebu</strong> <strong>and</strong><br />
Aklan.<br />
Raw Materials<br />
Fuel is a major cost component for airlines. The Company’s fuel requirements are classified by<br />
location <strong>and</strong> sourced from various suppliers.<br />
The Company’s fuel suppliers at its international stations include PTT, Petronas, Shell-<br />
Singapore, SK-Korea <strong>and</strong> Chevron HK, among others. It also purchases fuel from PTT<br />
Philippines <strong>and</strong> Phoenix Petroleum. The Company purchases fuel stocks on a per parcel basis, in<br />
such quantities as are sufficient to meet its monthly operational requirements. Most of the<br />
Company’s contracts with fuel suppliers are on a yearly basis <strong>and</strong> may be renewed for subsequent<br />
one-year periods.<br />
4
Dependence on One or a Few Major Customers <strong>and</strong> Identify any such Major Customers<br />
The Company’s business is not dependent upon a single customer or a few customers that a loss<br />
of anyone of which would have a material adverse effect on the Company.<br />
Transactions with <strong>and</strong>/or Dependence on Related Parties<br />
The Company’s significant transactions with related parties are described in detail in Note 26 of<br />
the Notes to Consolidated Financial Statements.<br />
Patents, Trademarks, Licenses, Franchises, Concessions <strong>and</strong> Royalty Agreements<br />
Patents / Trademarks<br />
The Company has registered the “<strong>Cebu</strong> <strong>Pacific</strong>” <strong>and</strong> the <strong>Cebu</strong> <strong>Pacific</strong> feather-like device trade<br />
marks with the Philippine Intellectual Property Office (PIPO). In the Philippines, certificates of<br />
registration of a trade mark filed with the PIPO prior to the effective date of the Philippine<br />
Intellectual Property Code in 1998 are generally effective for a period of 20 years from the date<br />
of the certificate, while those filed after the Philippine Intellectual Property Code became<br />
effective are generally effective for a shorter period of ten years, unless terminated earlier. The<br />
Company currently has 16 trademark applications pending with the PIPO. It has also registered<br />
the business name “<strong>Cebu</strong> <strong>Pacific</strong> <strong>Air</strong>” with the Department of Trade <strong>and</strong> Industry. Registering a<br />
business name with the Department of Trade <strong>and</strong> Industry precludes another entity engaged in the<br />
same or similar business from using the same business name as one that has been registered. A<br />
registration of a business name shall be effective for five years from the initial date of registration<br />
<strong>and</strong> must be renewed within the first three months following the expiration of the five-year period<br />
from the date of original registration.<br />
Licenses / Permits<br />
The Company operates its business in highly regulated environment. The Company’s business<br />
depends upon the permits <strong>and</strong> licenses issued by the government authorities or agencies for its<br />
operations which include the following:<br />
• Legislative Franchise to Operate a Public Utility<br />
• Certificate of Public Convenience <strong>and</strong> Necessity<br />
• Letter of Authority<br />
• <strong>Air</strong> Operator Certificate<br />
• Certificate of Registration<br />
• Certificate of <strong>Air</strong>worthiness<br />
The Company also has to seek approval from the relevant airport authorities to secure airport<br />
slots for its operations.<br />
5
Franchise<br />
In 1991, pursuant to Republic Act (RA) No. 7151, the Company was granted a franchise to<br />
operate air transportation services, both domestic <strong>and</strong> international. In accordance with the<br />
Company’s franchise, which extends up to year 2031:<br />
a) The Company is subject to franchise tax of five (5) percent of the gross revenue derived<br />
from air transportation operations. For revenue earned from activities other than air<br />
transportation, the Company is subject to regular corporate income tax <strong>and</strong> to real<br />
property tax.<br />
b) In the event that any competing individual, partnership or corporation received <strong>and</strong><br />
enjoyed tax privileges <strong>and</strong> other favorable terms which tended to place the Company at<br />
any disadvantage, then such privileges shall have been deemed by the fact itself of the<br />
Company’s tax privileges <strong>and</strong> shall operate equally in favor of the Company.<br />
Kindly refer to Note 1 of the Notes to Consolidated Financial Statements.<br />
Government Approval of Principal Products or Services<br />
The Company operates its business in highly regulated environment. The Company’s business<br />
depends upon the permits <strong>and</strong> licenses issued by the government authorities or agencies for its<br />
operations which include the following:<br />
• Legislative Franchise to Operate a Public Utility<br />
• Certificate of Public Convenience <strong>and</strong> Necessity<br />
• Letter of Authority<br />
• <strong>Air</strong> Operator Certificate<br />
• Certificate of Registration<br />
• Certificate of <strong>Air</strong>worthiness<br />
The Company also has to seek approval from the relevant airport authorities to secure airport<br />
slots for its operations.<br />
Effects of Existing or Probable Government Regulations on the Business<br />
Civil Aeronautics Administration <strong>and</strong> Civil Aviation Authority of the Philippines (CAAP)<br />
Policy-making for the Philippine civil aviation industry started with RA 776, known as the Civil<br />
Aeronautics Act of the Philippines (the “Act”), passed in 1952. The Act established the policies<br />
<strong>and</strong> laws governing the economic <strong>and</strong> technical regulation of civil aeronautics in the country. It<br />
established the guidelines for the operation of two regulatory organizations, CAB for the<br />
regulation of the economic activities of airline industry participants <strong>and</strong> the <strong>Air</strong> Transportation<br />
Office, which was later transformed into the CAAP, created pursuant to RA 9497, otherwise<br />
known as the Civil Aviation Authority Act of 2008.<br />
6
The CAB is authorized to regulate the economic aspects of air transportation, to issue general<br />
rules <strong>and</strong> regulations to carry out the provisions of RA 776, <strong>and</strong> to approve or disapprove the<br />
conditions of carriage or tariff which an airline desires to adopt. It has general supervision <strong>and</strong><br />
regulation over air carriers, general sales agents, cargo sales agents, <strong>and</strong> airfreight forwarders, as<br />
well as their property, property rights, equipment, facilities <strong>and</strong> franchises.<br />
The CAAP, a government agency under the supervision of the Department of Transportation <strong>and</strong><br />
Communications for purposes of policy coordination, regulates the technical <strong>and</strong> operational<br />
aspects of air transportation in the Philippines, ensuring safe, economic <strong>and</strong> efficient air travel. In<br />
particular, it establishes the rules <strong>and</strong> regulations for the inspection <strong>and</strong> registration of all aircraft<br />
<strong>and</strong> facilities owned <strong>and</strong> operated in the Philippines, determines the charges <strong>and</strong>/or rates pertinent<br />
to the operation of public air utility facilities <strong>and</strong> services, <strong>and</strong> coordinates with the relevant<br />
government agencies in relation to airport security. Moreover, CAAP is likewise tasked to<br />
operate <strong>and</strong> maintain domestic airports, air navigation <strong>and</strong> other similar facilities in compliance<br />
with the International Civil Aviation Organization (ICAO), the specialized agency of the United<br />
Nations whose m<strong>and</strong>ate is to ensure the safe, efficient <strong>and</strong> orderly evolution of international civil<br />
aviation.<br />
The Company complies with <strong>and</strong> adheres to existing government regulations.<br />
Category 2 Rating<br />
In early January 2008, the Federal Aviation Administration (FAA) of the United States<br />
downgraded the aviation safety ranking of the Philippines to Category 2 from the previous<br />
Category 1 rating. The FAA assesses the civil aviation authorities of all countries with air carriers<br />
that operate to the U.S. to determine whether or not foreign civil aviation authorities are meeting<br />
the safety st<strong>and</strong>ards set by the ICAO. The lower Category 2 rating means a country either lacks<br />
laws or regulations necessary to oversee airlines in accordance with minimum international<br />
st<strong>and</strong>ards, or its civil aviation authority is deficient in one or more areas, such as technical<br />
expertise, trained personnel, recordkeeping or inspection procedures. Further, it means Philippine<br />
carriers can continue flyin g to the U.S. but only under heightened FAA surveillance or<br />
limitations. In addition, the Philippines has been included in the “Significant Safety Concerns”<br />
posting by the ICAO as a result of an unaddressed safety concern highlighted in the recent ICAO<br />
audit. As a result of this unaddressed safety concern, <strong>Air</strong> Safety Committee (ASC) of the<br />
European Union banned all Philippine commercial air carriers from operating flights to <strong>and</strong> from<br />
Europe. The ASC based its decision on the absence of sufficient oversight by the CAAP.<br />
Although the Company does not currently operate flights to the U.S. <strong>and</strong> Europe, the foregoing<br />
may adversely affect its ability to establish new routes to other countries that base their decision<br />
on flight access on the FAA <strong>and</strong> ASC’s evaluation.<br />
EO 28 <strong>and</strong> 29<br />
In March 2011, the Government issued EO 28 which provides for the reconstitution <strong>and</strong><br />
reorganization of the existing Single Negotiating Panel into the Philippine <strong>Air</strong> Negotiating Panel<br />
(PANP) <strong>and</strong> Philippine <strong>Air</strong> Consultation Panel (PACP) (collectively, the Philippine <strong>Air</strong> Panels).<br />
The PANP shall be responsible for the initial negotiations leading to the conclusion of the<br />
relevant <strong>Air</strong> Services Agreements (ASAs) while the PACP shall be responsible for the succeeding<br />
negotiations of such ASAs or similar arrangements.<br />
7
Also in March 2011, the government issued EO 29 which authorizes the CAB <strong>and</strong> the Philippine<br />
<strong>Air</strong> Panels to pursue more aggressively the international civil aviation liberalization policy to<br />
boost the country’s competitiveness as a tourism destination <strong>and</strong> investment location. Among<br />
others, EO 29 provides the following:<br />
• In the negotiation of the ASAs, the Philippine <strong>Air</strong> Panels may offer <strong>and</strong> promote third, fourth<br />
<strong>and</strong> fifth freedom rights to the country’s airports other than the NAIA without restriction as to<br />
frequency, capacity <strong>and</strong> type of aircraft, <strong>and</strong> other arrangements that will serve the national<br />
interest as may be determined by the CAB; <strong>and</strong><br />
• Notwithst<strong>and</strong>ing the provisions of the relevant ASAs, the CAB may grant any foreign air<br />
carriers increases in frequencies <strong>and</strong>/or capacities in the country’s airports other than the<br />
NAIA, subject to conditions required by existing laws, rules <strong>and</strong> regulations. All grants of<br />
frequencies <strong>and</strong>/or capacities which shall be subject to the approval of the President shall<br />
operate as a waiver by the Philippines of the restrictions on frequencies <strong>and</strong> capacities under<br />
the relevant ASAs.<br />
The issuance of the foregoing EOs may significantly increase competition.<br />
Research <strong>and</strong> Development<br />
The Company incurred minimal amounts for research <strong>and</strong> development activities, which do not<br />
amount to a significant percentage of revenues.<br />
Cost <strong>and</strong> Effects of Compliance with Environmental Laws<br />
The operations of the Company are subject to various laws enacted for the protection of the<br />
environment. The Company has complied with the following applicable environmental laws <strong>and</strong><br />
regulations:<br />
• Presidential Decree No. 1586 (Establishing an Environmental Impact Assessment System)<br />
which directs every person, partnership or corporation to obtain an Environmental<br />
Compliance Certificate (ECC) before undertaking or operating a project declared as<br />
environmentally critical by the President of the Philippines. Petro-chemical industries,<br />
including refineries <strong>and</strong> fuel depots, are considered environmentally critical projects for<br />
which an ECC is required. The Company has obtained ECCs for the fuel depots it operates<br />
<strong>and</strong> maintains in Domestic Road, Pasay City (“Manila Depot”), Lapu-Lapu City (“<strong>Cebu</strong><br />
Depot”) <strong>and</strong> Sasa, Davao City (“Davao Depot”) for the storage <strong>and</strong> distribution of aviation<br />
fuel for its aircraft.<br />
• RA 8749 (The Implementing Rules <strong>and</strong> Regulations of the Philippine Clean <strong>Air</strong> Act of 1999)<br />
requires operators of aviation fuel storage tanks, which are considered as a possible source of<br />
air pollution, to obtain a Permit to Operate from the applicable regional office of the EMB.<br />
The aviation fuel storage tanks in the Company’s Manila Depot, <strong>Cebu</strong> Depot <strong>and</strong> Davao<br />
Depot are subject to <strong>and</strong> are compliant with this requirement.<br />
8
• RA 9275 (Implementing Rules <strong>and</strong> Regulations of the Philippine Clean Water Act of 2004)<br />
requires owners or operators of facilities that discharge regulated effluents to secure from the<br />
Laguna Lake Development Authority (Luzon area) <strong>and</strong>/or the applicable regional office of<br />
the EMB (Visayas <strong>and</strong> Mindanao areas) a discharge permit, which is the legal authorization<br />
granted by the Department of Energy <strong>and</strong> Natural Resources for the discharge of waste water.<br />
The Company’s operations generate waste water <strong>and</strong> effluents for the disposal of which a<br />
Discharge Permit was obtained from the Laguna Lake Development Authority <strong>and</strong> the<br />
Environment Management Bureau of Region 7 which enables it to discharge <strong>and</strong> dispose of<br />
liquid waste or water effluent generated in the course of its operations at specifically<br />
designated areas. The Company also contracted the services of government-licensed <strong>and</strong><br />
accredited third parties to transport, h<strong>and</strong>le <strong>and</strong> dispose its waste materials.<br />
Compliance with the foregoing laws does not have a material effect to the Company’s capital<br />
expenditures, earnings <strong>and</strong> competitive position.<br />
On an annual basis, the Company spend approximately P300,000 in connection with its<br />
compliance with applicable environmental laws.<br />
Employees<br />
As of December 31 2010, the Company had 2,475 permanent full time employees, categorized as<br />
follows:<br />
Division:<br />
Employees<br />
Operations……...…………………………………… 1,699<br />
Commercial …………………………………… 485<br />
Support Departments (1) ……………………………… 291<br />
2,475<br />
Note:<br />
(1) Support Departments include the Office of the General Manager, the Corporate Finance, Planning <strong>and</strong><br />
Legal Affairs Department, People Department, Administrative Services Department, Procurement<br />
Department, Information Systems Department, Comp troller Department, Internal Audit Department <strong>and</strong><br />
Treasury Department.<br />
The Company’s employees are not unionized, <strong>and</strong> it has not experienced any labor strikes or<br />
work stoppages in past three years.<br />
Risk<br />
The major business risks facing the Company are as follows:<br />
(1) Cost <strong>and</strong> Availability of Fuel<br />
The cost <strong>and</strong> availability of fuel are subject to many economic <strong>and</strong> political factors <strong>and</strong> events<br />
occurring throughout the world, the most important of which are not within the Company’s<br />
control. Fuel prices have been subject to high volatility, fluctuating substantially over the past<br />
9
several years. Any increase in the cost of fuel or any decline in the availability of adequate<br />
supplies of fuel could have a material adverse effect on the Company’s operations <strong>and</strong><br />
profitability.<br />
The Company implements various fuel management strategies to manage the risk of rising fuel<br />
prices including hedging. The Company may also consider adding fuel surcharge in the event of<br />
significant increase in fuel prices.<br />
(2) Competition<br />
The Company faces intense competition on its domestic <strong>and</strong> international routes, both from other<br />
low-cost carriers <strong>and</strong> from full-service carriers. Its existing competitors or new entrants into the<br />
market may undercut its fares in the future, increase capacity on their routes or attempt to conduct<br />
low-fare or low-cost airline operations of their own in an effort to increase market share, any of<br />
which could negatively affect the Company’s business. The Company also faces competition<br />
from ground <strong>and</strong> sea transportation alternatives, including buses, trains, ferries, boats <strong>and</strong> cars,<br />
which are the principal means of transportation in the Philippines. Video teleconferencing <strong>and</strong><br />
other methods of electronic communication, <strong>and</strong> improvements therein, also add a new dimension<br />
of competition to the industry as they, to a certain extent, provide lower-cost substitutes for air<br />
travel.<br />
The Company focuses on areas of costs, on-time performance, service delivery <strong>and</strong> scheduling<br />
to remain competitive.<br />
(3) Lack of Marketing Alliance<br />
Many airlines have marketing alliances with other airlines under which they market <strong>and</strong> advertise<br />
their status as marketing alliance partners. The Company is not a member of any such marketing<br />
alliance with respect to its passenger services. Its lack of alliance could harm its business <strong>and</strong><br />
competitive ability.<br />
The Company may try to enter into code sharing agreements, interlining agreements or any other<br />
marketing alliances in the future.<br />
(4) Economic Downturn<br />
The deterioration in the financial markets has heralded a recession in many countries, which led<br />
to significant declines in employment, household wealth, consumer dem<strong>and</strong> <strong>and</strong> lending <strong>and</strong>, as a<br />
result, has adversely affected economic growth in the Philippines <strong>and</strong> elsewhere. Since a<br />
substantial portion of airline travel, for both business <strong>and</strong> leisure, is discretionary, the airline<br />
industry tends to experience adverse financial results during general economic downturns. Any<br />
deterioration in the economy could negatively affect consumer sentiment <strong>and</strong> lead to a reduction<br />
in dem<strong>and</strong> for flying which could adversely affect the Company’s business. The Company could<br />
also experience difficulty accessing the financial markets, which could make it more difficult or<br />
expensive to obtain funding in the future.<br />
10
(5) Availability of Debt Financing<br />
The Company’s business is highly capital intensive. It has historically required debt financing to<br />
acquire aircraft <strong>and</strong> expect to incur significant amounts of debt in the future to fund the<br />
acquisition of additional aircraft, its operations, other anticipated capital expenditures, working<br />
capital requirements <strong>and</strong> expansion overseas. Failure to obtain additional financing could<br />
adversely affect the Company’s ability to grow its business <strong>and</strong> its future profitability.<br />
(6) Foreign Exchange <strong>and</strong> Interest Rate Fluctuations<br />
The Company’s exposure to foreign exchange rate fluctuations is principally in respect of its U.S.<br />
dollar-denominated long-term debt as well as a majority of its operating costs, such as U.S.<br />
dollar-denominated purchases of aviation fuel. On the other h<strong>and</strong>, the Company’s exposure to<br />
interest rate fluctuations is relative to debts incurred which have floating interest rates. In such<br />
cases, any significant devaluation of the Philippine peso <strong>and</strong> any significant increases in interest<br />
rates will result to increased obligations that could adversely impact the Company’s result of<br />
operations.<br />
The Company may enter into derivative contracts in the future to hedge foreign exchange<br />
exposure. In addition, the Company may fix the interest rates for a portion of its loans.<br />
(7) <strong>Air</strong>port <strong>and</strong> <strong>Air</strong> Traffic Control Infrastructure Constraints<br />
The Company relies on operational efficiency to reduce unit costs <strong>and</strong> provide reliable service.<br />
Any delay to the addition of capacity at airports or upgrade of facilities in the Philippines could<br />
affect the Company’s operational efficiency.<br />
(8) Reliance on Third Party Facilities <strong>and</strong> Service Providers<br />
The Company’s inability to lease, acquire or access airport facilities <strong>and</strong> service providers on<br />
reasonable terms to support its growth or to maintain its current operations would have a material<br />
adverse effect on our business, prospects, financial condition <strong>and</strong> results of operations.<br />
Furthermore, the Company’s reliance on third parties to provide essential services on its behalf<br />
gives the Company less control over the efficiency, timeliness <strong>and</strong> quality of services.<br />
(9) Safety <strong>and</strong> Security<br />
The Company is exposed to potentially significant losses in the event that any of its aircraft is lost<br />
or subject to an accident, terrorist incident or other disaster. In addition, any such event would<br />
give rise to significant costs related to passenger claims, repairs or replacement of a damaged<br />
aircraft <strong>and</strong> its temporary or permanent loss from service. Moreover, aircraft accidents or<br />
incidents, even if fully insured, are likely to create a public perception that the airline is less safe<br />
than other airlines, which could significantly reduce its passenger volumes <strong>and</strong> have a material<br />
adverse effect on its business, prospects, financial condition <strong>and</strong> results of operations. Terrorist<br />
attacks could also result in decreased seat load factors <strong>and</strong> yields <strong>and</strong> could result in increased<br />
costs, such as increased fuel expenses or insurance costs.<br />
The Company is committed to operational safety <strong>and</strong> security. Its commitment to safety <strong>and</strong><br />
security is reflected in its rigorous aircraft maintenance program <strong>and</strong> flight operations manuals,<br />
intensive flight crew, cabin crew <strong>and</strong> employee training programs <strong>and</strong> strict compliance with<br />
applicable regulations regarding aircraft <strong>and</strong> operational safety <strong>and</strong> security.<br />
11
(10) Maintenance Cost <strong>and</strong> Performance of Maintenance Repair Organizations<br />
As the fleet ages, maintenance <strong>and</strong> overhaul expenses will increase. Any significant increase in<br />
maintenance <strong>and</strong> overhaul expenses <strong>and</strong> the inability of maintenance repair organizations to<br />
provide satisfactory service could adversely affect the business.<br />
The Company enters into long term contracts to manage maintenance <strong>and</strong> overhaul expenses.<br />
(11) Reliance on Automated Systems <strong>and</strong> the Internet<br />
The Company depends on automated systems to operate its business, including, among others, its<br />
website, its reservation <strong>and</strong> its departure control systems. Any disruption to its website or online<br />
reservation <strong>and</strong> telecommunication services could result in losses, increased expenses <strong>and</strong> could<br />
harm its reputation.<br />
(12) Dependence on the Efforts of Executive Officers <strong>and</strong> Other Key Management<br />
The Company’s success depends to a significant extent upon the continued services of its<br />
executive officers <strong>and</strong> other key management personnel. The unavailability of any of its<br />
executive officers <strong>and</strong> other key management or failure to recruit suitable or comparable<br />
replacements could have a material adverse effect on our business, prospects, financial condition<br />
<strong>and</strong> results of operations.<br />
(13) Retaining <strong>and</strong> Attracting Qualified Personnel<br />
The Company’s business model requires it to have highly skilled, dedicated <strong>and</strong> efficient pilots,<br />
engineers <strong>and</strong> other personnel. Its growth plans will require the Company to hire, train <strong>and</strong> retain<br />
a significant number of new employees in the future. However, from time to time, the airline<br />
industry has experie nced a shortage of skilled personnel, particularly pilots <strong>and</strong> engineers. The<br />
Company competes against full-service airlines which offer wage <strong>and</strong> benefit packages that<br />
exceed those offered by the Company. The inability of the Company to hire, train <strong>and</strong> retain<br />
qualified employees at a reasonable cost could result in inability to execute it growth strategy,<br />
which would have a material adverse effect on our business, prospects, financial condition <strong>and</strong><br />
results of operations. In addition, the Company may find it increasingly challenging to maintain<br />
its corporate culture as it replaces or hires additional personnel.<br />
The Company may have to increase wages <strong>and</strong> benefits to attract <strong>and</strong> retain qualified personnel.<br />
(14) Availability of Insurance<br />
Insurance is fundamental to airline operations. Because of terrorist attacks or other world events,<br />
certain aviation insurance could become unavailable or available only for reduced amounts of<br />
coverage that are insufficient to comply with the le vels of coverage required by the Company’s<br />
aircraft lenders <strong>and</strong> lessors or applicable government regulations. Any inability to obtain<br />
insurance, on commercially acceptable terms or at all, for the Company’s general operations or<br />
specific assets would have a material adverse effect on business, prospects, financial condition<br />
<strong>and</strong> results of operations.<br />
12
(15) Regulations<br />
The Company has no control over applicable regulations. Changes in the interpretation of current<br />
regulations or the introduction of new laws or regulations could have a material adverse effect on<br />
the Company’s business, prospects, financial condition <strong>and</strong> results of operations.<br />
(16) Catastrophes <strong>and</strong> Other Factors Beyond the Company’s Control<br />
Like other airlines, the Company is subject to delays caused by factors beyond its control,<br />
including weather conditions, traffic congestion at airports, air traffic control problems <strong>and</strong><br />
increased security measures. In the event that the Company delays or cancels flights for any of<br />
these reasons, revenues <strong>and</strong> profits would be reduced <strong>and</strong> the Company’s reputation would suffer<br />
which could result in a loss of customers.<br />
(17) Unionization, Work Stoppages, Slowdowns <strong>and</strong> Increased Labor Costs<br />
At present, the Company has a non-unionized workforce. However, in the event the employees<br />
unionize, it could result to dem<strong>and</strong>s that may increase operating expenses <strong>and</strong> adversely affect the<br />
Company’s profitability. Likewise, disagreements between the labor union <strong>and</strong> management<br />
could result to work slowdowns or stoppages or disruptions which could be harmful to the<br />
business.<br />
(18) Restrictions under the Philippine Constitution <strong>and</strong> other Laws<br />
The Company is subject to nationality restrictions under the Philippine Constitution <strong>and</strong> other<br />
laws, limiting ownership of public utility companies to citizens of the Philippines or corporations<br />
or associations organized under the laws of the Philippines of which at least 60% of the capital<br />
stock outst<strong>and</strong>ing is owned <strong>and</strong> held by citizens of the Philippines. There is a risk that these<br />
ownership restrictions may be breached which could result in the revocation of the Company’s<br />
franchise generally <strong>and</strong> its rights to fly on certain international routes.<br />
(19) Relationship with Third Party Sales Outlets<br />
While part of the Company’s strategy is to increase bookings through the internet, sales through<br />
third party sales outlets remain an important distribution channel. There is no assurance that the<br />
Company will be able to maintain favorable relationships with them nor be able to suitably<br />
replace them. The Company’s revenues could be adversely impacted if third parties who sell its<br />
air services elect to prioritize other airlines.<br />
(20) Outbreaks<br />
Any present or future outbreak of contagious diseases could have a material adverse effect on the<br />
Company’s business, prospects, financial condition <strong>and</strong> results of operations.<br />
(21) Domestic Concentration<br />
Since the Company’s operations has focused <strong>and</strong>, at least in the near term, will continue to focus<br />
on air travel in the Philippines, it would be materially <strong>and</strong> adversely affected by any<br />
circumstances causing a reduction in dem<strong>and</strong> for air transportation in the Philippines, including<br />
13
adverse changes in local economic <strong>and</strong> political conditions, negative travel advisories issued by<br />
foreign governments, declining interest in the Philippines as a tourist destination, or significant<br />
price increases linked to increases in airport access costs <strong>and</strong> fees imposed on passengers.<br />
(22) Investment Risk<br />
The Company has investment securities, the values of which are dependent on fluctuating market<br />
prices. Any negative movement in the market price of the Company’s investments could affect<br />
the Company’s results of operations.<br />
The foregoing risks are not all inclusive. Other risks that may affect the Company’s business <strong>and</strong><br />
operations may not be included in the above disclosure.<br />
Item 2.<br />
Properties<br />
As of the December 31, 2010, the Company does not own any l<strong>and</strong> or buildings. It leases the<br />
office space used for its corporate headquarters from the Philippine Aerospace Development<br />
Corp., while it leases its hangar, aircraft parking <strong>and</strong> other operational space from the Manila<br />
International <strong>Air</strong>port Authority. Kindly refer to Notes 12, 16 <strong>and</strong> 27 of the Notes to Consolidated<br />
Financial Statements for the detailed discussions on Properties, Leases, Purchases <strong>and</strong> Capital<br />
Expenditure Commitments.<br />
Item 3.<br />
Legal Proceedings<br />
The Company is subject to law suits <strong>and</strong> legal actions in the ordinary course of business. The<br />
Company is not a party to, <strong>and</strong> its properties are not subject of, any material pending legal<br />
proceedings that could be expected to have a material adverse effect on the Company’s financial<br />
position or result of operations.<br />
Item 4.<br />
Submission of Matters to a Vote of Security Holders<br />
There were no matters submitted to a vote of security holders during the fourth quarter of the year<br />
covered by this report.<br />
14
PART II - OPERATIONAL AND FINANCIAL INFORMATION<br />
Item 5.<br />
Market for Registrant’s Common Equity <strong>and</strong> Related Stockholder Matter<br />
Market Information<br />
The principal market for the Company’s common equity is the Philippine Stock Exchange. Sales<br />
prices of the common stock follow:<br />
High<br />
Low<br />
Year 2010<br />
October to December 2010 P133.50 P82.00<br />
As of March 23, 2011, the latest trading date prior to the completion of this annual report, sales<br />
prices of the common stock is at P86.30.<br />
Holders<br />
The number of shareholders of record as of December 31, 2010 was 20. Common shares<br />
outst<strong>and</strong>ing as of December 31, 2010 were 613,236,550.<br />
15
List of Stockholders of Record<br />
As of December 31, 2010<br />
Number of Percent to<br />
Name of Stockholders Shares Held Total Outst<strong>and</strong>ing<br />
1. CP<strong>Air</strong> Holdings, Inc. 400,816,841 65.36%<br />
2. PCD Nominee Corporation (Non-Filipino) 161,004,740 26.25%<br />
3. PCD Nominee Corporation (Filipino) 51,411,960 8.38%<br />
4. Lucille Chiongbian Solon 1,000 0.00%<br />
5. Gloria Jane L. Enrile 500 0.00%<br />
5. Priscilla C. Solon 500 0.00%<br />
6. Jan Carlo Domingo Bunda 200 0.00%<br />
6. Manuel Rio dela Rosa Bunda 200 0.00%<br />
6. Generosa Gonzales Doolani 200 0.00%<br />
6. Mohan Gonzales Doolani 200 0.00%<br />
6. Sunita Gonzales Doolani 200 0.00%<br />
7. Jose F. Buenaventura 1 0.00%<br />
7. Antonio L. Go 1 0.00%<br />
7. Frederick D. Go 1 0.00%<br />
7. James L. Go 1 0.00%<br />
7. John L. Gokongwei, Jr. 1 0.00%<br />
7. Lance Y. Gokongwei 1 0.00%<br />
7. Robina Y. Gokongwei-Pe 1 0.00%<br />
7. Oh Wee Khoon 1 0.00%<br />
7. Ricardo J. Romulo 1 0.00%<br />
Total 613,236,550 100.00%<br />
Dividends<br />
No dividend was declared in 2010.<br />
On March 17, 2011, the Board of Directors of the Company approved the declaration of a regular<br />
cash dividend in the amount of P2.00 per share <strong>and</strong> a special cash dividend in the amount of<br />
P1.00 per share from the unrestricted retained earnings of the Company to all stockholders of<br />
record as of April 14, 2011 <strong>and</strong> payable on May 12, 2011.<br />
Recent Sales of Unregistered Securities<br />
Not Applicable. All shares of the Company are listed in the Philippine Stock Exchange.<br />
16
Item 6.<br />
Management's Discussion <strong>and</strong> Analysis or Plan of Operation<br />
The following discussion should be read in conjunction with the accompanying consolidated<br />
financial statements <strong>and</strong> notes thereto, which form part of this Report. The consolidated financial<br />
statements <strong>and</strong> notes thereto have been prepared in accordance with the Philippine Financial<br />
Reporting St<strong>and</strong>ards (PFRS).<br />
Results of Operations<br />
Year Ended December 31, 2010 Compared with Year Ended December 31, 2009<br />
Revenues<br />
The Company posted revenues of P29.089 billion for the year ended December 31, 2010 which<br />
was 24.8% higher than the P23.311 billion revenues generated last year. Considerable<br />
improvement in revenues is accounted for as follows:<br />
Passenger Revenues<br />
Passenger revenues increased by P5.152 billion or 26.4% to P24.656 billion in the year ended<br />
December 31, 2010 from P19.504 billion revenues posted last year. This increase was primarily<br />
due to the 19.5% increase in passenger volume to 10.5 million in the twelve months ended<br />
December 31, 2010 from 8.8 million in the twelve months ended December 31, 2009. This was<br />
driven by the increase in number of flights year on year <strong>and</strong> higher seat load factor in 2010. The<br />
Company increased the size of its fleet by adding two <strong>Air</strong>bus A320 aircraft <strong>and</strong> two ATR 72-500<br />
aircraft during the twelve months ended December 31, 2009. These aircraft were in operation for<br />
the entire twelve months ended December 31, 2010 thereby resulting in more flights compared to<br />
2009. Moreover, three <strong>Air</strong>bus A320 aircraft arrived during the last quarter of 2010 which further<br />
contributed to the increased number of flights. Total number of flights in 2010 was up by 8.2%<br />
year on year. The increase in passenger revenues for the twelve months ended December 31,<br />
2010 compared with the twelve months ended December 31, 2009 was also attributable to the<br />
increase in the average fares which moved up by 5.8% to P2,357 in 2010 from P2,227 in prior<br />
year.<br />
Cargo Revenues<br />
Cargo revenues increased by P411.194 million or 24.4% to P2.096 billion in the year ended<br />
December 31, 2010 from P1.684 billion in the year ended December 31, 2009, mainly as a result<br />
of the increase in the volume of cargo transported during the period.<br />
Ancillary Revenues<br />
Ancillary revenues increased by P214.862 million or 10.1% to P2.337 billion in the year ended<br />
December 31, 2010 from P2.122 billion registered in 2009. Changes in the Company’s travel<br />
regulations led to the reduction in rebooking, refunds <strong>and</strong> cancellation fees as the Company no<br />
longer allows booking changes including cancellations within 24 hours from the estimated date of<br />
departure. This offset the increase in revenues generated from excess baggage <strong>and</strong> other ancillary<br />
services. Excluding rebooking, refunds <strong>and</strong> cancellation fees, ancillary revenues grew by 33.7%<br />
in the twelve months ended December 31, 2010 compared with the twelve months ended<br />
December 31, 2009. The introduction of additional ancillary revenue sources <strong>and</strong> increases in<br />
rates contributed to the improvement in other ancillary revenues in 2010.<br />
17
Expenses<br />
The Company incurred expenses of P22.639 billion for the year ended December 31, 2010,<br />
12.4% higher than the P20.147 billion expenses incurred last year. Increase in expenses due to<br />
seat growth was partially offset by the strengthening of the Philippine peso against the U.S. dollar<br />
to an average of P45.12 per U.S. dollar for the twelve months ended December 31, 2010 from an<br />
average of P47.64 per U.S. dollar in 2009 based on the Philippine Dealing System weighted<br />
average rates. Expenses increased as a result of the following:<br />
Flying Operations<br />
Flying operations expenses increased by P2.560 billion or 28.9% to P11.417 billion in the year<br />
ended December 31, 2010 from P8.857 billion in the year ended December 31, 2009. Increase in<br />
flying operations expenses was mainly attributable to the increase in aviation fuel expenses by<br />
33.3% to P9.808 billion in the twelve months ended December 31, 2010 from P7.360 billion<br />
incurred last year as a result of the overall increase in the number of flights as well as increase in<br />
aviation fuel prices. Aviation fuel prices rose as referenced by the increase in the average<br />
published MOPS price of U.S. $90.10 per barrel in the twelve months ended December 31, 2010<br />
compared to the U.S. $69.97 per barrel in 2009.<br />
<strong>Air</strong>craft <strong>and</strong> Traffic Servicing<br />
<strong>Air</strong>craft <strong>and</strong> traffic servicing expenses decreased by P170.026 million or 6.5% to P2.462 billion<br />
in the year ended December 31, 2010 from P2.632 billion posted in 2009. Decline was mainly<br />
due to lower airport charges further reduced by the strengthening of the Philippine peso against<br />
the U.S. dollar in 2010.<br />
Repairs <strong>and</strong> Maintenance<br />
Repairs <strong>and</strong> maintenance expenses decreased by P278.995 million or 10.9% to P2.290 billion in<br />
the year ended December 31, 2010 from P2.569 billion last year. Decline in repairs <strong>and</strong><br />
maintenance expenses resulted from the Company’s effective cost management. The appreciation<br />
of the Philippine peso against the U.S. dollar in 2010 also contributed to the decrease.<br />
Depreciation <strong>and</strong> Amortization<br />
Depreciation <strong>and</strong> amortization expenses increased by P183.246 million or 9.6% to P2.101 billion<br />
in the year ended December 31, 2010 from P1.918 billion in the year ended December 31, 2009<br />
mainly because of the addition of two ATR 72-500 aircraft during the course of the twelve<br />
months ended December 31, 2009 which were in operation for the entire twelve months ended<br />
December 31, 2010 <strong>and</strong> the acquisition of three <strong>Air</strong>bus A320 aircraft during the last quarter of<br />
2010. The acquisition of one spare engine in fourth quarter 2009 also contributed to the increase.<br />
<strong>Air</strong>craft <strong>and</strong> Engine Lease<br />
<strong>Air</strong>craft <strong>and</strong> engine lease expenses decreased by P119.031 million or 6.9% to P1.605 billion in<br />
the year ended December 31, 2010 from P1.724 billion in prior year consequent to the return of<br />
two leased Boeing 757 aircraft in June <strong>and</strong> October 2009. Decline in aircraft <strong>and</strong> engine lease<br />
expenses was also attributable to the strengthening of the Philippine peso to an average of P45.12<br />
per U.S. dollar for the twelve months ended December 31, 2010 compared to an average of<br />
P47.64 per U.S. dollar for the twelve months ended December 31, 2009.<br />
18
Reservation <strong>and</strong> Sales<br />
Reservation <strong>and</strong> sales expenses increased by P341.289 million or 34.3% to P1.336 billion in the<br />
year ended December 31, 2010 from P0.995 billion in 2009. This increase was primarily<br />
attributable to the increased advertising <strong>and</strong> promotions expenditures incurred to promote the<br />
Company’s services on the Company’s international routes during the twelve months ended<br />
December 31, 2010. Increase was also due to higher commission expenses as a result of the<br />
overall increase in passenger <strong>and</strong> cargo volumes, especially on the international operations.<br />
General <strong>and</strong> Administrative<br />
General <strong>and</strong> administrative expenses decreased by P127.622 million or 15.5% to P694.888<br />
million in year ended December 31, 2010 from P822.510 million last year. This was due to the<br />
impairment loss on other receivables recognized in 2009 which offset the increase in other<br />
general <strong>and</strong> administrative expenses due to the additional staff <strong>and</strong> service requirements<br />
associated with the increased flight <strong>and</strong> passenger activity in the twelve months ended December<br />
31, 2010.<br />
Passenger Service<br />
Passenger service expenses increased by P58.585 million or 10.1% to P639.481 million in the<br />
year ended December 31, 2010 from P580.896 million in the year ended December 31, 2009.<br />
This increase was mainly due to the additional cabin crew requirements for <strong>Air</strong>bus A319 fleet<br />
consequent to the reconfiguration of said aircraft which increased the seat capacity from 150<br />
passengers to 156 passengers thereby requiring more cabin crew to attend to passenger needs.<br />
The Company also hired additional cabin crew for the three <strong>Air</strong>bus A320 aircraft acquired in the<br />
last quarter of 2010.<br />
Operating Income<br />
As a result of the foregoing, the Company registered operating income of P6.450 billion for the<br />
year ended December 31, 2010, 103.9% higher than the P3.164 billion posted in 2009.<br />
Interest Expense<br />
Interest expense decreased by P81.345 million or 8.0% to P931.482 million in the year ended<br />
December 31, 2010 from P1012.827 million in the year ended December 31, 2009. Decline was<br />
due to the repayment of the Company’s outst<strong>and</strong>ing obligations in accordance with the loan<br />
repayment schedules partially offset by the interest incurred on additional loans availed during<br />
the last quarter of 2010. Likewise, the strengthening of the Philippine peso against the U.S. dollar<br />
in 2010 also contributed to the decline.<br />
Long-term debt as of December 31, 2010 amounted to P18.433 billion, 7.7% higher than the<br />
P17.110 balance as of December 31, 2009. Additional loans were obtained during the last quarter<br />
of 2010.<br />
Foreign Exchange Gains<br />
Foreign exchange gains increased by P158.797 million or 38.0% to P576.979 million in the year<br />
ended December 31, 2010 from P418.182 million in prior year. This was due to the<br />
strengthening of the Philippine peso against the U.S. dollar to an average of P45.12 per U.S.<br />
dollar for the twelve months ended December 31, 2010 from an average of P47.64 per U.S. dollar<br />
in 2009. The Company’s principal exposure to foreign exchange rate fluctuations is in respect of<br />
U.S. dollar denominated long-term debt incurred in connection with aircraft acquisitions.<br />
19
Fuel Hedging Gains<br />
Fuel hedging gains of P474.255 million in the year ended December 31, 2010 resulted from the<br />
higher mark-to-market valuation on fuel hedging positions.<br />
Interest Income<br />
Interest income increased by P228.647 million or 2584.0% to P237.496 million in the year ended<br />
December 31, 2010 from P8.849 million in 2009. Increased cash from operations were placed in<br />
short-term money markets <strong>and</strong> investment securities which earned interests thus resulting to a<br />
significant increase in interest income in the current year.<br />
Fair Value Gains of Financial Assets designated at FVPL<br />
Fair value gains amounted to P107.631 million for the year ended December 31, 2010. This<br />
resulted from the changes in the fair values of quoted debt <strong>and</strong> equity instruments designated at<br />
fair value through profit or loss (FVPL) acquired during the current year.<br />
Equity in Net Income (Loss) of Joint Venture<br />
The Company had equity in net income of joint venture of P25.249 million in the year ended<br />
December 31, 2010, an improvement from last year’s net loss of P25.474 million as the losses of<br />
SIAEP, a company which was established in July 2008 <strong>and</strong> began commercial operations in<br />
August 2009, narrowed. Higher income generated by the current operations of A+ also<br />
accounted for the improvement.<br />
Income before Income Tax<br />
As a result of the foregoing, the Company posted income before income tax of P6.940 billion for<br />
the year ended December 31, 2010, 114.3% higher than the P3.238 billion registered in 2009.<br />
Provision for (Benefit from) Income Tax<br />
Provision for income tax for the year ended December 31, 2010 was P17.760 million. Increase in<br />
provision for income tax was mainly due to the deferred tax liabilities recognized in connection<br />
with the net unrealized foreign exchange gains on foreign currency denominated obligations as a<br />
result of the strengthening of the Philippine peso during the year.<br />
Net Income<br />
Audited net income for the year ended December 31, 2010 surged to P6.922 billion, 112.5%<br />
higher than the P3.258 billion net income posted in 2009.<br />
Year Ended December 31, 2009 Compared with Year Ended December 31, 2008<br />
Revenues<br />
The Company posted revenues of P23.311 billion for the year ended December 31, 2009, 18.4%<br />
higher than the P19.682 billion revenues posted last year. Substantial growth in revenues is<br />
accounted for as follows:<br />
Passenger Revenues<br />
Passenger revenues increased by P2.400 billion or 14.0% to P19.504 billion in the year ended<br />
December 31, 2009 from P17.104 billion in the year ended December 31, 2008. Increase in<br />
passenger revenues was primarily due to the increase in passenger volume to 8.8 million in 2009<br />
from 6.7 million in 2008, resulting from the addition of two <strong>Air</strong>bus A320 aircraft <strong>and</strong> two ATR<br />
20
72-500 aircraft, increased frequency in existing routes <strong>and</strong> the introduction of new destinations in<br />
2009, including Ozamis, Surigao, Siargao, Cauayan, Catarman, Virac <strong>and</strong> Calbayog. In addition,<br />
the Company acquired four <strong>Air</strong>bus A320 aircraft <strong>and</strong> six ATR 72-500 aircraft during the course<br />
of 2008, which were in operation throughout 2009, their first full year of service. Total number of<br />
flights also increased by 41.9% to 80,725 in 2009 from 56,872 in 2008, with the number of<br />
international <strong>and</strong> domestic flights increasing by 24.9% <strong>and</strong> 46.3%, respectively. The effect of the<br />
increase in passenger volume was partially offset by the decrease in the average one-way fares by<br />
13.2% to P2,227 in 2009 from P2,567 in 2008.<br />
Cargo Revenues<br />
Cargo revenues increased by P345.888 million or 25.8% to P1.684 billion in the year ended<br />
December 31, 2009 from P1,339 billion in 2008, primarily as a result of the increase in the<br />
volume of cargo carried on existing routes which, in turn, was largely due to the increase in the<br />
number of flights flown in 2009 as compared with 2008.<br />
Ancillary Revenues<br />
Ancillary revenues increased by P883.028 million or 71.3% to P2.122 billion in the year ended<br />
December 31, 2009 from P1.239 billion in prior year. This increase was primarily due to the<br />
increase in rebooking, refunds <strong>and</strong> cancellation fees <strong>and</strong> increased excess baggage revenues<br />
consequent to the increase in the number of passengers carried. The Company also generated<br />
higher ancillary revenues on a unit basis on its international flights. In addition, 2009 was the first<br />
complete year in which the Company recognized ancillary revenues resulting from the new<br />
services the Company was able to provide with its Navitaire reservation systems, such as charges<br />
for prepaid baggage, advance seat selection <strong>and</strong> website administration as well as commissions<br />
earned in respect of sales of travel insurance <strong>and</strong> from hotel partners.<br />
Expenses<br />
The Company incurred expenses of P20.147 billion for the year ended December 31, 2009,<br />
12.2% higher than the P17.954 billion expenses incurred for the year ended December 31, 2008.<br />
Increase in expenses was partially influenced by the devaluation of the Philippine peso to an<br />
average of P47.637 per U.S. dollar for the twelve months ended December 31, 2009 from an<br />
average of P44.475 per U.S. dollar for the twelve months ended December 31, 2008. Expenses<br />
increased as a result of the following:<br />
Flying Operations<br />
Flying operations expenses decreased by P750.691 million or 7.8% to P8.857 billion in the year<br />
ended December 31, 2009 from P9.608 billion in 2008, primarily as a result of the decrease in<br />
aviation fuel expenses by 13.4% to P7.360 billion in 2009 from P8.502 billion in 2008. Aviation<br />
fuel prices decreased to an average published MOPS price of U.S.$69.97 per barrel in 2009 from<br />
U.S.$121.36 per barrel in 2008. The decrease in aviation fuel prices was partially offset by the<br />
increase in the volume of fuel consumed in 2009 compared with 2008 as a result of an overall<br />
increase in the number of flights. Decrease in flying operations expenses was partially reduced by<br />
the increases in flight deck <strong>and</strong> aviation insurance expenses due to the addition of two <strong>Air</strong>bus<br />
A320 aircraft <strong>and</strong> two ATR 72-500 aircraft in 2009.<br />
<strong>Air</strong>craft <strong>and</strong> Traffic Servicing<br />
<strong>Air</strong>craft <strong>and</strong> traffic servicing expenses increased by P684.923 million or 35.2% to P2.632 billion<br />
in the year ended December 31, 2009 from P1.947 billion in the previous year primarily as a<br />
result of the overall increase in the number of flights, including increased number of international<br />
flights for which l<strong>and</strong>ing <strong>and</strong> take-off fees <strong>and</strong> groundh<strong>and</strong>ling charges are generally higher than<br />
those of domestic flights.<br />
21
Repairs <strong>and</strong> Maintenance<br />
Repairs <strong>and</strong> maintenance expenses increased by P722.437 million or 39.1% to P2,569 billion in<br />
the year ended December 31, 2009 from P1.847 billion in the year ended December 31, 2008,<br />
mainly due to the overall increase in the number of flights <strong>and</strong> the weakening of the Philippine<br />
peso to an average of P47.637 per U.S. dollar for the twelve months ended December 31, 2009<br />
from an average of P44.475 per U.S. dollar for the twelve months ended December 31, 2008.<br />
Depreciation <strong>and</strong> Amortization<br />
Depreciation <strong>and</strong> amortization expenses increased by P370.930 million or 24.0% to P1.918<br />
billion in the year ended December 31, 2009 from P1.547 billion in 2008. Increase was due to<br />
the addition of two ATR 72-500 aircraft in 2009. Moreover, 2009 was the first full year in which<br />
depreciation was recorded on the four ATR 72-500 aircraft delivered in late 2008.<br />
<strong>Air</strong>craft <strong>and</strong> Engine Lease<br />
<strong>Air</strong>craft <strong>and</strong> engine lease expenses increased by P661.039 million or 62.2% to P1.724 billion in<br />
the year ended December 31, 2009 from P1.063 billion last year. This was mainly caused by the<br />
lease of two additional <strong>Air</strong>bus A320 aircraft in 2009 at generally higher lease rates compared<br />
with the other leased aircraft. Devaluation of the Philippine peso against the U.S. dollar during<br />
the year also contributed to the increase.<br />
Reservation <strong>and</strong> Sales<br />
Reservation <strong>and</strong> sales expenses increased by P142.682 million or 16.7% to P994.695 million in<br />
the year ended December 31, 2009 from P852.012 million in the year ended December 31, 2008.<br />
This increase was attributable to the increase in commission expenses due to the overall increase<br />
in the number of passengers, as well as in the increase in advertising <strong>and</strong> promotion costs.<br />
Advertising <strong>and</strong> promotions expenditures increased in line with the growth of the business.<br />
Conversely, increase in reservation <strong>and</strong> sales expenses was partially offset by the decrease in<br />
bookings <strong>and</strong> reservations costs in 2009 as a result of the introduction of the Navitaire reservation<br />
systems.<br />
General <strong>and</strong> Administrative<br />
General <strong>and</strong> administrative expenses increased by P259.677 million or 46.1% to P822.510<br />
million in the year ended December 31, 2009 from P562.834 million in 2008. This increase was<br />
primarily due to the non-recurring provision of P209.662 million relating to the receivable from<br />
<strong>Air</strong> Slovakia, to which the Company had sub-leased two aircraft. Likewise, increase was<br />
attributable to the increase in staff <strong>and</strong> related services expenses associated with the increased<br />
flight <strong>and</strong> passenger activity in 2009. Excluding this non-recurring provision, general <strong>and</strong><br />
administrative expenses would have increased by 8.9%, amounting to P612.848 million.<br />
Passenger Service<br />
Passenger service expenses increased by P70.171 million or 13.7% to P580.896 million in the<br />
year ended December 31, 2009 from P510.725 million in the previous year. This increase was<br />
primarily due to an increase in cabin crew costs, partially offset by a decrease in the cost of<br />
passenger food <strong>and</strong> supplies.<br />
Operating Income<br />
As a result of the foregoing, the Company registered operating income of P3.164 billion for the<br />
year ended December 31, 2009, 83.1% higher than the P1.728 billion posted in 2008.<br />
22
Interest Expense - net<br />
Net interest expense increased by P179.744 million or 21.8% to P1.004 billion in the year ended<br />
December 31, 2009 from P.824 billion in the year ended December 31, 2008. Increase was<br />
primarily due to the additional long-term debt incurred in 2009 relating to the purchase of two<br />
ATR 72-500 aircraft, as well as the devaluation of the peso to an average of P47.637 per U.S.<br />
dollar for the year ended 31 December 2009 from an average of P44.475 per U.S. dollar for the<br />
year ended 31 December 2008. Further, the Company had incurred long-term debt in September<br />
2008 in relation with the acquisition of four ATR 72-500 aircraft, <strong>and</strong> 2009 was the first year in<br />
which interest expenses on these loans were recognized for the entire twelve months.<br />
Foreign Exchange Gains (Losses)<br />
Foreign exchange gains (losses) increased by P1.925 billion or 127.7% to a gain of P418.182<br />
million in the year ended December 31, 2009 from a loss of P1,507.231 million last year. The<br />
Company’s principal exposure to foreign exchange rate fluctuations is in respect of the U.S.<br />
dollar denominated long-term debt incurred in connection with aircraft acquisitions, as well as in<br />
aviation fuel purchase contracts which are also denominated in U.S. dollars.<br />
Fuel Hedging Gains (Losses)<br />
Fuel hedging gains (losses) comprised a non-recurring gain of P685.575 million in the year ended<br />
December 31, 2009 as a result of certain hedging positions in 2009 being marked to market at<br />
forward prices that were higher than those at the times the Company entered into those hedging<br />
positions, as well as from the differences between the valuations of positions at the end of 2008<br />
<strong>and</strong> actual gains <strong>and</strong> losses in 2009. On the other h<strong>and</strong>, fuel hedging gains (losses) comprised a<br />
non-recurring loss of P2,594.492 million in 2008 as a result of the significantly decreasing fuel<br />
prices in late 2008.<br />
Equity in Net Income (Loss) of Joint Venture<br />
The Company had equity in net loss of joint venture of P25.474 million in the year ended<br />
December 31, 2009 compared with equity in net income of joint venture of P15.530 million in<br />
prior year. The decrease was primarily attributable to the net loss incurred by SIAEP, a company<br />
which was established in July 2008 <strong>and</strong> began commercial operations in August 2009, partially<br />
offset by net income from the operations of A+.<br />
Income before Income Tax<br />
As a result of the foregoing, the Company posted income before income tax of P3.238 billion for<br />
the year ended December 31, 2009, 201.7% higher than the P3.183 billion net loss before income<br />
tax registered in 2008.<br />
Provision for (Benefit from) Income Tax<br />
Provision for (benefit from) income tax decreased to a benefit of P19.502 million in the year<br />
ended December 31, 2009 from an expense of P77.321 million in 2008. The decrease of provision<br />
for income tax was due to the recognition of additional deferred tax assets from the net operating<br />
loss carry-over, minimum corporate income tax, impairment loss on receivables <strong>and</strong> asset<br />
retirement obligation. These are temporary differences expected to be reversed more than 12<br />
months after the financial position date.<br />
Net Income<br />
Audited net income for the year ended December 31, 2009 amounted to P3.258 billion, 199.9%<br />
higher than the P3.260 billion net loss posted in the year ended December 31, 2008.<br />
23
Year Ended December 31, 2008 Compared with Year Ended December 31, 2007<br />
Revenues<br />
The Company posted revenues of P19.682 billion for the year ended December 31, 2008, 31.1%<br />
higher than the P15.016 billion revenues generated last year. Significant increase in revenues is<br />
accounted for as follows:<br />
Passenger Revenues<br />
Passenger revenues increased by P4.134 billion or 31.9% to P17.104 billion in the year ended<br />
December 31, 2008 from P12.970 billion in 2007. Increase in passenger revenues was primarily<br />
due to the increased passenger volume to 6.7 million in 2008 from 5.4 million in 2007 resulting<br />
from the addition of four new <strong>Air</strong>bus A320 aircraft <strong>and</strong> six ATR 72-500 aircraft, increased flight<br />
frequencies to existing routes <strong>and</strong> the introduction of new international destinations including<br />
Hanoi, Ho Chi Minh, Kaoshiung, Kota Kinabalu <strong>and</strong> Osaka <strong>and</strong> domestic destinations including<br />
Caticlan, Naga, San Jose, Tuguegarao, Ozamiz, Surigao <strong>and</strong> Busuanga. Total number of flights<br />
increased by 32.3% to 56,872 in 2008 from 43,001 in 2007, with the number of international <strong>and</strong><br />
domestic flights increasing by 29.8% <strong>and</strong> 42.8%, respectively. In addition, increase in the average<br />
one-way fares by 7.6% to P2,567 in 2008 from P2,385 in 2007 also contributed to the growth in<br />
passenger revenues.<br />
Cargo Revenue<br />
Cargo revenues increased by P142.653 million or 11.9% to P1.339 billion in the year ended<br />
December 31, 2008 from P1,196 billion in the year ended December 31, 2007, primarily as a<br />
result of the increase in the number of flights, partially offset by the overall decrease in cargo<br />
fares.<br />
Ancillary Revenue<br />
Ancillary revenues increased by P389.305 million or 45.8% to P1.239 billion in the year ended<br />
December 31, 2008 from P.850 billion in the previous year. This increase was primarily due to<br />
the increase in excess baggage revenues consequent to the increase in the number of passengers<br />
carried in 2008 especially attributable to the growth in international passenger traffic to 1.4<br />
million passengers in 2008 from 1.0 million passengers in 2007. Likewise, increased excess<br />
baggage rates for domestic <strong>and</strong> international flights <strong>and</strong> decreased baggage allowance contributed<br />
to the increase. In addition, the Company recognized new ancillary revenue sources during the<br />
current year resulting from the introduction of the Navitaire reservation systems in April 2008.<br />
This, together with the commissions earned in respect of sales of travel insurance, further<br />
increased ancillary revenues in 2008.<br />
Expenses<br />
The Company incurred expenses of P17.954 billion for the year ended December 31, 2008,<br />
44.1% higher than the P12.460 billion expenses incurred in 2007. Expenses increased as a result<br />
of the following:<br />
Flying Operations<br />
Flying operations expenses increased by P3.903 billion or 68.4% to P9.608 billion in the year<br />
ended December 31, 2008 from P5.705 billion in the year ended December 31, 2007. This<br />
increase was primarily due to the increase in aviation fuel expenses by 82.4% to P8.502 billion in<br />
2008 from P4.661 billion in 2007 consequent to the significant increase in aviation fuel prices to<br />
an average published MOPS price of U.S.$121.36 per barrel in 2008 from U.S.$86.90 per barrel<br />
in 2007. Moreover, volume of fuel consumed also increased as a result of the increased number<br />
24
of flights during the year. Increase in flying operations expenses was further influenced by the<br />
increases in flight deck expenses <strong>and</strong> aviation insurance expenses due to the addition of four<br />
<strong>Air</strong>bus A320 aircraft <strong>and</strong> six ATR 72-500 aircraft in 2008.<br />
<strong>Air</strong>craft <strong>and</strong> Traffic Servicing<br />
<strong>Air</strong>craft <strong>and</strong> traffic servicing expenses increased by P490.136 million or 33.6% to P1.947 billion<br />
in the year ended December 31, 2008 from P1.457 billion last year. This was mainly attributable<br />
to the increase in the number of flights flown in 2008, particularly to the increased number of<br />
international flights where l<strong>and</strong>ing <strong>and</strong> take-off fees <strong>and</strong> groundh<strong>and</strong>ling charges are signific antly<br />
higher compared to domestic airports.<br />
Repairs <strong>and</strong> Maintenance<br />
Repairs <strong>and</strong> maintenance expenses increased by P548.977 million or 42.3% to P1.847 billion in<br />
the year ended December 31, 2008 from P1.298 billion in 2007. This increase was primarily due<br />
to the increase in the number of flights flown in 2008.<br />
Depreciation <strong>and</strong> Amortization<br />
Depreciation <strong>and</strong> amortization expenses increased by P228.712 million or 17.4% to P1.547<br />
billion in the year ended December 31, 2008 from P1.318 billion in the year ended December 31,<br />
2007. This increase was attributable to the addition of six new ATR 72-500 aircraft as well as the<br />
acquisition of a spare engine in 2008.<br />
<strong>Air</strong>craft <strong>and</strong> Engine Lease<br />
<strong>Air</strong>craft <strong>and</strong> engine lease expenses increased by P628.316 million or 144.6% to P1.063 billion in<br />
the year ended December 31, 2008 from P.435 billion in prior year as a result of the acquisition of<br />
four <strong>Air</strong>bus A320 aircraft under operating lease arrangements.<br />
Reservation <strong>and</strong> Sales<br />
Reservation <strong>and</strong> sales expenses decreased by P403.137 million or 32.1% to P852.012 million in<br />
the year ended December 31, 2008 from P1,255.150 million in 2007. Decrease in reservation <strong>and</strong><br />
sales expenses was due to the one-time cost incurred in 2007 as a result of a charge relating to the<br />
termination of the Company’s prior reservation system.<br />
General <strong>and</strong> Administrative<br />
General <strong>and</strong> administrative expenses increased by P117.635 million or 26.4% to P562.834<br />
million in the year ended December 31, 2008 from P445.198 million in the year ended December<br />
31, 2007. This increase was principally due to increase in staff expenses associated with the<br />
increased flight <strong>and</strong> passenger activity in 2008 compared with 2007.<br />
Passenger Service<br />
Passenger service expenses slightly decreased by P6.486 million or 1.3% to P510.725 million in<br />
the year ended December 31, 2008 from P517.210 million last year as a result of the lower<br />
passenger liability insurance costs which were partially offset by higher cabin crew costs in 2008.<br />
Operating Income<br />
As a result of the foregoing, the Company registered operating income of P1.728 billion for the<br />
year ended December 31, 2008, 32.4% lower than the P2.556 billion operating income posted in<br />
2007.<br />
25
Interest Expense - net<br />
Net interest expense declined by P41.859 million or 4.8% to P824.234 million in the year ended<br />
December 31, 2008 from P866.094 million in the year ended December 31, 2007 as a result of the<br />
repayment of the current portion of long-term debt in 2008, partially offset by the increase in the<br />
total long-term debt in the second half of 2008 relating to the purchase of two ATR 72-500<br />
aircraft. Decline in interest expense was also partially offset by the decrease in interest income<br />
due to lower floating interest rates in respect of the Company’s cash equivalents to an average<br />
interest rate of 0.5% in 2008 from an average interest rate of 2.8% in 2007.<br />
Foreign Exchange Gains (Losses)<br />
Foreign exchange gains (losses) decreased to a net loss of P1.507 billion in the year ended<br />
December 31, 2008 from a net gain of P1.970 billion in the previous year. The Company’s<br />
principal exposure to foreign exchange rate fluctuations is in respect of the U.S. dollardenominated<br />
long-term debt incurred in connection with aircraft acquisition. Net foreign<br />
exchange loss in 2008 was principally attributable to the relative weakening of the Philippine<br />
peso compared with the U.S. dollar <strong>and</strong> to the increased U.S. dollar long-term debt in 2008 as the<br />
Company financed the purchase of six aircraft.<br />
Fuel Hedging Gains (Losses)<br />
Fuel hedging gains (losses) comprised a non-recurring loss of P2.594 billion in year ended<br />
December 31, 2008 as a result of the significantly decreasing fuel prices in late 2008 <strong>and</strong> lower<br />
forward fuel prices as of December 31, 2008 compared with the time the Company entered into<br />
the hedging positions. The Company’s fuel hedging gains (losses) comprised a non-recurring gain<br />
of P.030 billion in 2007.<br />
Equity in Net Income of Joint Venture<br />
Equity in net income of joint venture increased by P6.446 million or 71.0% to P15.530 million in<br />
the year ended December 31, 2008 from P9.084 million in 2007. Increase was attributable to the<br />
net profit earned by A+ of P41.3 million in 2008 compared with a net profit of P18.5 million in<br />
2007.<br />
Income before Income Tax<br />
As a result of the foregoing, the Company posted a loss before income tax of P3.183 billion for<br />
the year ended December 31, 2008, a complete turnaround from the P3.699 billion net income<br />
before income tax registered in 2007.<br />
Provision for Income Tax<br />
Provision for income tax decreased to P77.321 million in the year ended December 31, 2008 from<br />
P84.896 million in prior year primarily as a result of the recognition of deferred tax assets on<br />
accrued future restoration costs <strong>and</strong> retirement expenses partially offset by the deferred tax<br />
liabilities relating to unrealized foreign exchange gains.<br />
Net Income<br />
Audited net loss for the year ended December 31, 2008 amounted to P3.260 billion, 190.2%<br />
lower than the P3.614 billion net income posted in the year ended December 31, 2007. Excluding<br />
foreign exchange <strong>and</strong> fuel hedging losses of P4.102 billion in 2008 <strong>and</strong> foreign exchange <strong>and</strong> fuel<br />
hedging gains of P2.000 billion in 2007, the Company’s operations would result to net income of<br />
P841.835 million in 2008 from P1,614.017 million in 2007.<br />
26
As of December 31, 2010, except as otherwise disclosed in the financial statements <strong>and</strong> to the<br />
best of the Company’s knowledge <strong>and</strong> belief, there are no material off-balance sheet transactions,<br />
arrangements <strong>and</strong> obligations (including contingent obligations). As of December 31, 2010,<br />
except as otherwise disclosed in the financial statements <strong>and</strong> to the best of the Company’s<br />
knowledge <strong>and</strong> belief, there are no transactions, arrangements <strong>and</strong> obligations with other<br />
unconsolidated entities or other persons created during the reporting period that would have a<br />
significant adverse impact on the Company’s operations <strong>and</strong>/or financial condition.<br />
Financial Position<br />
December 31, 2010 versus. December 31, 2009<br />
As of December 31, 2010, the Company’s consolidated balance sheet remains solid, with net debt<br />
to equity of 0.40 [total debt after deducting cash <strong>and</strong> cash equivalents (including financ ial assets<br />
held-for-trading at fair value <strong>and</strong> available -for-sale assets) divided by total equity]. Consolidated<br />
assets grew to P49.937 billion from P35.323 billion as of December 31, 2009 as the Company<br />
added aircraft to its fleet. Equity grew to P=17.907 billion from P= 7.255 billion in prior year while<br />
book value per share amounted to P=29.20 as of December 31, 2010 from P=12.45 as of December<br />
31, 2009.<br />
The Company’s cash requirements have been mainly sourced through cash flow from operations.<br />
Net cash from operating activities amounted to P10.024 billion. As of December 31, 2010, net<br />
cash used in investing activities amounted to P5.923 billion which included advances to a related<br />
party <strong>and</strong> pre-delivery payments in connection with the purchase of aircraft. Net cash provided<br />
by financing activities amounted to P1.900 billion. Net cash from financing activities comprised<br />
the proceeds from the issuance of the Company’s common shares partially offset by the<br />
repayments of certain long-term debt.<br />
As of December 31, 2010, except as otherwise disclosed in the financial statements <strong>and</strong> to the<br />
best of the Company’s knowledge <strong>and</strong> belief, there are no events that will trigger direct or<br />
contingent financial obligation that is material to the Company, including any default or<br />
acceleration of an obligation.<br />
Material Changes in the 2010 Financial Statements<br />
(Increase/Decrease of 5% or more versus 2009)<br />
Material changes in the Statements of Consolidated Comprehensive Income were explained in<br />
detail in the management’s discussion <strong>and</strong> analysis or plan of operations stated above.<br />
Consolidated Statements of Financial Position - December 31, 2010 versus December 31, 2009<br />
154.2% increase in Cash <strong>and</strong> Cash Equivalents<br />
Due to the significant improvement in the Company’s operations as evidenced by the 24.8%<br />
growth in revenues.<br />
27
1603.0% increase in Financial Assets at FVPL<br />
Due to the investment in quoted debt <strong>and</strong> equity financial instruments acquired during the year<br />
coupled with the increase in the fair value of such instruments from the initially recognized<br />
amount.<br />
8.5% increase in Receivables<br />
Due to the increased receivable from interests earned on short-term money market placements<br />
<strong>and</strong> investment securities.<br />
6.0% increase in Expendable Parts, Fuel, Materials <strong>and</strong> Supplies<br />
Due to the increase in spare parts <strong>and</strong> supplies in connection with the increase in fleet size during<br />
the year.<br />
22.6% decrease in Other Current Assets<br />
Due to the liquidation of advances to suppliers during the year.<br />
16.6% increase in Property <strong>and</strong> Equipment<br />
Due mainly to the acquisition of three <strong>Air</strong>bus A320 aircraft during the year.<br />
100% increase in Available-for-Sale Investments<br />
Due to the investment in unquoted equity securities acquired during the year slightly decreased by<br />
the changes in the fair value of these investments.<br />
32.3% increase in Other Noncurrent Assets<br />
Due to fees paid by the Company for the option to purchase aircraft.<br />
12.0% increase in Accounts Payable <strong>and</strong> Other Accrued Liabilities<br />
Due to the increase in trade payables <strong>and</strong> accruals of certain operating expenses as a result of the<br />
increased flight <strong>and</strong> passenger activity in the twelve months ended December 31, 2010.<br />
51.8% decrease in Due to Related Parties<br />
Due to payments made during the year.<br />
32.8% increase in Unearned Transportation Revenue<br />
Due to the increase in sale of passenger travel services.<br />
7.7% increase in Long-Term Debt (including Current Portion)<br />
Due to the additional loans availed to finance the purchase of the three <strong>Air</strong>bus A320 aircraft<br />
acquired during the year partially offset by the repayment of certain outst<strong>and</strong>ing long-term debt in<br />
accordance with the repayment schedule <strong>and</strong> the appreciation of the value of Philippine peso<br />
against the U.S. dollar.<br />
10.9% increase in Deferred Tax Liabilities- net<br />
Due to the future taxable amount recognized in connection with unrealized foreign exchange<br />
gains.<br />
40.7% increase in Other Noncurrent Liabilities<br />
Due to the accrual of additional asset retirement cost further increased by the accretion of interest<br />
on the recognized “Asset Retirement Obligation” <strong>and</strong> increased retirement provision.<br />
28
5.3% increase in Paid-Up Capital<br />
Due to the issuance of the Company’s shares of stocks.<br />
78.7% increase in Capital Paid in Excess of Par Value<br />
Due to the issuance of the Company’s shares of stocks above its recorded par value<br />
100% decrease in Net Unrealized Losses on AFS investments<br />
Due to the decrease in fair value of the acquired unquoted equity securities.<br />
351.7% increase in Retained Earnings<br />
Due to the net income during the year.<br />
Fuel prices have significantly increased in 2011 <strong>and</strong> this will have an impact on the Company’s<br />
operating income.<br />
For 2010, there are no significant element of income that did not arise from the Company’s<br />
continuing operations.<br />
The Company generally records higher domestic revenue in January, March, April, May <strong>and</strong><br />
December as festivals <strong>and</strong> school holidays in the Philippines increase the Company’s seat load<br />
factors in these periods. Accordingly, the Company’s revenue is relatively lower in July to<br />
September due to decreased domestic travel during those months. Any prolonged disruption in<br />
the Company’s operations during such peak periods could materially affect its financial results.<br />
In addition, the Company has capital expenditure commitments which principally relate to the<br />
acquisition of aircraft. Kindly refer to Note 27 of the Notes to Consolidated Financial Statements<br />
for the detailed discussion on Purchase <strong>and</strong> Capital Expenditure Commitments.<br />
Key Performance Indicators<br />
The Company sets certain performance measures to gauge its operating performance periodically<br />
<strong>and</strong> to assess its overall state of corporate health. Listed below are major performance measures,<br />
which the Company has identified as reliable performance indicators. Analyses are employed by<br />
comparisons <strong>and</strong> measurements based on the financial data as of December 31, 2010 <strong>and</strong> 2009<br />
<strong>and</strong> for the years ended December 31, 2010 <strong>and</strong> 2009:<br />
Key Financial Indicators 2010 2009<br />
Total Revenue P29.089 billion P23.311 billion<br />
Pre-tax Core Net Income P5.781 billion P2.135 billion<br />
EBITDAR Margin 34.9% 29.2%<br />
Cost per Available Seat Kilometre (ASK) (Php) 2.18 2.15<br />
Cost per ASK (U.S. cents) 4.84 4.53<br />
Seat Load Factor 85% 77%<br />
29
The manner by which the Company calculates the above key performance indicators for both<br />
year-end 2010 <strong>and</strong> 2009 is as follows:<br />
Total Revenue = The sum of revenue obtained from the sale of air<br />
transportation services for passengers <strong>and</strong> cargo <strong>and</strong><br />
ancillary revenue.<br />
Pre-tax Core Net Income = Operating income after deducting net interest expense<br />
<strong>and</strong> adding equity income/loss of joint venture<br />
EBITDAR Margin = Operating income after adding depreciation <strong>and</strong><br />
amortization <strong>and</strong> aircraft <strong>and</strong> engine lease expenses<br />
divided by total revenue<br />
Cost per ASK = Operating expenses, including depreciation <strong>and</strong><br />
amortization expenses <strong>and</strong> the costs of operating leases,<br />
but excluding fuel hedging effects, foreign exchange<br />
effects, net financing charges <strong>and</strong> taxation, divided by<br />
ASK<br />
Seat Load Factor = Total number of passengers divided by the total number<br />
of actual seats on actual flights flown<br />
Item 7.<br />
Financial Statements<br />
The financial statements <strong>and</strong> schedules listed in the accompanying Index to Financial Statements<br />
<strong>and</strong> Supplementary Schedules (page 46) are filed as part of this Form 17-A.<br />
Item 8.<br />
Changes in <strong>and</strong> Disagreements with Accountants on Accounting <strong>and</strong><br />
Financial Disclosure<br />
None.<br />
Item 9.<br />
Independent Public Accountants <strong>and</strong> Audit Related Fees<br />
Independent Public Accountants<br />
Sycip Gorres Velayo & Co. (SGV & Co.) has acted as the Company’s independent public<br />
accountant. The same accounting firm is tabled for reappointment for the current year at the<br />
annual meeting of stockholders. The representatives of the principal accountant have always<br />
been present at prior year’s meetings <strong>and</strong> are expected to be present at the current year’s annual<br />
meeting of stockholders. They may also make a statement <strong>and</strong> respond to appropriate questions<br />
with respect to matters for which their services were engaged.<br />
The current h<strong>and</strong>ling partner of SGV & Co. has been engaged by the Company in 2008 <strong>and</strong> is<br />
expected to be rotated every five years.<br />
30
Audit Fees<br />
The following table sets out the aggregate fees billed for each of the last three years for<br />
professional services rendered by SGV & Co.<br />
2010 2009 2008<br />
Audit <strong>and</strong> audit-related fees P 2,100,000 P 1,700,000 P 950,000<br />
Professional fees for due diligence review<br />
for bond/shares offerings - - -<br />
Tax fees - - -<br />
All other fees relating to facilitating<br />
workshops - - -<br />
Total P 2,100,000 P 1,700,000 P 950,000<br />
31
PART III – CONTROL AND COMPENSATION INFORMATION<br />
Item 10.<br />
Board of Directors <strong>and</strong> Executive Officers of the Registrant<br />
Currently, the Board consists of nine members, of which two are independent directors. The table<br />
below sets forth certain information regarding the members of our Board.<br />
Name Age Position Citizenship<br />
Ricardo J. Romulo……………. 77 Chairman…………………... Filipino<br />
John L. Gokongwei, Jr………... 84 Director……………………. Filipino<br />
James L. Go…………………... 71 Director……………………. Filipino<br />
Lance Y. Gokongwei…………. 44<br />
Director, President <strong>and</strong><br />
Chief Executive Officer…… Filipino<br />
Jose F. Buenaventura…………. 76 Director……………………. Filipino<br />
Robina Y. Gokongwei-Pe…...... 49 Director……………………. Filipino<br />
Frederick D. Go………………. 41 Director……………………. Filipino<br />
Antonio L. Go* …………….… 70 Independent Director……… Filipino<br />
Oh Wee Khoon……………….. 52 Independent Director……… Singaporean<br />
* He is not related to any of the other directors<br />
All of the above directors have served their respective offices since June 24, 2010. There are no<br />
other directors who resigned or declined to st<strong>and</strong> for re-election to the board of directors since the<br />
date of the last annual meeting of the stockholders for any reason whatsoever.<br />
Messrs. Antonio L. Go <strong>and</strong> Oh Wee Khoon are the independent directors of the Company.<br />
The table below sets forth certain information regarding our executive officers.<br />
Name Age Position Citizenship<br />
Bach Johann M. Sebastian……. 49 Senior Vice President...…… Filipino<br />
Hansley Heinrych C. See……... 36 Chief Financial Officer…... Filipino<br />
Victor Emmanuel B. Custodio... 52 Vice President .…………… Filipino<br />
Rosita D. Menchaca…………... 48 Vice President .…………… Filipino<br />
Augusto Edwin A. Bautista*... 59 Vice President .…………… Filipino<br />
C<strong>and</strong>ice Jennifer A. Iyog……... 38 Vice President .…………… Filipino<br />
Joseph G. Macagga…………… 45 Vice President .…………… Filipino<br />
Antonio Jose L. Rodriguez …... 57 Vice President .…………… Filipino<br />
Robin C. Dui………………….. 64 Vice President .…………… Filipino<br />
Jeanette U. Yu………………… 57 Vice President .…………… Filipino<br />
32
Name Age Position Citizenship<br />
Michael S. Shau………………. 47 Vice President .…………… Filipino<br />
Alej<strong>and</strong>ro B. Reyes…………… 43 Vice President .…………… Filipino<br />
Rosalinda F. Rivera………….... 40 Corporate Secretary………. Filipino<br />
William S. Pamintuan………… 48<br />
* Has retired from service effective December 31, 2010<br />
Assistant Corporate<br />
Secretary…………………...<br />
The table below sets forth certain information regarding our senior consultants.<br />
Filipino<br />
Name Age Citizenship<br />
Garry R. Kingshott……………. 58 Australian<br />
Mark Breen……….................... 35 Irish<br />
Niel O’Carroll……………….... 64 Irish<br />
The business experience for the past five years of each of our directors, executive officers <strong>and</strong><br />
senior consultants is set forth below:<br />
Ricardo J. Romulo has been the Chairman of our Board since December 1995. He is also a<br />
director of JG Summit <strong>and</strong> a Senior Partner in Romulo, Mabanta, Buenaventura, Sayoc&De Los<br />
Angeles.Mr. Romulo is also Chairman of Federal Phoenix Assurance Company, Inc., Digital<br />
Telecommunications Phils., Inc. <strong>and</strong> InterPhil Laboratories, Inc. He is a director of SM<br />
Development Corporation, Philippine American Life <strong>and</strong> General Insurance Company, Planters<br />
Development Bank, <strong>and</strong> Zuellig Pharma Corporation. He received his Bachelor of Laws degree<br />
from Georgetown University <strong>and</strong> Doctor of Laws degree from Harvard Law School.<br />
John L. Gokongwei, Jr. has been a director of our Company since December 1995. He is the<br />
Chairman Emeritus <strong>and</strong> a member of the Board of Directors of JG Summit <strong>and</strong> certain of its<br />
subsidiaries. He also continues to be a member of the Executive Committee of JG Summit. He is<br />
currently the Chairman of the Gokongwei Brothers Foundation, Inc., Deputy Chairman <strong>and</strong><br />
Director of United Industrial Corporation Limited <strong>and</strong> Singapore L<strong>and</strong> Limited, <strong>and</strong> a director of<br />
JG Summit Capital Markets Corporation, Digital Telecommunications Phils., Inc., Oriental<br />
Petroleum <strong>and</strong> Minerals Corporation (“OPMC”), First Private Power Corporation <strong>and</strong> Bauang<br />
Private Power Corporation. He is also a non-executive director of A. Soriano Corporation. Mr.<br />
John L. Gokongwei, Jr. received a Master’s degree in Business Administration from De La Salle<br />
University <strong>and</strong> attended the Advanced Management Program at Harvard Business School.<br />
James L. Go has been a director of our Company since May 2002. He is the Chairman <strong>and</strong> Chief<br />
Executive Officer of JG Summit <strong>and</strong>, as such, he heads the Executive Committee of JG Summit.<br />
He is currently the Chairman <strong>and</strong> Chief Executive Officer of Universal Robina Corporation<br />
(“URC”), Robinsons L<strong>and</strong> Corporation (“RLC”), JG Summit Petrochemical Corporation,<br />
Robinsons, Inc., <strong>and</strong> OPMC. He is also the President <strong>and</strong> a Trustee of the Gokongwei Brothers<br />
Foundation, Inc. <strong>and</strong> the Vice Chairman, President <strong>and</strong> Chief Executive Officer of Digital<br />
Telecommunications Phils., Inc. He is also a director of First Private Power Corporation, Bauang<br />
33
Private Power Corporation, Panay Electric Co., United Industrial Corporation Limited, Singapore<br />
L<strong>and</strong> Limited, Marina Centre Holdings, Inc., Hotel Marina City Private Limited <strong>and</strong> JG Summit<br />
Capital Markets Corporation. Mr. James L. Go received a Bachelor of Science degree <strong>and</strong> a<br />
Master of Science degree in Chemical Engineering from the Massachusetts Institute of<br />
Technology.<br />
Lance Y. Gokongwei has been the President <strong>and</strong> Chief Executive Officer of our Company since<br />
1997. He is the President <strong>and</strong> Chief Operating Officer of JG Summit, URC <strong>and</strong> JG Summit<br />
Petrochemical Corporation, <strong>and</strong> the Vice Chairman <strong>and</strong> Deputy Chief Executive Officer of RLC.<br />
He is also the Chairman of Robinsons Savings Bank, Vice Chairman of JG Summit Capital<br />
Markets Corporation, <strong>and</strong> a director of Digital Telecommunications Phils., Inc., OPMC, United<br />
Industrial Corporation Limited, <strong>and</strong> Singapore L<strong>and</strong> Limited. He is also trustee, secretary <strong>and</strong><br />
treasurer of the Gokongwei Brothers Foundation, Inc. Mr. Lance Y. Gokongwei received a<br />
Bachelor of Science degree in Finance <strong>and</strong> a Bachelor of Science degree in Applied Science from<br />
the University of Pennsylvania.<br />
Jose F. Buenaventura has been director of our Company since December 1995. He is a Senior<br />
Partner in Romulo, Mabanta, Buenaventura, Sayoc & De Los Angeles. Mr. Buenaventura is a<br />
Director <strong>and</strong> President of Consolidated Coconut Corporation <strong>and</strong> Milano & Co., Inc. He is also a<br />
member of the Board <strong>and</strong> Corporate Secretary of Country Club Development Corporation <strong>and</strong><br />
The Country Club, Inc. He is a member of the Board <strong>and</strong> Treasurer of Anric Holdings, Inc., a<br />
member of the Board <strong>and</strong> Corporate Secretary of 2B3C Foundation, Inc. <strong>and</strong> Peter Paul<br />
Philippine Corporation. He is a member of the Board of GROW, Inc., Nouveau Manufacturing,<br />
Inc., Total Consolidated Asset Management, Inc., Philippine First Insurance Co., Inc. <strong>and</strong> Philam<br />
Plans, Inc. Mr. Buenaventura received his Bachelor of Laws degree from the Ateneo de Manila<br />
University School of Law <strong>and</strong> his Master of Laws degree from Georgetown University Law<br />
Centre, Washington D.C. He was admitted to the Philippine Bar in 1959.<br />
Robina Y. Gokongwei-Pe was elected as a director of our Company effective 1 August 2007. She<br />
is currently a director of JG Summit, RLC, Robinsons Savings Bank <strong>and</strong> JG Summit Capital<br />
Markets Corporation. She is currently the Senior Vice President <strong>and</strong> Group General Manager of<br />
the Robinsons Retail Group, consisting of Robinsons Department Store, Robinsons Supermarket,<br />
Robinsons H<strong>and</strong>yman, Inc., True Value, Robinsons Specialty Stores, Robinsons Appliances <strong>and</strong><br />
Toys R Us. She obtained her Bachelor of Arts degree in Journalism from the New York<br />
University.<br />
Frederick D. Go was elected as a director of our Company effective 1 August 2007. He is<br />
currently the President <strong>and</strong> Chief Operating Officer of RLC. He is the Group General Manager of<br />
Shanghai Ding Feng Real Estate Development Company Limited, Xiamen <strong>Pacific</strong> Estate<br />
Investment Company Limited, <strong>and</strong> Chengdu Ding Feng Real Estate Development Company<br />
Limited. He is an alternate director of United Industrial Corporation Limited <strong>and</strong> Singapore L<strong>and</strong><br />
Limited. He is the President <strong>and</strong> director of Robinsons Recreation Corporation, Vice Chairman<br />
<strong>and</strong> director of Robinsons Savings Bank, director of URC, Robinsons H<strong>and</strong>yman, Inc.,<br />
Robinsons- Abenson Appliance Corporation, Robinsons Convenience Stores, Inc., JG Summit<br />
Petrochemical Corporation, Robinsons Distribution Centre, Inc., North City Properties, Inc.,<br />
Robinsons Venture Corporation, Waltermart-H<strong>and</strong>yman, Inc., H<strong>and</strong>yman Express Mart, Inc.,<br />
<strong>Cebu</strong> Light Industrial Park, Philippine Hotels Federation <strong>and</strong> Philippine Retailers Association. He<br />
received a Bachelor of Science degree in Management Engineering from the Ateneo De Manila<br />
University.<br />
34
Antonio L. Go was elected as an independent director of our Company on 6 December 2007. He<br />
also currently serves as an independent director of Digital Telecommunications Phils., Inc.,<br />
Director <strong>and</strong> President of Equitable Computer Services, Inc. <strong>and</strong> as director of Equicom Systems<br />
Management, Inc., Medilink Network, Inc., Singapore L<strong>and</strong> Limited, Equicom Manila Holdings,<br />
Klara Holdings, Inc., Motan Corp., United Industrial Corporation, OPMC, Pin-An Holdings, Inc.,<br />
Equicom Information Technology, <strong>and</strong> ALGO Leasing <strong>and</strong> Finance, Inc. He is also a trustee of<br />
Go Kim Pah Foundation <strong>and</strong> Equitable Foundation, Inc. He graduated from Youngstown<br />
University, United States with a Bachelor of Science degree in Business Administration. He<br />
attended the International Advanced Management program at the International Management<br />
Institute, Geneva, Switzerl<strong>and</strong> as well as the Financial Planning/Control program at the ABA<br />
National School of Bankcard Management, Northwestern University, United States.<br />
Oh Wee Khoon was elected as an independent director of our Company on effective 3 January<br />
2008. He is the founder <strong>and</strong> managing director of Sobono Energy Private Limited. He is also a<br />
director of the SingaporeWorkforce Development Agency. He graduated with honours from the<br />
University of Manchester, Institute of Science <strong>and</strong> Technology with a Bachelor of Science degree<br />
in Mechanical Engineering. He obtained his Master’s degree in Business Administration from the<br />
National University of Singapore.<br />
Bach Johann M. Sebastian is the Senior Vice President-Chief Strategist of our Company <strong>and</strong> is<br />
Head of Corporate Strategy effective 5 May 2007. He is also the Senior Vice President <strong>and</strong><br />
Director of Corporate Planning of JG Summit, URC <strong>and</strong> RLC. Prior to joining our Company in<br />
2002, he was Senior Vice President <strong>and</strong> Chief Corporate Strategist at PSI Technologies <strong>and</strong> RFM<br />
Corporation. He was also Chief Economist <strong>and</strong> Director of the Policy <strong>and</strong> Planning Group at the<br />
Department of Trade <strong>and</strong> Industry. He received a Bachelor of Arts degree in Economics from the<br />
University of the Philippines <strong>and</strong> a Master’s degree in Business Management from the Asian<br />
Institute of Management. He has eight years’ experience in the airline industry, all of which have<br />
been with our Company.<br />
Hansley Heinrych C. See is the Chief Financial Officer of our Company. He is also the<br />
Compliance Officer, Corporate Information Officer <strong>and</strong> the head of Investors Relations<br />
Department. He joined <strong>Cebu</strong> <strong>Pacific</strong> in 2005 as Director of Corporate Planning <strong>and</strong> was promoted<br />
to Vice President in December 2006. He joined the JG Summit Group in 2001 with the Corporate<br />
Planning department <strong>and</strong> moved to Litton Mills <strong>and</strong> Universal Robina Corporation —China as<br />
Finance Manager. Prior to joining the group, he worked as a Research Analyst at Abacus<br />
Securities <strong>and</strong> as an Investment Manager at Hambrecht <strong>and</strong> Quist Asia <strong>Pacific</strong> (Philippines), a<br />
private equity/venture capital firm with headquarters in the United States <strong>and</strong> with operations in<br />
Asia. Mr. Hansley Heinrych C. See received his Bachelor of Science degree in Management<br />
Engineering from the Ateneo de Manila University. He has five years’ experience in the airline<br />
industry, all of which have been with our Company.<br />
Victor Emmanuel B. Custodio has been the Vice President for Flight Operations of our Company<br />
since 2004. He is also the Chief Pilot for Operations <strong>and</strong> DC9 Check <strong>Air</strong>man of <strong>Cebu</strong> <strong>Pacific</strong>. He<br />
served as Presidential Pilot <strong>and</strong> Aide de Camp of Philippine Presidents Aquino <strong>and</strong> Ramos. He<br />
was formerly the Acting Director of Operations of the 250th Presidential <strong>Air</strong>lift Wing <strong>and</strong><br />
Squadron Comm<strong>and</strong>er, <strong>Air</strong> Operations Officer of the 250th Presidential <strong>Air</strong>lift Wing. He was<br />
awarded the Minister of National Defence Saber, <strong>and</strong> received a Bronze Cross Medal, seven<br />
Military Merit Medals, two Military Commendation Medals, four Campaign Medals, a Combat<br />
Kagitingan Badge, <strong>and</strong> 17 Commendations. Mr. Victor Emmanuel B. Custodio received his<br />
Bachelor of Science degree in PMA from the Philippine Military Academy in 1983. He has 26<br />
years’ experience in the airline industry, the last 12 of which have been with our Company.<br />
35
Rosita D. Menchaca is the Vice President for Inflight Services of our Company effective May<br />
2009 <strong>and</strong> was previously Vice President for Passenger Service from February 2007 to May 2009.<br />
She initially joined our Company in 1996 as a Cabin Crew Supervisor <strong>and</strong> has since been<br />
promoted twice, first to Director, Cabin Services, in November 1999 <strong>and</strong> in May 2006 to Head of<br />
Passenger Services. She previously worked with Philippine <strong>Air</strong>lines as a flight attendant for two<br />
years <strong>and</strong> joined Saudi Arabian <strong>Air</strong>lines in 1985 as a Senior Flight Attendant for eight years. Ms.<br />
Rosita D. Menchaca received her Bachelor of Science degree in Psychology from Silliman<br />
University. She has 26 years’ experience in the airline industry, the last 13 of which have been<br />
with our Company.<br />
Augusto Edwin A. Bautista has been the Vice President for Sales of our Company since 2006.<br />
He previously worked as Cargo Manager for Swiss <strong>Air</strong> Transport <strong>and</strong> served as Sales <strong>and</strong><br />
Marketing Consultant for Travel Excellence Corporation, a general sales agent for Czechoslovak<br />
<strong>Air</strong>lines. He also had various work experience in travel agencies <strong>and</strong> restaurant businesses. Mr.<br />
Augusto Edwin A. Bautista received his Bachelor of Science degree in Commerce, major in<br />
Management, from the De La Salle College. He has 27 years’ experience of the airline industry,<br />
the last 13 of which have been with our Company.<br />
C<strong>and</strong>ice Jennifer A. Iyog has been the Vice President for Marketing <strong>and</strong> Distribution of our<br />
Company since September 2008 <strong>and</strong> was Vice President for Marketing <strong>and</strong> Product from<br />
February 2007 to September 2008. She was formerly the General Manager of Jobstreet.com <strong>and</strong>,<br />
as such, she was part of a team that launched our Company <strong>and</strong> developed it into the country’s<br />
leading e-recruitment company. Prior to this, she was also the marketing manager of NABISCO<br />
<strong>and</strong> was part of the team that launched our Company’s Philippine operations. She also worked at<br />
URC as Product Manager <strong>and</strong>, as such, h<strong>and</strong>led major snack food br<strong>and</strong>s of URC such as Chippy,<br />
Piattos <strong>and</strong> Nova. Ms. C<strong>and</strong>ice Jennifer A. Iyog received her Bachelor of Science degree in<br />
Management from the Ateneo de Manila University. She has six years’ experience in the airline<br />
industry, all of which have been with our Company.<br />
Joseph G. Macagga has been the Vice President for Fuel <strong>and</strong> Cargo Operations of our Company<br />
since September 2004. He started with <strong>Cebu</strong> <strong>Pacific</strong> as Manager for Purchasing <strong>and</strong> h<strong>and</strong>led<br />
Internal Audit for more than two years. He served as Audit Manager for JG Summit Holdings,<br />
Inc. for five years <strong>and</strong> worked for the Audit Division of SyCip Gorres Velayo & Co for three<br />
years. A Certified Public Accountant, Mr. Joseph G. Macagga received his Bachelor of Science<br />
degree in Commerce, Major in Accounting from the University of Sto. Tomas. He has 13 years’<br />
experience in the airline industry, all of which have been with our Company.<br />
Antonio Jose L. Rodriguez has been the Vice President for <strong>Air</strong>port Services of our Company<br />
since March 2010. He previously worked with various multinational companies including<br />
California Manufacturing Co. from 1993 to 2003, initially as Human Resources Manager <strong>and</strong><br />
later on as Director <strong>and</strong> finally as Vice President in charge of the Human Resources Group.<br />
Hewas also AVP-Human Resources of Allied Thread Co. Inc. for the period from 1990 to 1992.<br />
Prior to this, he was employed with Triumph International (Phils.) Inc. from 1985 to 1990. He is a<br />
graduate of De La Salle University where he completed Lia-Com a double degree course,<br />
majoring in Business Administration <strong>and</strong> Behavioural Sciences. He has five years’ experience in<br />
the airline industry, all of which have been with our Company.<br />
36
Robin C. Dui has been the Vice President - Comptroller of our Company since 1998. He was<br />
formerly with the Audit Division of SyCip Gorres Velayo & Co for four years. He previously<br />
worked with Philippine <strong>Air</strong>lines for 18 years as Manager -General Accounting, Director -<br />
Operations Accounting, Director - Revenue Accounting <strong>and</strong> Vice President - Comptroller. He<br />
also previously held the position of Director - Finance of Gr<strong>and</strong><strong>Air</strong> for one year. He has had<br />
experience in the airline industry for 19 years. A Certified Public Accountant, Mr. Robin C. Dui<br />
obtained a Bachelor of Science degree in Business Administration. He has 30 years’ experience<br />
in the airline industry, 12 of which have been with our Company.<br />
Jeanette U. Yu has been the Vice President -Treasurer of our Company since 1995. She is also<br />
the Chief Financial Officer of Oriental Petroleum <strong>and</strong> Minerals Corporation <strong>and</strong> the Senior Vice<br />
President <strong>and</strong> Treasurer of JG Summit Capital Markets Corporation <strong>and</strong> Vice President of URC.<br />
Prior to joining URC in 1980, she worked for AEA Development Corporation <strong>and</strong> Equitable<br />
Banking Corporation. Ms. Jeanette U. Yu received her Bachelor of Science degree in Business<br />
Administration from St. Theresa’s College in Quezon City. She has 15 years’ experience in the<br />
airline industry, all of which have been with our Company.<br />
Michael S. Shau was appointed Vice President for People <strong>and</strong> Administration Services of our<br />
Company effective March 2010. He has been with the JG Summit Group since January 1999 <strong>and</strong><br />
has held various senior management positions with his last assignment as Business Unit General<br />
Manager of Universal Robina Corporation - Packaging Division. He received a degree in<br />
Industrial Management Engineering, Minor in Mechanical Engineering <strong>and</strong> completed all<br />
academic requirements for a Master’s degree in Business Management, both from De La Salle<br />
University. He has two years’ experience of the airline industry, both of which have been with<br />
our Company.<br />
Alej<strong>and</strong>ro B. Reyes was appointed Vice President for Commercial Planning of our Company<br />
effective January 2008. He previously worked as Senior Vice President of PhilWeb. Prior to this,<br />
he held various positions with The Inquirer Group, the latest of which was Senior Vice President<br />
<strong>and</strong> Chief Operating Officer of the Inquirer Publications, Inc. He has alsoworked with Power<br />
Sector Assets <strong>and</strong> Liabilities Management Group (PSALM), I-QUEST Corporation, Bloomberg<br />
LP, Nomura Research Institute <strong>and</strong> Businessworld Publishing Corporation. Mr. Alej<strong>and</strong>ro B.<br />
Reyes graduated Summa Cum Laude from Georgetown University with a Bachelor of Science<br />
degree in International Economics. He received his Master’s degree in Business Administration<br />
from the University of Virginia. He has two years of experience in the airline industry, which has<br />
been with our Company.<br />
Rosalinda F. Rivera was appointed Corporate Secretary of our Company effective 31 October<br />
2006. She is also the Corporate Secretary of JG Summit, URC, RLC, JG Summit Petrochemical<br />
Corporation <strong>and</strong> CP<strong>Air</strong> Holdings, Inc. Prior to joining the JG group, shewas a Senior Associate at<br />
Puno <strong>and</strong> Puno Law Offices. She received a Juris Doctor degree from the Ateneo de Manila<br />
University School of Law <strong>and</strong> a Master of Law degree in International Banking from Boston<br />
University School of Law. She was admitted to the Philippine Bar in 1995. She has four years’<br />
experience in the airline industry, all of which have been with our Company.<br />
William S. Pamintuan has been the Assistant Corporate Secretary of our Company since<br />
December 1995. He is also the Corporate Secretary <strong>and</strong> Senior Vice President of Legal Services<br />
of Digital Telecommunication Phils., Inc. <strong>and</strong> Digitel Mobile Phils., Inc., <strong>and</strong> the Head of<br />
DigitelOne <strong>and</strong> Human Resources Division of DIGITEL. He is a Director of the Philippine<br />
Chamber of Telecommunication Operators, Inc. <strong>and</strong> a member of the Telecommunications <strong>and</strong><br />
37
Broadcast Attorneys’ Association of the Philippines. He obtained his Bachelor of Laws degree<br />
from the University of the Philippines <strong>and</strong> has 15 years’ experience in the airline industry, all of<br />
which have been with our Company.<br />
Garry R. Kingshott is one of our Company’s senior consultants. He provides advice to the<br />
President with respect to fare structuring, cost management, route development <strong>and</strong> market entry<br />
strategies. Garry was previously with Jet Lite (India) <strong>and</strong> Ansett International Limited (Australia)<br />
as their Chief Executive officer. Garry has 20 years’ combined experience in aviation consultancy<br />
<strong>and</strong> the airline industry, <strong>and</strong> joined our Company in 2008.<br />
Mark Breen is one of our Company’s senior consultants. He provides advice to the President on<br />
operations-related functions, including airport services, emergency response procedures, airline<br />
service quality, supplier evaluation, product selection, sourcing of spares, inventory management,<br />
crew management <strong>and</strong> control centre management. Mark was previously with Sama as their Chief<br />
Operating Officer. Mark was educated at the College of Commerce <strong>and</strong> is a graduate of Transport<br />
Management. He also has a Masters Degree in <strong>Air</strong> Transport Management from the College of<br />
Aeronautics, School of Engineering of Cranfield University. He a vast amount of airline<br />
experience from his time with, among others, Sama, <strong>Air</strong>Asia, Gulf <strong>Air</strong> <strong>and</strong> Ryan <strong>Air</strong>. He has 15<br />
years’ experience in the airline industry, <strong>and</strong> joined our Company in 2009.<br />
Niel O’ Carroll is one of our Company’s senior consultants. He provides advice to the President<br />
on all engineering, maintenance, fleet management <strong>and</strong> other aircraft-related concerns. Niel<br />
served with various airlines such as Ryanair <strong>and</strong> TransAer International <strong>Air</strong>lines <strong>and</strong> has worked<br />
with various leasing companies before joining our Company. Niel brings to us his fleet<br />
management <strong>and</strong> technical expertise. He has 45 years’ experience in the airline industry.<br />
The Company’s executive officers can be reached at the address of its business office at <strong>Air</strong>line<br />
Operations Center, Domestic Road, Pasay City.<br />
Involvement in Certain Legal Proceedings of Directors <strong>and</strong> Executive Officers<br />
Except as otherwise disclosed, to the best of the Company’s knowledge <strong>and</strong> belief <strong>and</strong> after due<br />
inquiry, none of the Company’s directors, nominees for election as director, or executive officer<br />
have in the past five years: (i) had any petition filed by or against any business of which such<br />
person was a general partner or executive officer either at the time of the bankruptcy or within a<br />
two year period of that time; (ii) convicted by final judgment in a criminal proceeding, domestic<br />
or foreign, or have been subjected to a pending judicial proceeding of a criminal nature, domestic<br />
or foreign, excluding traffic violations <strong>and</strong> other minor offences; (iii) subjected to any order,<br />
judgment, or decree, not subsequently reversed, suspended or vacated, of any court of competent<br />
jurisdiction, domestic or foreign, permanently or temporarily enjo ining, barring, suspending or<br />
otherwise limiting their involvement in any type of business, securities, commodities or banking<br />
activities; or (iv) found by a domestic or foreign court of competent jurisdiction (in a civil action),<br />
the Philippine SEC or comparable foreign body, or a domestic or foreign exchange or other<br />
organized trading market or self regulatory organization, to have violated a securities or<br />
commodities law or regulation <strong>and</strong> the judgment has not been reversed, suspended, or vacated.<br />
38
Family Relationship<br />
• Mr. James L. Go is the brother of Mr. John L. Gokongwei, Jr.<br />
• Mr. Lance Y. Gokongwei is the son of Mr. John L. Gokongwei, Jr.<br />
• Mr. Frederick D. Go is the nephew of Mr. John L. Gokongwei, Jr.<br />
• Ms. Robina Y. Gokongwei-Pe is the daughter of Mr. John L. Gokongwei, Jr.<br />
Item 11.<br />
Executive Compensation<br />
The following are our Company’s Chief Executive Officer (“CEO”) <strong>and</strong> four most highly<br />
compensated executive officers for the years ended 2009, 2010 <strong>and</strong> 2011 estimates:<br />
Name<br />
Position<br />
Lance Y. Gokongwei . . . . . . . . . . . . . . . . . . …………… President <strong>and</strong> CEO<br />
Victor Emmanuel B. Custodio . . . . . . . . . . . . …………..Vice President<br />
Antonio Jose L. Rodriguez. . . . . . . . . . . . . . . ………….. Vice President<br />
Michael S. Shau . . . . . . . . . . . . . . . . . . . . ………………Vice President<br />
Jeanette U. Yu . . . . . . . . . . . . . . . . . . . . . . . . …………...Vice President<br />
The following table identifies <strong>and</strong> summarizes the aggregate compensation of the Company’s<br />
CEO <strong>and</strong> the four most highly compensated executive officers for the years ended 2009, 2010 <strong>and</strong><br />
2011estimates:<br />
Year Salaries Bonuses<br />
Other<br />
Income<br />
Total<br />
CEO <strong>and</strong> the most highly<br />
compensated executive officers<br />
named above 2009 16,827,982 1,426,437 - 18,254,418<br />
2010 24,888,814 2,334,133 - 27,222,947<br />
2011<br />
Estimates 29,077,868 2,462,511 - 31,540,378<br />
Aggregate compensation paid to<br />
all officers <strong>and</strong> Directors as a<br />
group unnamed 2009 59,725,024 5,100,974 - 64,825,998<br />
2010 73,989,515 6,515,634 - 80,505,149<br />
2011<br />
Estimates 77,133,464 6,541,463 - 83,674,928<br />
St<strong>and</strong>ard Arrangements<br />
Other than payment of reasonable per diem as may be determined by the Board for every<br />
meeting, there are no st<strong>and</strong>ard arrangements pursuant to which directors of the Company are<br />
compensated, or are to be compensated, directly or indirectly, for any services provided as a<br />
director for the last completed year <strong>and</strong> the ensuing year.<br />
39
Other Arrangements<br />
There are no other arrangements pursuant to which directors of the Company are compensated, or<br />
are to be compensated, directly or indirectly, for any services provided as a director for the last<br />
completed year <strong>and</strong> the ensuing year.<br />
Employment Contracts <strong>and</strong> Termination of Employment <strong>and</strong> Change-in-Control Arrangement<br />
There are no agreements between the Company <strong>and</strong> its directors <strong>and</strong> executive officers providing<br />
for benefits upon termination of employment, except for such benefits to which they may be<br />
entitled under the Company’s pension plans.<br />
Warrants <strong>and</strong> Options Outst<strong>and</strong>ing<br />
There are no outst<strong>and</strong>ing warrants or options held by the Company’s CEO, the named executive<br />
officers, <strong>and</strong> all officers <strong>and</strong> directors as a group.<br />
Item 12.<br />
Security Ownership of Certain Beneficial Owners <strong>and</strong> Management<br />
(1) Security Ownership of Certain Record <strong>and</strong> Beneficial Owners<br />
As of December 31, 2010, the Company knows no one who beneficially owns in excess of 5% of<br />
the Company’s common stock except as set forth in the table below.<br />
Title of<br />
Class<br />
Names <strong>and</strong> addresses of<br />
record owners <strong>and</strong><br />
relationship with the<br />
Corporation<br />
Name of<br />
beneficial owner<br />
<strong>and</strong> relationship<br />
with record<br />
owner<br />
Citizenship<br />
No. of<br />
Shares Held<br />
% to Total<br />
Outst<strong>and</strong>ing<br />
Common<br />
Common<br />
Common<br />
CP<strong>Air</strong> Hold ings, Inc.<br />
43/F Robinsons Equitable<br />
Tower, ADB Avenue, Ortigas<br />
Center, Pasig City<br />
(stockholder)<br />
PCD Nominee Corporation<br />
(Non-Filipino)<br />
37/F Tower 1, The Enterprise<br />
Center, Ayala Ave. corner Paseo<br />
de Roxas, Makati City<br />
(stockholder)<br />
PCD Nominee Corporation<br />
(Filipino)<br />
37/F Tower 1, The Enterprise<br />
Center, Ayala Ave. corner Paseo<br />
de Roxas, Makati City<br />
(stockholder)<br />
Same as record<br />
owner<br />
(See note 1)<br />
PCD Participants<br />
<strong>and</strong> their clients<br />
(See note 2)<br />
PCD Participants<br />
<strong>and</strong> their clients<br />
(See note 2)<br />
Filipino 400,816,841 65.36 %<br />
Non-Filipino 161,004,740<br />
(See note 3)<br />
26.25%<br />
Filipino 51,411,960 8.38%<br />
40
1. CP<strong>Air</strong> Holdings, Inc. is a wholly -owned subsidiary of JG Summit Holdings, Inc. Under the By -laws of CP<strong>Air</strong><br />
Holdings, Inc., the President is authorised to represent the corporation at all functions <strong>and</strong> proceedings. The<br />
incumbent President of CP<strong>Air</strong> Holdings, Inc. is Mr. Lance Y. Gokongwei.<br />
2. PCD Nominee Corporation is the registered owner of the shares in the books of the Corporation’s transfer agent.<br />
PCD Nominee Corporation is a corporation wholly -owned by Philippine Depository <strong>and</strong> Trust Corporation, Inc.<br />
(formerly the Philippine Central Depository) (“PDTC”), whose sole purpose is to act as nominee <strong>and</strong> legal title<br />
holder of all shares of stock lodged in the PDTC. PDTC is a private corporation organized to establish a central<br />
depository in the Philippines <strong>and</strong> introduce scripless or book-entry trading in the Philippines. Under the current<br />
PDTC system, only participants (brokers <strong>and</strong> custodians) will be recognized by PDTC as the beneficial owners of<br />
the lodged shares. Each beneficial owner of shares through his participant will be the beneficial owner to the<br />
extent of the number of shares held by such participant in the records of the PCD Nominee.<br />
3. Out of t he PCD Nominee Corporation (Non-Filipino) account, “The Hongkong <strong>and</strong> Shanghai Banking Corp., Ltd -<br />
Client’s Acct.” holds for various trust accounts the following shares of the Corporation as of December 31, 2010:<br />
No. of shares<br />
% to Outst<strong>and</strong>ing<br />
The Hongkong <strong>and</strong> Shanghai Banking Corp. Ltd. - Clients’ Acct. 117,763,504 19.20%<br />
The securities are voted by the trustee’s designated officers who are not known to the Corporation.<br />
(2) Security Ownership of Management<br />
Title of<br />
Class Name of Beneficial Owner Position<br />
Amount <strong>and</strong><br />
Nature of<br />
Beneficial<br />
Ownership<br />
Citizenship<br />
% to Total<br />
Outst<strong>and</strong>ing<br />
Named Executive Officers 1<br />
Common Lance Y. Gokongwei Director, President<br />
<strong>and</strong> Chief<br />
Executive Officer 1 Filipino *<br />
Victor Emmanuel B.Custodio Vice President - Filipino -<br />
Antonio Jose L. Rodriguez Vice President - Filipino -<br />
Michael S. Shau Vice President - Filipino -<br />
Jeanette U. Yu Vice President - Filipino -<br />
Subtotal 1 *<br />
Other Directors, Executive Officers <strong>and</strong><br />
Nominees<br />
Common Ricardo J. Romulo Chairman 1 Filipino *<br />
Common John L. Gokongwei, Jr. Director 1 Filipino *<br />
Common James L. Go Director 1 Filipino *<br />
Common Jose F. Buenaventura Director 1 Filipino *<br />
Common Robina Y. Gokongwei-Pe Director 1 Filipino *<br />
Common Frederick D.Go Director 1 Filipino *<br />
Common Antonio L.Go<br />
Independent<br />
Director 1 Filipino *<br />
Common Oh Wee Khoon<br />
Independent<br />
Director 1 Singaporean *<br />
Subtotal 8 *<br />
All directors <strong>and</strong> executive officers as a group unnamed 9 *<br />
41
1<br />
As defined under Part IV (B) (1) (b) of SRC Rule 12, the “named executive officers” to be listed refer to<br />
the Chief Executive Officer <strong>and</strong> those that are the four (4) most highly compensated executive officers as of<br />
Decemb er 31, 2010.<br />
* less than 0.01%<br />
(3) Voting Trust Holders of 5% or More<br />
There are no persons holding more than 5% of a class of share under a voting trust or similar<br />
agreement as of December 31, 2010.<br />
(4) Change in Control<br />
As of December 31, 2010, there are no arrangements which may result in a change in control of<br />
the Company.<br />
Item 13.<br />
Certain Relationships <strong>and</strong> Related Transactions<br />
The Company, in its regular conduct of business, had engaged in transactions with its ultimate<br />
parent company, its joint venture <strong>and</strong> affiliates. See Note 26 (Related Party Transactions) of the<br />
Notes to the Consolidated Financial Statements in the accompanying Audited Financial<br />
Statements filed as part of this Form 17-A.<br />
PART IV – CORPORATE GOVERNANCE<br />
Item 14.<br />
Corporate Governance<br />
The Company’s Board of Directors approved the Corporate Governance Manual (as amended) on<br />
June 15, 2007 in order to monitor <strong>and</strong> assess the level of the Company’s compliance with leading<br />
practices on good corporate governance as specified in pertinent Philippine SEC circulars. Aside<br />
from establishing specialized committees to aid in complying with the principles of good<br />
corporate governance, the manual also outlines specific investor’s rights <strong>and</strong> protections <strong>and</strong><br />
enumerates particular duties expected from the Board members, officers <strong>and</strong> employees. It also<br />
features a disclosure system which highlights adherence to the principles of transparency,<br />
accountability <strong>and</strong> fairness. A compliance officer is tasked with the formulation of specific<br />
measures to determine the level of compliance with the Manual by the Board members, officers<br />
<strong>and</strong> employees. To date, the Company has not encountered any deviations from the Manual’s<br />
st<strong>and</strong>ards.<br />
42
PART V – EXHIBITS AND SCHEDULES<br />
Item 15. Exhibits <strong>and</strong> Reports on SEC Form 17-C<br />
Exhibits<br />
See accompanying Index to Exhibits (page 46)<br />
Reports on SEC Form 17-C<br />
List of Corporate Disclosures/Replies to SEC Letters<br />
Under SEC Form 17-C<br />
July 1, 2010 to December 31, 2010<br />
Date of Disclosure<br />
Description<br />
October 21, 2010 Disclosure on shareholdings of Officers of <strong>Cebu</strong> <strong>Air</strong>, Inc.<br />
November 5, 2010 Press Release “<strong>CEB</strong> exp<strong>and</strong>s international operations”<br />
November 8, 2010 Press Release “<strong>CEB</strong> posts 37% international passenger growth for Jan-Sept 2010”<br />
November 11, 2010 Notice of local investors/analysts <strong>and</strong> business press briefing<br />
November 11, 2010 Disclosure on exercise of over-allotment option<br />
November 15, 2010 Press Release “<strong>CEB</strong> profit surges to P4.8 billion”<br />
December 16, 2010 Press Release “<strong>CEB</strong> ready for more competition with international LCCs”<br />
December 20, 2010 Acquisition of <strong>Cebu</strong> <strong>Air</strong>, Inc. common shares by JG Summit Holdings, Inc.<br />
December 21, 2010 Acquisition of <strong>Cebu</strong> <strong>Air</strong>, Inc. common shares by JG Summit Holdings, Inc.<br />
December 22, 2010 Acquisition of <strong>Cebu</strong> <strong>Air</strong>, Inc. common shares by JG Summit Holdings, Inc.<br />
December 23, 2010 Acquisition of <strong>Cebu</strong> <strong>Air</strong>, Inc. common shares by JG Summit Holdings, Inc.<br />
43
COVER SHEET<br />
1 5 4 6 7 5<br />
SEC Registration Number<br />
C E B U A I R , I N C . A N D S U B S I D I A R I E S<br />
(Company’s Full Name)<br />
2 n d F l o o r , D o ñ a J u a n i t a M a r q u e z L<br />
i m B u i l d i n g , O s m e ñ a B o u l e v a r d , C e<br />
b u<br />
C i t y<br />
(Business Address: No. Street City/Town/Province)<br />
Robin C. Dui (032) 255-4552<br />
(Contact Person)<br />
(Company Telephone Number)<br />
1 2 3 1 A A F S<br />
Month Day (Form Type) Month Day<br />
(Fiscal Year)<br />
(Annual Meeting)<br />
(Secondary License Type, If Applicable)<br />
Dept. Requiring this Doc.<br />
Amended Articles Number/Section<br />
Total Amount of Borrowings<br />
Total No. of Stockholders Domestic Foreign<br />
To be accomplished by SEC Personnel concerned<br />
File Number<br />
LCU<br />
Document ID<br />
Cashier<br />
S T A M P S<br />
Remarks: Please use BLACK ink for scanning purposes.<br />
*SGVMC115503*
SyCip Gorres Velayo & Co.<br />
6760 Ayala Avenue<br />
1226 Makati City<br />
Philippines<br />
Phone: (632) 891 0307<br />
Fax: (632) 819 0872<br />
www.sgv.com.ph<br />
BOA/PRC Reg. No. 0001<br />
SEC Accreditation No. 0012-FR-2<br />
INDEPENDENT AUDITORS’ REPORT<br />
The Stockholders <strong>and</strong> the Board of Directors<br />
<strong>Cebu</strong> <strong>Air</strong>, Inc.<br />
2nd Floor, Doña Juanita Marquez Lim Building<br />
Osmeña Boulevard, <strong>Cebu</strong> City<br />
We have audited the accompanying consolidated financial statements of <strong>Cebu</strong> <strong>Air</strong>, Inc. <strong>and</strong><br />
Subsidiaries, which comprise the consolidated statements of financial position as at<br />
December 31, 2010 <strong>and</strong> 2009, <strong>and</strong> the consolidated statements of comprehensive income,<br />
statements of changes in equity <strong>and</strong> statements of cash flows for each of the three years in the period<br />
ended December 31, 2010, <strong>and</strong> a summary of significant accounting policies <strong>and</strong> other explanatory<br />
information.<br />
Management’s Responsibility for the Consolidated Financial Statements<br />
Management is responsible for the preparation <strong>and</strong> fair presentation of these consolidated financial<br />
statements in accordance with Philippine Financial Reporting St<strong>and</strong>ards, <strong>and</strong> for such internal control<br />
as management determines is necessary to enable the preparation of consolidated financial statements<br />
that are free from material misstatement, whether due to fraud or error.<br />
Auditors’ Responsibility<br />
Our responsibility is to express an opinion on these consolidated financial statements based on our<br />
audits. We conducted our audits in accordance with Philippine St<strong>and</strong>ards on Auditing. Those<br />
st<strong>and</strong>ards require that we comply with ethical requirements <strong>and</strong> plan <strong>and</strong> perform the audit to obtain<br />
reasonable assurance about whether the consolidated financial statements are free from material<br />
misstatement.<br />
An audit involves performing procedures to obtain audit evidence about the amounts <strong>and</strong> disclosures<br />
in the consolidated financial statements. The procedures selected depend on the auditor’s judgment,<br />
including the assessment of the risks of material misstatement of the consolidated financial statements,<br />
whether due to fraud or error. In making those risk assessments, the auditor considers internal control<br />
relevant to the entity’s preparation <strong>and</strong> fair presentation of the consolidated financial statements in<br />
order to design audit procedures that are appropriate in the circumstances, but not for the purpose of<br />
expressing an opinion on the effectiveness of the entity’s internal control. An audit also includes<br />
evaluating the appropriateness of accounting policies used <strong>and</strong> the reasonableness of accounting<br />
estimates made by management, as well as evaluating the overall presentation of the consolidated<br />
financial statements.<br />
We believe that the audit evidence we have obtained is sufficient <strong>and</strong> appropriate to provide a basis for<br />
our audit opinion.<br />
*SGVMC115503*<br />
A member firm of Ernst & Young Global Limited
- 2 -<br />
Opinion<br />
In our opinion, the consolidated financial statements present fairly, in all material respects, the<br />
financial position of <strong>Cebu</strong> <strong>Air</strong>, Inc. <strong>and</strong> Subsidiaries as at December 31, 2010 <strong>and</strong> 2009, <strong>and</strong> its<br />
financial performance <strong>and</strong> its cash flows for each of the three years in the period ended<br />
December 31, 2010 in accordance with Philippine Financial Reporting St<strong>and</strong>ards.<br />
SYCIP GORRES VELAYO & CO.<br />
March 17, 2011<br />
*SGVMC115503*
<strong>CEB</strong>U AIR, INC. AND SUBSIDIARIES<br />
CONSOLIDATED STATEMENTS OF FINANCIAL POSITION<br />
ASSETS<br />
December 31<br />
2010 2009<br />
Current Assets<br />
Cash <strong>and</strong> cash equivalents (Note 7) P=9,763,288,972 P=3,840,859,455<br />
Financial assets at fair value through profit<br />
or loss (Note 8) 3,879,438,631 227,794,364<br />
Receivables (Note 9) 862,409,591 794,934,681<br />
Expendable parts, fuel, materials <strong>and</strong> supplies (Note 10) 370,032,035 348,972,488<br />
Other current assets (Note 11) 264,073,803 341,138,916<br />
Total Current Assets 15,139,243,032 5,553,699,904<br />
Noncurrent Assets<br />
Property <strong>and</strong> equipment (Notes 12, 16, 27 <strong>and</strong> 28) 33,985,701,079 29,155,171,390<br />
Investment in joint ventures (Note 13) 369,644,738 366,355,686<br />
Available-for-sale investment (Note 8) 114,532,000 –<br />
Other noncurrent assets (Note 14) 327,847,154 247,748,922<br />
Total Noncurrent Assets 34,797,724,971 29,769,275,998<br />
P=49,936,968,003 P=35,322,975,902<br />
LIABILITIES AND EQUITY<br />
Current Liabilities<br />
Accounts payable <strong>and</strong> other accrued liabilities (Note 15) P=5,598,486,319 P=4,999,811,707<br />
Unearned transportation revenue (Note 3) 4,606,311,016 3,469,155,354<br />
Current portion of long-term debt<br />
(Notes 12 <strong>and</strong> 16) 2,056,043,837 1,862,763,608<br />
Due to related parties (Note 26) 35,529,304 73,716,757<br />
Total Current Liabilities 12,296,370,476 10,405,447,426<br />
Noncurrent Liabilities<br />
Long-term debt - net of current portion<br />
(Notes 12 <strong>and</strong> 16) 16,376,664,867 15,247,363,123<br />
Deferred tax liabilities - net (Note 24) 153,130,071 138,129,877<br />
Other noncurrent liabilities (Notes 17 <strong>and</strong> 22) 3,203,752,687 2,277,073,622<br />
Total Noncurrent Liabilities 19,733,547,625 17,662,566,622<br />
Total Liabilities 32,029,918,101 28,068,014,048<br />
Equity (Note 18)<br />
Common stock 613,236,550 582,574,750<br />
Capital paid in excess of par value 8,405,568,120 4,703,920,250<br />
Net unrealized losses on available-for-sale investment (Note 8) (2,714,902) –<br />
Retained earnings 8,890,960,134 1,968,466,854<br />
Total Equity 17,907,049,902 7,254,961,854<br />
P=49,936,968,003 P=35,322,975,902<br />
See accompanying Notes to Consolidated Financial Statements.<br />
*SGVMC115503*
<strong>CEB</strong>U AIR, INC. AND SUBSIDIARIES<br />
CONSOLIDATED STATEMENTS OF COMPREHENSIVE INCOME<br />
Years Ended December 31<br />
2010 2009 2008<br />
REVENUE<br />
Sale of air transportation services:<br />
Passenger<br />
P=24,656,078,237 P=19,504,340,982 P=17,104,394,200<br />
Cargo 2,095,612,223 1,684,418,350 1,338,530,768<br />
Ancillary revenue (Note 19) 2,337,108,499 2,122,246,979 1,239,219,090<br />
29,088,798,959 23,311,006,311 19,682,144,058<br />
EXPENSES<br />
Flying operations (Note 20) 11,417,488,512 8,857,014,923 9,607,705,976<br />
<strong>Air</strong>craft <strong>and</strong> traffic servicing (Note 20) 2,461,807,197 2,631,833,249 1,946,910,478<br />
Repairs <strong>and</strong> maintenance (Note 20) 2,289,945,384 2,568,940,713 1,846,503,289<br />
Depreciation <strong>and</strong> amortization (Note 12) 2,100,929,764 1,917,683,713 1,546,753,381<br />
<strong>Air</strong>craft <strong>and</strong> engine lease (Note 27) 1,604,855,579 1,723,886,536 1,062,847,730<br />
Reservation <strong>and</strong> sales 1,335,983,655 994,694,826 852,012,389<br />
General <strong>and</strong> administrative (Note 21) 694,888,478 822,510,363 562,833,635<br />
Passenger service 639,480,811 580,896,015 510,724,614<br />
Other expenses (Note 23) 93,293,869 49,503,211 17,992,031<br />
22,638,673,249 20,146,963,549 17,954,283,523<br />
OPERATING INCOME 6,450,125,710 3,164,042,762 1,727,860,535<br />
OTHER INCOME (EXPENSE)<br />
Interest expense (Notes 16 <strong>and</strong> 17) (931,482,279) (1,012,826,822) (838,465,333)<br />
Foreign exchange gains (losses) 576,978,771 418,182,126 (1,507,231,078)<br />
Fuel hedging gains (losses) (Note 8) 474,255,226 685,574,528 (2,594,491,680)<br />
Interest income (Notes 7 <strong>and</strong> 8) 237,495,750 8,848,551 14,231,024<br />
Fair value gains of financial assets designated at fair<br />
value through profit or loss (Note 8) 107,631,255 – –<br />
Equity in net income (loss) of joint venture (Note 13) 25,248,534 (25,474,123) 15,530,008<br />
490,127,257 74,304,260 (4,910,427,059)<br />
INCOME (LOSS) BEFORE INCOME TAX 6,940,252,967 3,238,347,022 (3,182,566,524)<br />
PROVISION FOR (BENEFIT FROM) INCOME<br />
TAX (Note 24) 17,759,687 (19,501,683) 77,321,481<br />
NET INCOME (LOSS) 6,922,493,280 3,257,848,705 (3,259,888,005)<br />
Net unrealized losses on available-for-sale<br />
investment (Note 8) (3,878,432) – –<br />
Benefit from income tax (Notes 8 <strong>and</strong> 24) 1,163,530 – –<br />
OTHER COMPREHENSIVE LOSS, NET OF TAX (2,714,902) – –<br />
TOTAL COMPREHENSIVE INCOME (LOSS) P=6,919,778,378 P=3,257,848,705 (P=3,259,888,005)<br />
Basic/Diluted Earnings (Loss) Per Share<br />
(Note 25) P=11.78 P=5.59 (P=7.11)<br />
See accompanying Notes to Consolidated Financial Statements.<br />
*SGVMC115503*
<strong>CEB</strong>U AIR, INC. AND SUBSIDIARIES<br />
CONSOLIDATED STATEMENTS OF CHANGES IN EQUITY<br />
For the Year Ended December 31, 2010<br />
Net unrealized<br />
losses on<br />
available-for-sale<br />
investment<br />
(Note 8)<br />
Capital Paid in<br />
Excess of Par<br />
Value (Note 18)<br />
Common Stock<br />
(Note 18)<br />
Retained<br />
Earnings<br />
Total<br />
Equity<br />
Balance at January 1, 2010 P=582,574,750 P=4,703,920,250 P=– P=1,968,466,854 P=7,254,961,854<br />
Net income – – – 6,922,493,280 6,922,493,280<br />
Other comprehensive income – – (2,714,902) – (2,714,902)<br />
Total comprehensive income – – (2,714,902) 6,922,493,280 6,919,778,378<br />
Issuance of shares 30,661,800 3,802,063,200 – – 3,832,725,000<br />
Transaction costs – (100,415,330) – – (100,415,330)<br />
Balance at December 31, 2010 P=613,236,550 P=8,405,568,120 (P=2,714,902) P=8,890,960,134 P=17,907,049,902<br />
For the Year Ended December 31, 2009<br />
Common Stock<br />
(Note 18)<br />
Capital Paid in<br />
Excess of Par<br />
Value (Note 18)<br />
Retained<br />
Earnings<br />
(Deficit)<br />
Total<br />
Equity<br />
Balance at January 1, 2009 P=582,574,750 P=4,703,920,250 (P=1,289,381,851) P=3,997,113,149<br />
Net income – – 3,257,848,705 3,257,848,705<br />
Total comprehensive income – – 3,257,848,705 3,257,848,705<br />
Balance at December 31, 2009 P=582,574,750 P=4,703,920,250 P=1,968,466,854 P=7,254,961,854<br />
*SGVMC115503*
- 2 -<br />
For the Year Ended December 31, 2008<br />
Retained Earnings (Deficit) (Note 18)<br />
Common Stock<br />
(Note 18 )<br />
Capital Paid in<br />
Excess of Par<br />
Value (Note 18) Appropriated Unappropriated Total<br />
Total<br />
Equity<br />
Balance at January 1, 2008 P=335,000,000 P=– P=3,000,000,000 P=1,210,506,154 P=4,210,506,154 P=4,545,506,154<br />
Net loss – – – (3,259,888,005) (3,259,888,005) (3,259,888,005)<br />
Total comprehensive income – – – (3,259,888,005) (3,259,888,005) (3,259,888,005)<br />
Appropriation of retained earnings – – 1,000,000,000 (1,000,000,000) – –<br />
Reversal of appropriation – – (4,000,000,000) 4,000,000,000 – –<br />
Issuance of stock dividends 112,000,000 2,128,000,000 – (2,240,000,000) (2,240,000,000) –<br />
Issuance of shares 135,574,750 2,575,920,250 – – – 2,711,495,000<br />
Balance at December 31, 2008 P=582,574,750 P=4,703,920,250 P=– (P=1,289,381,851) (P=1,289,381,851) P=3,997,113,149<br />
See accompanying Notes to Consolidated Financial Statements.<br />
*SGVMC115503*
<strong>CEB</strong>U AIR, INC. AND SUBSIDIARIES<br />
CONSOLIDATED STATEMENTS OF CASH FLOWS<br />
Years Ended December 31<br />
2010 2009 2008<br />
CASH FLOWS FROM OPERATING ACTIVITIES<br />
Income (loss) before income tax P=6,940,252,967 P=3,238,347,022 (P=3,182,566,524)<br />
Adjustments for:<br />
Depreciation <strong>and</strong> amortization (Note 12) 2,100,929,764 1,917,683,713 1,546,753,381<br />
Interest expense (Notes 16 <strong>and</strong> 17) 931,482,279 1,012,826,822 838,465,333<br />
Unrealized foreign exchange losses (gains) (574,806,957) (452,738,225) 1,597,352,394<br />
Fuel hedging losses (gains) (Note 8) (474,255,226) (685,574,528) 2,594,491,680<br />
Interest income (Notes 7 <strong>and</strong> 8) (237,495,750) (8,848,551) (14,231,024)<br />
Fair value gain of financial assets at fair value<br />
through profit or loss (Note 8) (107,631,255) – –<br />
Equity in net loss (income) of joint venture<br />
(Note 13) (25,248,534) 25,474,123 (15,530,008)<br />
Loss on disposal of property <strong>and</strong> equipment 4,050,103 – 276,782<br />
Provision for credit losses on receivables (Note 9) 2,127,309 209,662,427 28,700,892<br />
Operating income before working capital changes 8,559,404,700 5,256,832,803 3,393,712,906<br />
Decrease (increase) in:<br />
Receivables 157,564,532 85,823,980 (331,349,493)<br />
Other current assets 77,065,113 1,842,289,762 (1,796,543,596)<br />
Expendable parts, fuel, materials <strong>and</strong> supplies (21,059,547) (193,665,823) (56,163,453)<br />
Financial assets at fair value through profit or<br />
loss (derivatives) (Note 8) 212,132,124 – 66,220,592<br />
Increase (decrease) in:<br />
Accounts payable <strong>and</strong> other accrued liabilities 561,841,257 1,314,883,706 1,054,096,451<br />
Unearned transportation revenue 1,137,155,662 794,633,434 1,075,187,974<br />
Financial liabilities at fair value through<br />
profit or loss (derivatives) (Note 8) – (1,488,205,370) (701,797,655)<br />
Due to related parties (2,400,212) (60,627) (582,927)<br />
Noncurrent liabilities 50,624,954 (69,993,475) 283,355,255<br />
Net cash generated from operations 10,732,328,583 7,542,538,390 2,986,136,054<br />
Interest paid (803,117,030) (907,448,770) (738,285,460)<br />
Interest received 94,496,407 8,848,551 11,255,366<br />
Net cash provided by operating activities 10,023,707,960 6,643,938,171 2,259,105,960<br />
CASH FLOWS FROM INVESTING ACTIVITIES<br />
Advances to a related party (Notes 26 <strong>and</strong> 28) (3,662,583,961) (1,792,140,000) –<br />
Acquisition of property <strong>and</strong> equipment<br />
(Notes 12 <strong>and</strong> 27) (2,361,432,894) (1,755,652,619) (1,661,765,957)<br />
Proceeds from disposal of property <strong>and</strong><br />
equipment (Note 12) 162,020,516 – –<br />
Acquisition of other noncurrent assets (83,070,335) – –<br />
Dividends received from a joint venture (Note 13) 21,959,482 19,443,595 –<br />
Proceeds from disposal of other noncurrent assets – 142,066,972 12,396,036<br />
Repayments of advances to a related party (Note 26) – 1,792,140,000 –<br />
Additional investment in joint venture (Note 13) – (33,813,500) (270,950,400)<br />
Net cash used in investing activities (5,923,107,192) (1,627,955,552) (1,920,320,321)<br />
(Forward)<br />
*SGVMC115503*
- 2 -<br />
Years Ended December 31<br />
2010 2009 2008<br />
CASH FLOWS FROM FINANCING ACTIVITIES<br />
Issuance of common shares of stock (Note 18) P=3,832,725,000 P=– P=2,711,495,000<br />
Payments of transaction costs (Note 18) (100,415,330) – –<br />
Repayments of long-term debt (1,791,793,102) (1,814,268,254) (1,265,326,921)<br />
Net repayments of borrowings from a related party<br />
(Note 28) (40,480,463) (14,143,844) (1,391,159,688)<br />
Net cash provided by (used in) financing activities 1,900,036,105 (1,828,412,098) 55,008,391<br />
EFFECTS OF EXCHANGE RATE CHANGES IN<br />
CASH AND CASH EQUIVALENTS (78,207,356) 7,239,271 28,603,013<br />
NET INCREASE IN CASH AND<br />
CASH EQUIVALENTS 5,922,429,517 3,194,809,792 422,397,043<br />
CASH AND CASH EQUIVALENTS AT<br />
BEGINNING OF YEAR 3,840,859,455 646,049,663 223,652,620<br />
CASH AND CASH EQUIVALENTS AT<br />
END OF YEAR (Note 7) P=9,763,288,972 P=3,840,859,455 P=646,049,663<br />
See accompanying Notes to Consolidated Financial Statements.<br />
*SGVMC115503*
The percentage contributions to the Company’s revenues of its principal business activities are as<br />
follows:<br />
For the Years Ended December 31<br />
2010 2009 2008<br />
Passenger Services 84.8% 83.7% 86.9%<br />
Cargo Services 7.2% 7.2% 6.8%<br />
Ancillary Services 8.0% 9.1% 6.3%<br />
100.0% 100.0% 100.0%<br />
No material reclassification, merger, consolidation, or purchase or sale of a significant amount of<br />
assets not in the ordinary course of business was made in the past three years. The Company has<br />
not been subjected to any bankruptcy, receivership or similar proceeding in the said period.<br />
Distribution Methods of Products or Services<br />
The Company has three principal distribution channels: the internet, direct sales through booking<br />
sales offices, call centers <strong>and</strong> government/corporate client accounts, <strong>and</strong> third-party sales outlets.<br />
Internet<br />
In January 2006, the Company introduced its internet booking system. Through<br />
www.cebupacificair.com, passengers can book flights <strong>and</strong> purchase services online. The system<br />
also provides passengers with real time access to the Company’s flight schedules <strong>and</strong> fare<br />
options.<br />
Booking Offices <strong>and</strong> Call Centers<br />
As of December 31, 2010, the Company had a network of seven booking offices located<br />
throughout the Philippines <strong>and</strong> one booking office located in Hong Kong. It directly operates<br />
these booking offices, which also h<strong>and</strong>le customer service issues, such as customer requests for<br />
change of itinerary. In addition, the Company operates two in-house call centers, one in Manila<br />
<strong>and</strong> the other in <strong>Cebu</strong>. It also uses a third-party call centre outsourcing service to help<br />
accommodate heavy call traffic. Its employees who work as reservation agents are also trained to<br />
h<strong>and</strong>le customer service inquiries <strong>and</strong> to convert inbound calls into sales. Purchases made through<br />
call centers can be settled through various modes, such as credit cards, over the counter in banks,<br />
automated teller machines <strong>and</strong> payment centers.<br />
Government/Corporate Client Accounts<br />
As of December 31, 2010, the Company had government <strong>and</strong> corporate accounts for passenger<br />
sales. It provides these accounts with direct access to its reservation system <strong>and</strong> seat inventory as<br />
well as credit lines <strong>and</strong> certain incentives. Further, clients may choose to settle their accounts by<br />
post-transaction remittance or by using pre-enrolled credit cards.<br />
2
<strong>CEB</strong>U AIR, INC. AND SUBSIDIARIES<br />
NOTES TO CONSOLIDATED FINANCIAL STATEMENTS<br />
1. Corporate Information<br />
<strong>Cebu</strong> <strong>Air</strong>, Inc. (the Parent Company) was incorporated <strong>and</strong> organized in the Philippines on<br />
August 18, 1988, to carry on, by means of aircraft of every kind <strong>and</strong> description, the general<br />
business of a private carrier or charter engaged in the transportation of passengers, mail,<br />
merch<strong>and</strong>ise <strong>and</strong> freight, <strong>and</strong> to acquire, purchase, lease, construct, own, maintain, operate <strong>and</strong><br />
dispose of airplanes <strong>and</strong> other aircraft of every kind <strong>and</strong> description, <strong>and</strong> also to own, purchase,<br />
construct, lease, operate <strong>and</strong> dispose of hangars, transportation depots, aircraft service stations <strong>and</strong><br />
agencies, <strong>and</strong> other objects <strong>and</strong> service of a similar nature which may be necessary, convenient or<br />
useful as an auxiliary to aircraft transportation. The principal place of business of the Parent<br />
Company is at 2nd Floor, Doña Juanita Marquez Lim Building, Osmeña Boulevard, <strong>Cebu</strong> City.<br />
The Parent Company’s common stock was listed with the Philippine Stock Exchange (PSE) on<br />
October 26, 2010, the Parent Company’s initial public offering (IPO).<br />
The Parent Company’s ultimate parent is JG Summit Holdings, Inc. (JGSHI). The Parent<br />
Company is 65.36%-owned by CP <strong>Air</strong> Holdings, Inc. (CPAHI).<br />
In 1991, pursuant to Republic Act (RA) No. 7151, the Parent Company was granted a franchise to<br />
operate air transportation services, both domestic <strong>and</strong> international. In August 1997, the Office of<br />
the President of the Philippines gave the Parent Company the status of official Philippine carrier to<br />
operate international services. In September 2001, the Philippine Civil Aeronautics Board (CAB)<br />
issued the permit to operate scheduled international services <strong>and</strong> a certificate of authority to<br />
operate international charters.<br />
The Parent Company is registered with the Board of Investments (BOI) as a new operator of air<br />
transport on a non-pioneer status. Under the terms of the registration <strong>and</strong> subject to certain<br />
requirements, the Parent Company is entitled to certain fiscal <strong>and</strong> non-fiscal incentives, including<br />
among others, an income tax holiday (ITH) for a period of four years. The Parent Company can<br />
avail of bonus years in certain specified cases but the aggregate ITH availment (basic <strong>and</strong> bonus<br />
years) shall not exceed eight years (Note 24).<br />
Prior to the grant of the ITH <strong>and</strong> in accordance with the Parent Company’s franchise, which<br />
extends up to year 2031:<br />
a. The Parent Company is subject to franchise tax of five percent of the gross revenue derived<br />
from air transportation operations. For revenue earned from activities other than air<br />
transportation, the Parent Company is subject to regular corporate income tax (RCIT) <strong>and</strong> to<br />
real property tax.<br />
b. In the event that any competing individual, partnership or corporation received <strong>and</strong> enjoyed<br />
tax privileges <strong>and</strong> other favorable terms which tended to place the Parent Company at any<br />
disadvantage, then such privileges shall have been deemed by the fact itself of the Parent<br />
Company’s tax privileges <strong>and</strong> shall operate equally in favor of the Parent Company.<br />
*SGVMC115503*
- 2 -<br />
On May 24, 2005, the Exp<strong>and</strong>ed-Value Added Tax (E-VAT) law was signed as RA No. 9337 or<br />
the E-VAT Act of 2005. The E-VAT law took effect on November 1, 2005 following the approval<br />
on October 19, 2005 of Revenue Regulation (RR) No. 16-2005 which provides for the<br />
implementation of the rules of the E-VAT law. Among the relevant provisions of RA No. 9337<br />
are the following:<br />
a. The franchise tax of the Parent Company is abolished;<br />
b. The Parent Company shall be subject to RCIT;<br />
c. The Parent Company shall remain exempt from any taxes, duties, royalties, registration<br />
license, <strong>and</strong> other fees <strong>and</strong> charges;<br />
d. Change in RCIT rate from 32.00% to 35.00% for the next three years effective on<br />
November 1, 2005, <strong>and</strong> 30.00% starting on January 1, 2009 <strong>and</strong> thereafter;<br />
e. 70.00% cap on the input VAT that can be claimed against output VAT; <strong>and</strong><br />
f. Increase in the VAT rate imposed on goods <strong>and</strong> services from 10.00% to 12.00% effective on<br />
February 1, 2006.<br />
On November 21, 2006, the President signed into law RA No. 9361, which amends Section 110(B)<br />
of the Tax Code. This law, which became effective on December 13, 2006, provides that if the<br />
input tax, inclusive of the input tax carried over from the previous quarter exceeds the output tax,<br />
the excess input tax shall be carried over to the succeeding quarter or quarters. The Department of<br />
Finance through the Bureau of Internal Revenue issued RR No. 2-2007 to implement the<br />
provisions of the said law. Based on the regulation, the amendment shall apply to the quarterly<br />
VAT returns to be filed after the effectivity of RA No. 9361.<br />
On December 16, 2008, the Parent Company was registered as a Clark Freeport Zone (CFZ)<br />
enterprise <strong>and</strong> committed to provide air transportation services both domestic <strong>and</strong> international for<br />
passengers <strong>and</strong> cargoes at the Diosdado Macapagal International <strong>Air</strong>port. The said registration<br />
was valid for one year effective from December 9, 2009 until December 8, 2010, which was still<br />
valid as of December 31, 2010 through temporary operating permit. The registration provides<br />
incentives, rights <strong>and</strong> privileges such as imposition of five percent tax on gross income earned in<br />
lieu of national <strong>and</strong> local taxes.<br />
In accordance with St<strong>and</strong>ing Interpretations Committee (SIC) 12, Consolidation - Special Purpose<br />
Entities, the consolidated financial statements include the accounts of <strong>Cebu</strong> <strong>Air</strong>craft Leasing<br />
Limited (CALL), IBON Leasing Limited (ILL), Boracay Leasing Limited (BLL), Surigao Leasing<br />
Limited (SLL) <strong>and</strong> Sharp <strong>Air</strong>craft Leasing Limited (SALL). CALL, ILL, BLL, SLL <strong>and</strong> SALL<br />
are SPEs in which the Parent Company does not have equity interest. CALL, ILL, BLL, SLL <strong>and</strong><br />
SALL acquired the passenger aircraft for lease to the Parent Company under finance lease<br />
arrangements (Note 12) <strong>and</strong> funded the acquisitions through long-term debt (Note 16).<br />
The accompanying consolidated financial statements of the Parent Company <strong>and</strong> its special<br />
purpose entities (SPEs or subsidiaries) (the Group) were approved <strong>and</strong> authorized for issue by the<br />
board of directors (BOD) on March 17, 2011.<br />
2. Summary of Significant Accounting Policies<br />
Basis of Preparation<br />
The accompanying consolidated financial statements of the Group have been prepared on a<br />
historical cost basis, except for financial assets <strong>and</strong> liabilities at fair value through profit or loss<br />
(FVPL) <strong>and</strong> available-for-sale (AFS) investment that have been measured at fair value.<br />
*SGVMC115503*
- 3 -<br />
The financial statements of the Group are presented in Philippine peso, its functional currency.<br />
All values are rounded to the nearest peso except when otherwise indicated.<br />
Statement of Compliance<br />
The consolidated financial statements of the Group have been prepared in compliance with<br />
Philippine Financial Reporting St<strong>and</strong>ards (PFRS).<br />
Basis of Consolidation<br />
The consolidated financial statements include the financial statements of the Parent Company <strong>and</strong><br />
the SPEs that it controls.<br />
SIC 12, prescribes guidance on the consolidation of SPE. Under SIC 12, an SPE should be<br />
consolidated when the substance of the relationship between the company <strong>and</strong> the SPE indicates<br />
that the SPE is controlled by the company. Control over an entity may exist even in cases where<br />
an enterprise owns little or none of the SPE’s equity, such as when an entity retains majority of the<br />
residual risks related to the SPE or its assets in order to obtain benefits from its activities.<br />
The consolidated financial statements are prepared using uniform accounting policies for like<br />
transactions <strong>and</strong> other events in similar circumstances. All significant intercompany transactions<br />
<strong>and</strong> balances, including intercompany profits <strong>and</strong> unrealized profits <strong>and</strong> losses, are eliminated in<br />
the consolidation.<br />
Changes in Accounting Policies <strong>and</strong> Disclosures<br />
The accounting policies adopted are consistent with those of the previous financial year except for<br />
the following new <strong>and</strong> amended PFRS <strong>and</strong> Philippine Interpretations which were adopted as of<br />
January 1, 2010. The following new <strong>and</strong> amended st<strong>and</strong>ards did not have an impact on the<br />
accounting policies, financial position or performance of the Group.<br />
New St<strong>and</strong>ards <strong>and</strong> Interpretations<br />
• PFRS 2, Share-based Payment: Group Cash-settled Share-based Payment Transactions<br />
• PFRS 3 (Revised), Business Combinations <strong>and</strong> PAS 27 (Amended), Consolidated <strong>and</strong><br />
Separate Financial Statements<br />
• PAS 39, Financial Instruments: Recognition <strong>and</strong> Measurement - Eligible Hedged Items<br />
• Philippine Interpretation on International Financial Reporting Interpretations Committee<br />
(IFRIC) 17, Distributions of Non-cash Assets to Owners<br />
Improvements to PFRSs 2008<br />
• PFRS 5, Non-current Assets Held for Sale <strong>and</strong> Discontinued Operations<br />
Improvements to PFRSs 2009<br />
• PFRS 2, Share-based Payment<br />
• PFRS 5, Non-current Assets Held for Sale <strong>and</strong> Discontinued Operations<br />
• PFRS 8, Operating Segments<br />
• PAS 1, Presentation of Financial Statements<br />
• PAS 7, Statement of Cash Flows<br />
• PAS 17, Leases<br />
• PAS 36, Impairment of Assets<br />
*SGVMC115503*
- 4 -<br />
• PAS 38, Intangible Assets<br />
• PAS 39, Financial Instruments: Recognition <strong>and</strong> Measurement<br />
• Philippine Interpretation IFRIC 9, Reassessment of Embedded Derivatives<br />
• Philippine Interpretation IFRIC 16, Hedge of a Net Investment in a Foreign Operation<br />
Significant Accounting Policies<br />
Revenue Recognition<br />
Revenue is recognized to the extent that it is probable that the economic benefits will flow to the<br />
Group <strong>and</strong> the revenue can be reliably measured. Revenue is measured at the fair value of the<br />
consideration received, excluding discounts, rebates <strong>and</strong> other sales taxes or duty. The following<br />
specific recognition criteria must also be met before revenue is recognized:<br />
Sale of air transportation services<br />
Passenger ticket <strong>and</strong> cargo waybill sales are initially recorded under ‘Unearned transportation<br />
revenue’ account in the consolidated statement of financial position until recognized under<br />
Revenue account in the consolidated statement of comprehensive income when the transportation<br />
service is rendered by the Group (e.g., when passengers <strong>and</strong> cargo are lifted). Unearned tickets<br />
are recognized as revenue using estimates regarding the timing of recognition based on the terms<br />
<strong>and</strong> conditions of the ticket <strong>and</strong> historical trends.<br />
The related commission is recognized as outright expense upon the receipt of payment from<br />
customers, <strong>and</strong> is included under ‘Reservation <strong>and</strong> sales’ account.<br />
Ancillary revenue<br />
Revenue from in-flight sales <strong>and</strong> other services are recognized when the goods are delivered or the<br />
services are carried out.<br />
Interest income<br />
Interest on cash, cash equivalents <strong>and</strong> other short-term cash investments is recognized as the<br />
interest accrues using the effective interest method.<br />
Expense Recognition<br />
Expenses are recognized when it is probable that a decrease in future economic benefits related to<br />
decrease in an asset or an increase in liability has occurred <strong>and</strong> the decrease in economic benefits<br />
can be measured reliably. Expenses that arise in the course of ordinary regular activities of the<br />
Group include, among others, the operating expenses on the Group’s operation.<br />
Cash <strong>and</strong> Cash Equivalents<br />
Cash represents cash on h<strong>and</strong> <strong>and</strong> in banks. Cash equivalents are short-term, highly liquid<br />
investments that are readily convertible to known amounts of cash with original maturities of<br />
three months or less from dates of placement <strong>and</strong> that are subject to an insignificant risk of<br />
changes in value. Cash <strong>and</strong> cash equivalents, excluding cash on h<strong>and</strong>, are classified <strong>and</strong><br />
accounted for as loans <strong>and</strong> receivables.<br />
*SGVMC115503*
- 5 -<br />
Financial Instruments<br />
Date of recognition<br />
Purchases or sales of financial assets that require delivery of assets within the time frame<br />
established by regulation or convention in the marketplace are recognized using the settlement<br />
date accounting. Derivatives are recognized on a trade date basis.<br />
Initial recognition of financial instruments<br />
Financial instruments are recognized initially at the fair value of the consideration given. Except<br />
for financial instruments at FVPL, the initial measurement of financial assets includes transaction<br />
costs. The Group classifies its financial assets into the following categories: financial assets at<br />
FVPL, held-to-maturity (HTM) investments, AFS investments <strong>and</strong> loans <strong>and</strong> receivables.<br />
Financial liabilities are classified into financial liabilities at FVPL <strong>and</strong> other financial liabilities<br />
carried at cost or amortized cost. The Group has no HTM investments as of December 31, 2010<br />
<strong>and</strong> 2009.<br />
The classification depends on the purpose for which the investments were acquired <strong>and</strong> whether<br />
they are quoted in an active market. Management determines the classification of its investments<br />
at initial recognition <strong>and</strong>, where allowed <strong>and</strong> appropriate, re-evaluates such designation at every<br />
statement of financial position date.<br />
Determination of fair value<br />
The fair value of financial instruments traded in active markets at the statement of financial<br />
position date is based on their quoted market price or dealer price quotations (bid price for long<br />
positions <strong>and</strong> ask price for short positions), without any deduction for transaction costs. When<br />
current bid <strong>and</strong> ask prices are not available, the price of the most recent transaction provides<br />
evidence of the current fair value as long as there has not been a significant change in economic<br />
circumstances since the time of the transaction.<br />
For all other financial instruments not listed in an active market, the fair value is determined by<br />
using appropriate valuation techniques. Valuation techniques include net present value<br />
techniques, comparison to similar instruments for which market observable prices exist, options<br />
pricing models <strong>and</strong> other relevant valuation models. Any difference noted between the fair value<br />
<strong>and</strong> the transaction price is treated as expense or income, unless it qualifies for recognition as<br />
some type of asset or liability.<br />
‘Day 1’ profit or loss<br />
Where the transaction price in a non-active market is different from the fair value based on other<br />
observable current market transactions in the same instrument or based on a valuation technique<br />
whose variables include only data from an observable market, the Group recognizes the difference<br />
between the transaction price <strong>and</strong> fair value (a ‘Day 1’ profit or loss) in profit or loss unless it<br />
qualifies for recognition as some other type of asset. In cases where the transaction price used is<br />
made of data which is not observable, the difference between the transaction price <strong>and</strong> model<br />
value is only recognized in profit or loss, when the inputs become observable or when the<br />
instrument is derecognized. For each transaction, the Group determines the appropriate method of<br />
recognizing the ‘Day 1’ profit or loss amount.<br />
*SGVMC115503*
- 6 -<br />
Financial assets <strong>and</strong> financial liabilities at FVPL<br />
Financial assets <strong>and</strong> financial liabilities at FVPL include financial assets <strong>and</strong> financial liabilities<br />
held for trading purposes, derivative instruments or those designated upon initial recognition as at<br />
FVPL. Financial assets <strong>and</strong> financial liabilities are designated by management on initial<br />
recognition when any of the following criteria are met:<br />
• The designation eliminates or significantly reduces the inconsistent treatment that would<br />
otherwise arise from measuring the assets or liabilities or recognizing gains or losses on them<br />
on a different basis; or<br />
• The assets or liabilities are part of a group of financial assets, financial liabilities or both<br />
which are managed <strong>and</strong> their performance are evaluated on a fair value basis, in accordance<br />
with a documented risk management or investment strategy; or<br />
• The financial instrument contains an embedded derivative, unless the embedded derivative<br />
does not significantly modify the cash flows or it is clear, with little or no analysis, that it<br />
would not be separately recorded.<br />
As of December 31, 2010 <strong>and</strong> 2009, the Group’s financial assets at FVPL consist of derivative<br />
assets, as well as private <strong>and</strong> government debt <strong>and</strong> equity securities (Note 8).<br />
Financial assets <strong>and</strong> financial liabilities at FVPL are presented in the consolidated statement of<br />
financial position at fair value. Changes in fair value are reflected in profit or loss. Interest earned<br />
or incurred is recorded in interest income or expense, respectively, while dividend income is<br />
recorded in other revenue according to the terms of the contract, or when the right of the payment<br />
has been established.<br />
Derivatives recorded at FVPL<br />
The Group is a counterparty to certain derivative contracts such as commodity options. Such<br />
derivative financial instruments are initially recorded at fair value on the date at which the<br />
derivative contract is entered into <strong>and</strong> are subsequently re-measured at fair value. Any gains or<br />
losses arising from changes in fair values of derivatives (except those accounted for as accounting<br />
hedges) are taken directly to profit or loss. Derivatives are carried as assets when the fair value is<br />
positive <strong>and</strong> as liabilities when the fair value is negative.<br />
For the purpose of hedge accounting, hedges are classified primarily as either: (a) a hedge of the<br />
fair value of an asset, liability or a firm commitment (fair value hedge); or (b) a hedge of the<br />
exposure to variability in cash flows attributable to an asset or liability or a forecasted transaction<br />
(cash flow hedge). The Group did not apply hedge accounting on its derivative transactions for<br />
the year ended December 31, 2010 <strong>and</strong> 2009.<br />
The Group enters into fuel derivatives to manage its exposure to fuel price fluctuations. Such fuel<br />
derivatives are not designated as accounting hedges. These derivatives are entered into for risk<br />
management purposes. The gains or losses on these instruments are accounted for directly as<br />
charges to or credits against current operations under ‘Fuel hedging gains (losses)’ account in<br />
profit or loss.<br />
As of December 31, 2010 <strong>and</strong> 2009, the Group has no embedded derivatives.<br />
*SGVMC115503*
- 7 -<br />
AFS investments<br />
AFS investments are those non-derivative investments which are designated as such or do not<br />
qualify to be classified or designated as financial assets at FVPL, HTM investments or loans <strong>and</strong><br />
receivables. They are purchased <strong>and</strong> held indefinitely, <strong>and</strong> may be sold in response to liquidity<br />
requirements or changes in market conditions.<br />
After initial measurement, AFS investments are subsequently measured at fair value.<br />
The unrealized gains <strong>and</strong> losses are recognized directly in equity (other comprehensive income<br />
(loss)) under ‘Net unrealized gain (loss) on AFS investments’ account in the statement of financial<br />
position. When the investment is disposed of, the cumulative gain or loss previously recognized<br />
in the statement of comprehensive income is recognized in the statement of income. Where the<br />
Group holds more than one investment in the same security they are deemed to be disposed of on<br />
a first-in first-out basis. Dividends earned while holding AFS investments are recognized in the<br />
statement of income when the right of the payment has been established. The losses arising from<br />
impairment of such investments are recognized in the statement of income <strong>and</strong> removed from the<br />
‘Net unrealized gain (loss) on AFS investments’ account.<br />
The AFS investment of the Group represents a quoted equity security (Note 8).<br />
Receivables<br />
Receivables are non-derivative financial assets with fixed or determinable payments <strong>and</strong> fixed<br />
maturities that are not quoted in an active market. After initial measurement, receivables are<br />
subsequently carried at amortized cost using the effective interest method less any allowance for<br />
impairment loss. Amortized cost is calculated by taking into account any discount or premium on<br />
acquisition, <strong>and</strong> includes fees that are an integral part of the effective interest rate (EIR) <strong>and</strong><br />
transaction costs. Gains <strong>and</strong> losses are recognized in profit or loss, when the receivables are<br />
derecognized or impaired, as well as through the amortization process.<br />
This accounting policy applies primarily to the Group’s trade <strong>and</strong> other receivables (Note 9) <strong>and</strong><br />
certain refundable deposits (Note 14).<br />
Financial liabilities<br />
Issued financial instruments or their components, which are not designated at FVPL are classified<br />
as other financial liabilities where the substance of the contractual arrangement results in the<br />
Group having an obligation either to deliver cash or another financial asset to the holder, or to<br />
satisfy the obligation other than by the exchange of a fixed amount of cash or another financial<br />
asset for a fixed number of own equity shares. The components of issued financial instruments<br />
that contain both liability <strong>and</strong> equity elements are accounted for separately, with the equity<br />
component being assigned the residual amount after deducting from the instrument as a whole the<br />
amount separately determined as the fair value of the liability component on the date of issue.<br />
After initial measurement, other financial liabilities are subsequently measured at cost or<br />
amortized cost using the effective interest method. Amortized cost is calculated by taking into<br />
account any discount or premium on the issue <strong>and</strong> fees that are an integral part of the EIR. Any<br />
effects of restatement of foreign currency-denominated liabilities are recognized in profit or loss.<br />
*SGVMC115503*
- 8 -<br />
This accounting policy applies primarily to the Group’s debt, accounts payable <strong>and</strong> other accrued<br />
liabilities <strong>and</strong> other obligations that meet the above definition (Notes 15, 16 <strong>and</strong> 17).<br />
Impairment of Financial Assets<br />
The Group assesses at each statement of financial position date whether there is objective<br />
evidence that a financial asset or group of financial assets is impaired. A financial asset or a group<br />
of financial assets is deemed to be impaired if, <strong>and</strong> only if, there is objective evidence of<br />
impairment as a result of one or more events that has occurred after the initial recognition of the<br />
asset (an incurred ‘loss event’) <strong>and</strong> that loss event (or events) has an impact on the estimated<br />
future cash flows of the financial asset or the group of financial assets that can be reliably<br />
estimated. Evidence of impairment may include indications that the borrower or a group of<br />
borrowers is experiencing significant financial difficulty, default or delinquency in interest or<br />
principal payments, the probability that they will enter bankruptcy or other financial<br />
reorganization <strong>and</strong> where observable data indicate that there is a measurable decrease in the<br />
estimated future cash flows, such as changes in arrears or economic conditions that correlate with<br />
defaults.<br />
Assets carried at amortized cost<br />
If there is objective evidence that an impairment loss on financial assets carried at amortized cost<br />
(i.e., receivables) has been incurred, the amount of the loss is measured as the difference between<br />
the asset’s carrying amount <strong>and</strong> the present value of estimated future cash flows discounted at the<br />
asset’s original EIR. Time value is generally not considered when the effect of discounting is not<br />
material. The carrying amount of the asset is reduced through the use of an allowance account.<br />
The amount of the loss shall be recognized in profit or loss. The asset, together with the<br />
associated allowance accounts, is written-off when there is no realistic prospect of future recovery.<br />
The Group first assesses whether objective evidence of impairment exists individually for<br />
financial assets that are individually significant, <strong>and</strong> collectively for financial assets that are not<br />
individually significant. If it is determined that no objective evidence of impairment exists for an<br />
individually assessed financial asset, whether significant or not, the asset is included in a group of<br />
financial assets with similar credit risk characteristics <strong>and</strong> that group of financial assets is<br />
collectively assessed for impairment. Assets that are individually assessed for impairment <strong>and</strong> for<br />
which an impairment loss is or continues to be recognized are not included in the collective<br />
assessment of impairment.<br />
If, in a subsequent period, the amount of the impairment loss decreases <strong>and</strong> the decrease can be<br />
related objectively to an event occurring after the impairment was recognized, the previously<br />
recognized impairment loss is reversed. Any subsequent reversal of an impairment loss is<br />
recognized in profit or loss to the extent that the carrying value of the asset does not exceed its<br />
amortized cost at the reversal date.<br />
The Group performs a regular review of the age <strong>and</strong> status of these accounts, designed to identify<br />
accounts with objective evidence of impairment <strong>and</strong> provide the appropriate allowance for<br />
impairment loss. The review is accomplished using a combination of specific <strong>and</strong> collective<br />
assessment approaches, with the impairment loss being determined for each risk grouping<br />
identified by the Group (Note 4).<br />
*SGVMC115503*
- 9 -<br />
AFS investments<br />
The Group assesses at each statement of financial position date whether there is objective<br />
evidence that a financial asset or group of financial assets is impaired. In the case of debt<br />
instruments classified as AFS investments, impairment is assessed based on the same criteria as<br />
financial assets carried at amortized cost. Interest continues to be accrued at the original EIR on<br />
the reduced carrying amount of the asset <strong>and</strong> is recorded under interest income in profit or loss. If,<br />
in a subsequent year, the fair value of a debt instrument increases, <strong>and</strong> the increase can be<br />
objectively related to an event occurring after the impairment loss was recognized in profit or loss,<br />
the impairment loss is also reversed through profit or loss.<br />
For equity investments classified as AFS investments, objective evidence would include a<br />
significant or prolonged decline in the fair value of the investments below its cost. The<br />
determination of what is significant <strong>and</strong> prolonged is subject to judgment. Where there is<br />
evidence of impairment, the cumulative loss measured as the difference between the acquisition<br />
cost <strong>and</strong> the current fair value, less any impairment loss on that investment previously recognized<br />
is removed from other comprehensive income <strong>and</strong> recognized in profit or loss. Impairment losses<br />
on equity investments are not reversed through the statement of comprehensive income. Increases<br />
in fair value after impairment are recognized directly in other comprehensive income.<br />
Derecognition of Financial Instruments<br />
Financial assets<br />
A financial asset (or, where applicable a part of a financial asset or part of a group of financial<br />
assets) is derecognized where:<br />
• the rights to receive cash flows from the asset have expired;<br />
• the Group retains the right to receive cash flows from the asset, but has assumed an obligation<br />
to pay them in full without material delay to a third party under a “pass-through” arrangement;<br />
or<br />
• the Group has transferred its rights to receive cash flows from the asset <strong>and</strong> either (a) has<br />
transferred substantially all the risks <strong>and</strong> rewards of ownership <strong>and</strong> retained control over the<br />
asset, or (b) has neither transferred nor retained the risks <strong>and</strong> rewards of the asset but has<br />
transferred the control over the asset.<br />
When the Group has transferred its rights to receive cash flows from an asset or has entered into a<br />
pass-through arrangement, <strong>and</strong> has neither transferred nor retained substantially all the risks <strong>and</strong><br />
rewards of the asset nor transferred control over the asset, the asset is recognized to the extent of<br />
the Group’s continuing involvement in the asset. Continuing involvement that takes the form of a<br />
guarantee over the transferred asset is measured at the lower of original carrying amount of the<br />
asset <strong>and</strong> the maximum amount of consideration that the Group could be required to repay.<br />
Financial liabilities<br />
A financial liability is derecognized when the obligation under the liability is discharged,<br />
cancelled or has expired. When an existing financial liability is replaced by another from the same<br />
lender on substantially different terms, or the terms of an existing liability are substantially<br />
modified, such an exchange or modification is treated as a derecognition of the original liability<br />
<strong>and</strong> the recognition of a new liability, <strong>and</strong> the difference in the respective carrying amounts is<br />
recognized in profit or loss.<br />
*SGVMC115503*
- 10 -<br />
Offsetting Financial Instruments<br />
Financial assets <strong>and</strong> liabilities are offset <strong>and</strong> the net amount reported in the consolidated statement<br />
of financial position if, <strong>and</strong> only if, there is a currently enforceable legal right to offset the<br />
recognized amounts <strong>and</strong> there is an intention to settle on a net basis, or to realize the asset <strong>and</strong><br />
settle the liability simultaneously. This is not generally the case with master netting agreements;<br />
thus, the related assets <strong>and</strong> liabilities are presented gross in the consolidated statement of financial<br />
position.<br />
Expendable Parts, Fuel, Materials <strong>and</strong> Supplies<br />
Expendable parts, fuel, materials <strong>and</strong> supplies are stated at lower of cost <strong>and</strong> net realizable value<br />
(NRV). Cost of flight equipment expendable parts, materials <strong>and</strong> supplies are stated at acquisition<br />
cost determined on a moving average cost method. Fuel is stated at cost on a weighted average<br />
cost method. NRV is the estimated selling price in the ordinary course of business less estimated<br />
costs to sell.<br />
Property <strong>and</strong> Equipment<br />
Property <strong>and</strong> equipment are carried at cost less accumulated depreciation, amortization <strong>and</strong><br />
impairment loss, if any. The initial cost of property <strong>and</strong> equipment comprises its purchase price,<br />
any related capitalizable borrowing costs attributed to progress payments incurred on account of<br />
aircraft acquisition under construction <strong>and</strong> other directly attributable costs of bringing the asset to<br />
its working condition <strong>and</strong> location for its intended use. Cost also includes asset retirement<br />
obligation (ARO) relating to the leased passenger aircraft.<br />
Subsequent costs are capitalized as part of ‘Property <strong>and</strong> equipment’ account only when it is<br />
probable that future economic benefits associated with the item will flow to the Group <strong>and</strong> the cost<br />
of the item can be measured reliably. Subsequent costs such as actual costs of heavy maintenance<br />
visits for passenger aircraft are capitalized <strong>and</strong> depreciated based on the estimated number of years<br />
or flying hours, whichever is applicable, until the next major overhaul or inspection. Generally,<br />
heavy maintenance visits are required every five to six years for airframe <strong>and</strong> ten years or 20,000<br />
flight cycles, whichever comes first, for l<strong>and</strong>ing gear. All other repairs <strong>and</strong> maintenance are<br />
charged against current operations as incurred.<br />
Construction in-progress are transferred to the related ‘Property <strong>and</strong> equipment’ account when the<br />
construction or installation <strong>and</strong> related activities necessary to prepare the property <strong>and</strong> equipment<br />
for their intended use are completed, <strong>and</strong> the property <strong>and</strong> equipment are ready for service.<br />
Construction in-progress is not depreciated until such time when the relevant assets are completed<br />
<strong>and</strong> available for use.<br />
Depreciation <strong>and</strong> amortization of property <strong>and</strong> equipment commence once the property <strong>and</strong><br />
equipment are available for use <strong>and</strong> are computed using the straight-line method over the<br />
estimated useful lives (EULs) of the assets, regardless of utilization.<br />
*SGVMC115503*
- 11 -<br />
The EULs of property <strong>and</strong> equipment of the Group follows:<br />
Passenger aircraft*<br />
Engines<br />
Rotables<br />
Ground Support Equipment<br />
EDP Equipment, mainframe <strong>and</strong> peripherals<br />
Transportation equipment<br />
Furniture, fixtures <strong>and</strong> office equipment<br />
Communication equipment<br />
Special tools<br />
Maintenance <strong>and</strong> test equipment<br />
Other equipment<br />
* With residual value of 15.00%<br />
15 years<br />
15 years<br />
15 years<br />
5 years<br />
3 years<br />
5 years<br />
5 years<br />
5 years<br />
5 years<br />
5 years<br />
5 years<br />
Leasehold improvements are amortized over the shorter of their EULs or the corresponding lease<br />
terms.<br />
An item of property <strong>and</strong> equipment is derecognized upon disposal or when no future economic<br />
benefits are expected to arise from the continued use of the asset. Any gain or loss arising on<br />
derecognition of the asset (calculated as the difference between the net disposal proceeds <strong>and</strong> the<br />
carrying amount of the item) is included in profit or loss, in the year the item is derecognized.<br />
The assets’ residual values, useful lives <strong>and</strong> methods of depreciation <strong>and</strong> amortization are<br />
reviewed <strong>and</strong> adjusted, if appropriate, at each financial year-end.<br />
ARO<br />
The Group is contractually required under various lease contracts to restore certain leased aircraft<br />
to its original condition <strong>and</strong> to bear the cost of restoration at the end of the contract period. The<br />
Group recognizes the present value of these costs as ARO asset (included under ‘Property <strong>and</strong><br />
equipment’) <strong>and</strong> ARO liability (included under ‘Noncurrent liabilities’). The Group depreciates<br />
ARO asset on a straight-line basis over the EUL of the related asset or the lease term, whichever is<br />
shorter, or written off as a result of impairment of the related asset. The Group amortizes ARO<br />
liability using the effective interest method <strong>and</strong> recognizes accretion expense (included in interest<br />
expense) over the lease term.<br />
The Group regularly assesses the provision for ARO <strong>and</strong> adjusts the related asset <strong>and</strong> liability<br />
(Note 3).<br />
<strong>Air</strong>craft Maintenance <strong>and</strong> Overhaul Cost<br />
The Group recognizes aircraft maintenance <strong>and</strong> overhaul expenses in accordance with the<br />
contractual terms.<br />
The maintenance contracts are classified into two: (a) those based on time <strong>and</strong> material basis<br />
(TMB), <strong>and</strong> (b) power-by-the-hour (PBH) contract. For maintenance contract under TMB, the<br />
Group recognizes expenses based on expense as incurred method. For maintenance contract under<br />
PBH, the Group recognizes expense on an accrual basis.<br />
*SGVMC115503*
- 12 -<br />
Investment in Joint Ventures<br />
A joint venture (JV) is a contractual arrangement whereby two or more parties undertake an<br />
economic activity that is subject to joint control. A jointly controlled entity is a JV that involves<br />
the establishment of a separate entity in which each venturer has an interest.<br />
The Group’s 49.00% <strong>and</strong> 35.00% investments in Aviation Partnership (Philippines) Corporation<br />
(A-plus) <strong>and</strong> SIA Engineering (Philippines) Corporation (SIAEP) are accounted for under the<br />
equity method (Note 13). Under the equity method, the investments in JV are carried in the<br />
consolidated statement of financial position at cost plus post-acquisition changes in the Group’s<br />
share of net assets of the JV, less any allowance for impairment in value. The consolidated<br />
statement of comprehensive income reflects the Group’s share in the results of operations of the<br />
JV.<br />
Impairment of Nonfinancial Assets<br />
This accounting policy applies primarily to the Group’s property <strong>and</strong> equipment <strong>and</strong> investments<br />
in JV.<br />
At each statement of financial position date, the Group assesses whether there is any indication<br />
that its nonfinancial assets may be impaired. When an indicator of impairment exists or when an<br />
annual impairment testing for an asset is required, the Group makes a formal estimate of<br />
recoverable amount. Recoverable amount is the higher of an asset’s (or cash-generating unit’s)<br />
fair value less costs to sell <strong>and</strong> its value in use <strong>and</strong> is determined for an individual asset, unless the<br />
asset does not generate cash inflows that are largely independent of those from other assets or<br />
groups of assets, in which case the recoverable amount is assessed as part of the cash generating<br />
unit to which it belongs. Where the carrying amount of an asset (or cash-generating unit) exceeds<br />
its recoverable amount, the asset (or cash-generating unit) is considered impaired <strong>and</strong> is written<br />
down to its recoverable amount. In assessing value in use, the estimated future cash flows are<br />
discounted to their present value using a pre-tax discount rate that reflects current market<br />
assessments of the time value of money <strong>and</strong> the risks specific to the asset (or cash-generating<br />
unit).<br />
An assessment is made at each statement of financial position date as to whether there is any<br />
indication that a previously recognized impairment loss may no longer exist or may have<br />
decreased. If such indication exists, the recoverable amount is estimated. A previously<br />
recognized impairment loss is reversed only if there has been a change in the estimates used to<br />
determine the asset’s recoverable amount since the last impairment loss was recognized. If that is<br />
the case, the carrying amount of the asset is increased to its recoverable amount. That increased<br />
amount cannot exceed the carrying amount that would have been determined, net of depreciation,<br />
had no impairment loss been recognized for the asset in prior years. Such reversal is recognized in<br />
profit or loss. After such a reversal, the depreciation expense is adjusted in future years to allocate<br />
the asset’s revised carrying amount, less any residual value, on a systematic basis over its<br />
remaining life.<br />
Common Stock<br />
Common stocks are classified as equity <strong>and</strong> recorded at par. Proceeds in excess of par value are<br />
recorded as ‘Capital paid in excess of par value’ in the consolidated statement of financial<br />
position. Incremental costs directly attributable to the issue of new shares or options are shown in<br />
equity as a deduction from the proceeds.<br />
*SGVMC115503*
- 13 -<br />
Dividends on Common Shares<br />
Dividends on common shares are recognized as a liability <strong>and</strong> deducted from equity when<br />
approved <strong>and</strong> declared by the BOD, in the case of cash dividends; or by the BOD <strong>and</strong><br />
shareholders, in the case of stock dividends.<br />
Provisions <strong>and</strong> Contingencies<br />
Provisions are recognized when: (a) the Group has a present obligation (legal or constructive) as a<br />
result of a past event; (b) it is probable (i.e., more likely than not) that an outflow of assets<br />
embodying economic benefits will be required to settle the obligation; <strong>and</strong> (c) a reliable estimate<br />
can be made of the amount of the obligation. Provisions are reviewed at each reporting date <strong>and</strong><br />
adjusted to reflect the current best estimate. Where the Group expects a provision to be<br />
reimbursed, for example under an insurance contract, the reimbursement is recognized as a<br />
separate asset but only when the reimbursement is virtually certain. If the effect of the time value<br />
of money is material, provisions are determined by discounting the expected future cash flows at a<br />
pre-tax rate that reflects current market assessments of the time value of money <strong>and</strong>, where<br />
appropriate, the risks specific to the liability. Where discounting is used, the increase in the<br />
provision due to the passage of time is recognized as an interest expense in profit or loss.<br />
Contingent liabilities are not recognized in the consolidated statement of financial position but are<br />
disclosed unless the possibility of an outflow of resources embodying economic benefits is<br />
remote. Contingent assets are not recognized but disclosed in the consolidated financial<br />
statements when an inflow of economic benefits is probable. If it is virtually certain that an inflow<br />
of economic benefits will arise, the asset <strong>and</strong> the related income are recognized in the consolidated<br />
financial statements.<br />
Pension Costs<br />
Pension cost is actuarially determined using the projected unit credit method. This method reflects<br />
services rendered by employees up to the date of valuation <strong>and</strong> incorporates assumptions<br />
concerning employees’ projected salaries. Actuarial valuations are conducted with sufficient<br />
regularity, with option to accelerate when significant changes to underlying assumptions occur.<br />
Pension cost includes current service cost, interest cost, expected return on any plan assets,<br />
actuarial gains <strong>and</strong> losses <strong>and</strong> the effect of any curtailment or settlement.<br />
Actuarial gains <strong>and</strong> losses arising from experience adjustments <strong>and</strong> changes in actuarial<br />
assumptions are credited to or charged against profit or loss when the net cumulative unrecognized<br />
actuarial gains <strong>and</strong> losses at the end of the previous period exceed 10.00% of the higher of the<br />
present value of the defined benefit obligation <strong>and</strong> the fair value of plan assets at that date. The<br />
excess actuarial gains or losses are recognized over the average remaining working lives of the<br />
employees participating in the plan.<br />
The asset or liability recognized in the consolidated statement of financial position in respect of<br />
defined benefit retirement plan is the present value of the defined benefit obligation as of<br />
statement of financial position date less the fair value of plan assets, together with adjustments for<br />
unrecognized actuarial gains or losses <strong>and</strong> past service costs. The value of any asset is restricted<br />
to the sum of any past service cost not yet recognized <strong>and</strong> the present value of any economic<br />
benefits available in the form of refunds from the plan or reductions in the future contributions to<br />
the plan. The defined benefit obligation is calculated annually by an independent actuary. The<br />
present value of the defined benefit obligation is determined by discounting the estimated future<br />
cash inflows using risk-free interest rates that have terms to maturity approximating the terms of<br />
the related pension liability.<br />
*SGVMC115503*
- 14 -<br />
Income Taxes<br />
Current tax<br />
Current tax assets <strong>and</strong> liabilities for the current <strong>and</strong> prior periods are measured at the amount<br />
expected to be recovered from or paid to the taxation authorities. The tax rates <strong>and</strong> tax laws used<br />
to compute the amount are those that are enacted or substantially enacted as of the statement of<br />
financial position date.<br />
Deferred tax<br />
Deferred tax is provided using the balance sheet liability method on all temporary differences,<br />
with certain exceptions, at the reporting date between the tax bases of assets <strong>and</strong> liabilities <strong>and</strong><br />
their carrying amounts for financial reporting purposes.<br />
Deferred tax liabilities are recognized for all taxable temporary differences, with certain<br />
exceptions. Deferred tax assets are recognized for all deductible temporary differences with<br />
certain exceptions, <strong>and</strong> carryforward benefits of unused tax credits from excess minimum<br />
corporate income tax (MCIT) over RCIT <strong>and</strong> unused net operating loss carryover (NOLCO), to<br />
the extent that it is probable that sufficient taxable profit will be available against which the<br />
deductible temporary differences <strong>and</strong> carryforward benefits of unused tax credits from excess<br />
MCIT <strong>and</strong> unused NOLCO can be utilized. Deferred tax assets, however, are not recognized<br />
when it arises from the initial recognition of an asset or liability in a transaction that is not a<br />
business combination <strong>and</strong>, at the time of transaction, affects neither the accounting income nor<br />
taxable profit or loss. Deferred tax liabilities are not provided on non-taxable temporary<br />
differences associated with interests in JV. With respect to interests in JV, deferred tax liabilities<br />
are recognized except where the timing of the reversal of the temporary difference can be<br />
controlled <strong>and</strong> it is probable that the temporary difference will not reverse in the foreseeable<br />
future.<br />
The carrying amounts of deferred tax assets are reviewed at each statement of financial position<br />
date <strong>and</strong> reduced to the extent that it is no longer probable that sufficient taxable income will be<br />
available to allow all or part of the deferred tax assets to be utilized. Unrecognized deferred tax<br />
assets are reassessed at each reporting date, <strong>and</strong> are recognized to the extent that it has become<br />
probable that future taxable income will allow the deferred tax assets to be recovered.<br />
Deferred tax assets <strong>and</strong> liabilities are measured at the tax rates that are applicable to the period<br />
when the asset is realized or the liability is settled, based on tax rates (<strong>and</strong> tax laws) that have been<br />
enacted or substantively enacted as of the statement of financial position date.<br />
Deferred tax relating to items recognized outside profit or loss is recognized outside profit or loss.<br />
Deferred tax items are recognized in correlation to the underlying transaction either in profit or<br />
loss or other comprehensive income.<br />
Deferred tax assets <strong>and</strong> deferred tax liabilities are offset if a legally enforceable right exists to set<br />
off current tax assets against current tax liabilities <strong>and</strong> the deferred taxes relate to the same taxable<br />
entity <strong>and</strong> the same taxation authority.<br />
*SGVMC115503*
- 15 -<br />
Leases<br />
The determination of whether an arrangement is, or contains a lease, is based on the substance of<br />
the arrangement at inception date, <strong>and</strong> requires an assessment of whether the fulfillment of the<br />
arrangement is dependent on the use of a specific asset or assets <strong>and</strong> the arrangement conveys a<br />
right to use the asset. A reassessment is made after inception of the lease only if one of the<br />
following applies:<br />
a. there is a change in contractual terms, other than a renewal or extension of the arrangement;<br />
b. a renewal option is exercised or an extension granted, unless that term of the renewal or<br />
extension was initially included in the lease term;<br />
c. there is a change in the determination of whether fulfillment is dependent on a specified asset;<br />
or<br />
d. there is a substantial change to the asset.<br />
Where a reassessment is made, lease accounting shall commence or cease from the date when the<br />
change in circumstances gave rise to the reassessment for (a), (c) <strong>and</strong> (d) scenarios above, <strong>and</strong> at<br />
the date of renewal or extension period for scenario (b).<br />
Group as lessee<br />
Finance leases, which transfer to the Group substantially all the risks <strong>and</strong> benefits incidental to<br />
ownership of the leased item, are capitalized at the inception of the lease at the fair value of the<br />
leased property or, if lower, at the present value of the minimum lease payments <strong>and</strong> included<br />
under ‘Property <strong>and</strong> equipment’ account with the corresponding liability to the lessor included<br />
under ‘Long-term debt’ account in the consolidated statement of financial position. Lease<br />
payments are apportioned between the finance charges <strong>and</strong> reduction of the lease liability so as to<br />
achieve a constant rate of interest on the remaining balance of the liability. Finance charges are<br />
charged directly to profit or loss.<br />
Leased assets are depreciated over the useful life of the asset. However, if there is no reasonable<br />
certainty that the Group will obtain ownership by the end of the lease term, the asset is depreciated<br />
over the shorter of the EUL of the asset <strong>and</strong> the lease term.<br />
Leases where the lessor retains substantially all the risks <strong>and</strong> benefits of ownership of the asset are<br />
classified as operating leases. Operating lease payments are recognized as an expense in profit or<br />
loss on a straight-line basis over the lease term.<br />
Group as lessor<br />
Leases where the Group does not transfer substantially all the risks <strong>and</strong> benefits of ownership of<br />
the assets are classified as operating leases. Initial direct costs incurred in negotiating operating<br />
leases are added to the carrying amount of the leased asset <strong>and</strong> recognized over the lease term on<br />
the same basis as the rental income. Contingent rents are recognized as revenue in the period in<br />
which they are earned.<br />
Borrowing Costs<br />
Borrowing costs are generally expensed as incurred. Borrowing costs are capitalized if they are<br />
directly attributable to the acquisition or construction of a qualifying asset. Capitalization of<br />
borrowing costs commences when the activities to prepare the asset are in progress, <strong>and</strong><br />
expenditures <strong>and</strong> borrowing costs are being incurred. Borrowing costs are capitalized until the<br />
assets are substantially ready for their intended use.<br />
*SGVMC115503*
- 16 -<br />
The Group had not capitalized any borrowing costs for the years ended December 31, 2010 <strong>and</strong><br />
2009 as all borrowing costs from outst<strong>and</strong>ing long-term debt relate to assets that are at state ready<br />
for intended use (Note 16).<br />
Foreign Currency Transactions<br />
Transactions in foreign currencies are initially recorded in the Group’s functional currency using<br />
the exchange rates prevailing at the dates of the transaction. Monetary assets <strong>and</strong> liabilities<br />
denominated in foreign currencies are translated at the functional currency using the Philippine<br />
Dealing System (PDS) closing rate prevailing at the statement of financial position date. All<br />
differences are taken to the consolidated statement of comprehensive income. Non-monetary<br />
items that are measured in terms of historical cost in a foreign currency are translated using the<br />
prevailing closing exchange rate as of the date of initial transaction.<br />
Earnings (Loss) Per Share (EPS)<br />
Basic EPS is computed by dividing net income applicable to common stock by the weighted<br />
average number of common shares issued <strong>and</strong> outst<strong>and</strong>ing during the year, adjusted for any<br />
subsequent stock dividends declared.<br />
Diluted EPS amounts are calculated by dividing the net profit attributable to ordinary equity<br />
holders of the Group by the weighted average number of ordinary shares outst<strong>and</strong>ing during the<br />
year plus the weighted average number of ordinary shares that would be issued on the conversion<br />
of all the dilutive potential ordinary shares into ordinary shares.<br />
For the years ended December 31, 2010, 2009 <strong>and</strong> 2008, the Group does not have any dilutive<br />
potential ordinary shares.<br />
Segment Reporting<br />
Operating segments are reported in a manner consistent with the internal reporting provided to the<br />
Chief Operating Decision Maker (CODM). The CODM, who is responsible for resource<br />
allocation <strong>and</strong> assessing performance of the operating segment, has been identified as the<br />
President. The nature of the operating segment is set out in Note 6.<br />
Events after the Reporting Period<br />
Post-year-end events that provide additional information about the Group’s position at the<br />
statement of financial position date (adjusting event) are reflected in the consolidated financial<br />
statements. Post-year-end events that are not adjusting events are disclosed in the notes to the<br />
consolidated financial statements, when material.<br />
St<strong>and</strong>ards Issued but not yet Effective<br />
St<strong>and</strong>ards issued but not yet effective up to the date of issuance of the Group’s financial<br />
statements are listed below. This listing is of st<strong>and</strong>ards <strong>and</strong> interpretations issued, which the<br />
Group reasonably expects to be applicable at a future date. The Group intends to adopt those<br />
st<strong>and</strong>ards when they become effective.<br />
• PAS 24 (Amended), Related Party Disclosures<br />
The amended st<strong>and</strong>ard is effective for annual periods beginning on or after January 1, 2011. It<br />
clarifies the definition of a related party to simplify the identification of such relationships <strong>and</strong><br />
to eliminate inconsistencies in its application. The revised st<strong>and</strong>ard introduces a partial<br />
exemption of disclosure requirements for government-related entities. The Group does not<br />
expect any impact on its financial position or performance. Early adoption is permitted for<br />
either the partial exemption for government-related entities or for the entire st<strong>and</strong>ard.<br />
*SGVMC115503*
- 17 -<br />
• PAS 32 (Amended), Financial Instruments: Presentation - Classification of Rights Issues<br />
The amendment to PAS 32 is effective for annual periods beginning on or after<br />
February 1, 2010 <strong>and</strong> amends the definition of a financial liability in order to classify rights<br />
issues (<strong>and</strong> certain options or warrants) as equity instruments in cases where such rights are<br />
given pro rata to all of the existing owners of the same class of an entity’s non-derivative<br />
equity instruments, or to acquire a fixed number of the entity’s own equity instruments for a<br />
fixed amount in any currency. This amendment will have no impact on the Group after initial<br />
application.<br />
• PAS 12 (Amended), Income Taxes - Deferred Tax: Recovery of Underlying Assets<br />
The amendment to PAS 12 is effective for annual periods beginning on or after<br />
January 1, 2012. It provides a practical solution to the problem of assessing whether recovery<br />
of an asset will be through use or sale. It introduces a presumption that recovery of the<br />
carrying amount of an asset will normally be through sale.<br />
• PFRS 7 (Amended), Financial Instruments - Disclosures: Transfers of Financial Assets<br />
The amendments to PFRS 7 are effective for annual periods beginning on or after<br />
July 1, 2011. The amendments will allow users of financial statements to improve their<br />
underst<strong>and</strong>ing of transfer transactions of financial assets (for example, securitizations),<br />
including underst<strong>and</strong>ing the possible effects of any risks that may remain with the entity that<br />
transferred the assets. The amendments also require additional disclosures if a<br />
disproportionate amount of transfer transactions are undertaken around the end of a reporting<br />
period.<br />
• PFRS 9, Financial Instruments: Classification <strong>and</strong> Measurement<br />
PFRS 9, as issued in 2010, reflects the first phase of the work on the replacement of PAS 39<br />
<strong>and</strong> applies to classification <strong>and</strong> measurement of financial assets <strong>and</strong> financial liabilities as<br />
defined in PAS 39. The st<strong>and</strong>ard is effective for annual periods beginning on or after<br />
January 1, 2013. In subsequent phases, hedge accounting <strong>and</strong> derecognition will be addressed.<br />
The completion of this project is expected in early 2011. The adoption of the first phase of<br />
PFRS 9 will have an effect on the classification <strong>and</strong> measurement of the Group’s financial<br />
assets. The Group will quantify the effect in conjunction with the other phases, when issued,<br />
to present a comprehensive picture.<br />
• Philippine Interpretation IFRIC-14 (Amended), Prepayments of a Minimum Funding<br />
Requirement<br />
The amendment to Philippine Interpretation IFRIC-14 is effective for annual periods<br />
beginning on or after January 1, 2011, with retrospective application. The amendment<br />
provides guidance on assessing the recoverable amount of a net pension asset. The amendment<br />
permits an entity to treat the prepayment of a minimum funding requirement as an asset. The<br />
amendment is deemed to have no impact on the financial statements of the Group.<br />
*SGVMC115503*
- 18 -<br />
• Philippine Interpretation IFRIC-15, Agreements for the Construction of Real Estate<br />
This Interpretation, effective for annual periods beginning on or after January 1, 2012, covers<br />
accounting for revenue <strong>and</strong> associated expenses by entities that undertake the construction of<br />
real estate directly or through subcontractors. The Interpretation requires that revenue on<br />
construction of real estate be recognized only upon completion, except when such contract<br />
qualifies as a construction contract to be accounted for under PAS 11, Construction Contracts,<br />
or involves rendering of services in which case revenue is recognized based on stage of<br />
completion. Contracts involving provision of services with the construction materials <strong>and</strong><br />
where the risks <strong>and</strong> rewards of ownership are transferred to the buyer on a continuous basis<br />
will also be accounted for based on stage of completion.<br />
• Philippine Interpretation IFRIC-19, Extinguishing Financial Liabilities with Equity<br />
Instruments<br />
This Interpretation is effective for annual periods beginning on or after July 1, 2010. The<br />
interpretation clarifies that equity instruments issued to a creditor to extinguish a financial<br />
liability qualify as consideration paid. The equity instruments issued are measured at their fair<br />
value. In case that this cannot be reliably measured, the instruments are measured at the fair<br />
value of the liability extinguished. Any gain or loss is recognized immediately in profit or<br />
loss. The adoption of this interpretation will have no effect on the financial statements of the<br />
Group.<br />
Improvements to PFRSs 2010<br />
Improvements to IFRSs is an omnibus of amendments to PFRSs. The amendments have not been<br />
adopted as they become effective for annual periods on or after either July 1, 2010. The<br />
amendments are listed below:<br />
• PFRS 3, Business Combinations<br />
• PFRS 7, Financial Instruments: Disclosures<br />
• PAS 1, Presentation of Financial Statements<br />
• PAS 27, Consolidated <strong>and</strong> Separate Financial Statements<br />
• Philippine Interpretation IFRIC-13, Customer Loyalty Programmes<br />
The Group, however, expects no impact from the adoption of the amendments on its financial<br />
position or performance.<br />
3. Significant Accounting Judgments <strong>and</strong> Estimates<br />
In the process of applying the Group’s accounting policies, management has exercised judgments<br />
<strong>and</strong> estimates in determining the amounts recognized in the consolidated financial statements.<br />
The most significant uses of judgment <strong>and</strong> estimates follow.<br />
Judgments<br />
a. Going concern<br />
The management of the Group has made an assessment of the Group’s ability to continue as a<br />
going concern <strong>and</strong> is satisfied that the Group has the resources to continue in business for the<br />
foreseeable future. Furthermore, the Group is not aware of any material uncertainties that may<br />
cast significant doubts upon the Group’s ability to continue as a going concern. Therefore, the<br />
consolidated financial statements continue to be prepared on a going concern basis.<br />
*SGVMC115503*
- 19 -<br />
b. Classification of financial instruments<br />
The Group exercises judgment in classifying a financial instrument, or its component, on<br />
initial recognition as either a financial asset, a financial liability or an equity instrument in<br />
accordance with the substance of the contractual arrangement <strong>and</strong> the definitions of a financial<br />
asset, financial liability or equity instrument. The substance of a financial instrument, rather<br />
than its legal form, governs its classification in the consolidated statement of financial<br />
position.<br />
In addition, the Group classifies financial assets by evaluating, among others, whether the<br />
asset is quoted or not in an active market. Included in the evaluation on whether a financial<br />
asset is quoted in an active market is the determination of whether quoted prices are readily<br />
<strong>and</strong> regularly available, <strong>and</strong> whether those prices represent actual <strong>and</strong> regularly occurring<br />
market transactions on an arm’s length basis.<br />
c. Fair values of financial instruments<br />
Where the fair values of certain financial assets <strong>and</strong> liabilities recorded in the consolidated<br />
statement of financial position cannot be derived from active markets, they are determined<br />
using valuation techniques, including the discounted cash flow model. The inputs to these<br />
models are taken from observable market data where possible, but where this is not feasible,<br />
estimates are used in establishing fair values. The judgments include considerations of<br />
liquidity risk, credit risk <strong>and</strong> volatility. Changes in assumptions about these factors could<br />
affect the reported fair value of financial instruments. For derivatives, the Group generally<br />
relies on counterparties’ valuation.<br />
The fair values of the Group’s financial instruments are presented in Note 5.<br />
d. Impairment of financial assets<br />
In determining whether an impairment loss should be recorded in profit or loss, the Group<br />
makes judgments as to whether there is any objective evidence of impairment as a result of<br />
one or more events that has occurred after initial recognition of the asset <strong>and</strong> that loss event or<br />
events has an impact on the estimated future cash flows of the financial assets or the group of<br />
financial assets that can be reliably estimated. This observable data may include adverse<br />
changes in payment status of borrowings in a group, or national or local economic conditions<br />
that correlate with defaults on assets in the portfolio.<br />
e. Classification of leases<br />
Management exercises judgment in determining whether substantially all the significant risks<br />
<strong>and</strong> rewards of ownership of the leased assets are transferred to the Group. Lease contracts,<br />
which transfer to the Group substantially all the risks <strong>and</strong> rewards incidental to ownership of<br />
the leased items, are capitalized. Otherwise, they are considered as operating leases.<br />
The Group also has lease agreements where it has determined that the risks <strong>and</strong> rewards<br />
related to the leased assets are retained with the lessors. Such leases are accounted for as<br />
operating leases (Note 27).<br />
*SGVMC115503*
- 20 -<br />
f. Consolidation of SPEs<br />
The Group periodically undertakes transactions that may involve obtaining the right to control<br />
or significantly influence the operations of other companies. These transactions include the<br />
purchase of aircraft <strong>and</strong> assumption of certain liabilities. Also, included are transactions<br />
involving SPEs <strong>and</strong> similar vehicles. In all such cases, management makes an assessment as<br />
to whether the Group has the right to control or significantly influence the SPEs, <strong>and</strong> based on<br />
this assessment, the SPE is consolidated as a subsidiary or associated company. In making<br />
this assessment, management considers the underlying economic substance of the transaction<br />
<strong>and</strong> not only the contractual terms.<br />
g. Determination of functional currency<br />
PAS 21 requires management to use its judgment to determine the entity’s functional currency<br />
such that it most faithfully represents the economic effects of the underlying transactions,<br />
events <strong>and</strong> conditions that are relevant to the entity. In making this judgment, each entity in<br />
the Group considers the following:<br />
a) the currency that mainly influences sales prices for financial instruments <strong>and</strong> services (this<br />
will often be the currency in which sales prices for its financial instruments <strong>and</strong> services<br />
are denominated <strong>and</strong> settled);<br />
b) the currency in which funds from financing activities are generated; <strong>and</strong><br />
c) the currency in which receipts from operating activities are usually retained.<br />
The Group’s consolidated financial statements are presented in Philippine peso, which is also<br />
the Parent Company’s functional currency.<br />
h. Contingencies<br />
The Group is currently involved in certain legal proceedings. The estimate of the probable<br />
costs for the resolution of these claims has been developed in consultation with outside<br />
counsel h<strong>and</strong>ling the defense in these matters <strong>and</strong> is based upon an analysis of potential<br />
results. The Group currently does not believe that these proceedings will have a material<br />
adverse effect on the Group’s financial position <strong>and</strong> results of operations. It is possible,<br />
however, that future results of operations could be materially affected by changes in the<br />
estimates or in the effectiveness of the strategies relating to these proceedings (Note 27).<br />
Estimates<br />
The key assumptions concerning the future <strong>and</strong> other sources of estimation uncertainty at the<br />
statement of financial position date that have significant risk of causing a material adjustment to<br />
the carrying amounts of assets <strong>and</strong> liabilities within the next year are discussed below:<br />
a. Estimation of allowance for credit losses on receivables<br />
The Group maintains allowance for impairment losses at a level considered adequate to<br />
provide for potential uncollectible receivables. The level of this allowance is evaluated by<br />
management on the basis of factors that affect the collectibility of the accounts. These factors<br />
include, but are not limited to, the length of the Group’s relationship with the agents,<br />
customers <strong>and</strong> other counterparties, the payment behavior of agents <strong>and</strong> customers, other<br />
counterparties <strong>and</strong> other known market factors. The Group reviews the age <strong>and</strong> status of<br />
receivables, <strong>and</strong> identifies accounts that are to be provided with allowances on a continuous<br />
basis.<br />
The provisions for credit losses on receivables are discussed in more detail in Note 9.<br />
*SGVMC115503*
- 21 -<br />
b. Determination of NRV of expendable parts, fuel, materials <strong>and</strong> supplies<br />
The Group’s estimates of the NRV of expendable parts, fuel, materials <strong>and</strong> supplies are based<br />
on the most reliable evidence available at the time the estimates are made, of the amount that<br />
the expendable parts, fuel, materials <strong>and</strong> supplies are expected to be realized. In determining<br />
the NRV, the Group considers any adjustment necessary for obsolescence, which is generally<br />
providing 100.00% for nonmoving items for more than one year. A new assessment is made<br />
of NRV in each subsequent period. When the circumstances that previously caused<br />
expendable parts, fuel, materials <strong>and</strong> supplies to be written-down below cost no longer exist or<br />
when there is a clear evidence of an increase in NRV because of a change in economic<br />
circumstances, the amount of the write-down is reversed so that the new carrying amount is<br />
the lower of the cost <strong>and</strong> the revised NRV.<br />
The details of expendable parts, fuel, materials <strong>and</strong> supplies are disclosed in Note 10.<br />
c. Estimation of ARO<br />
The Group is contractually required under certain lease contracts to restore certain leased<br />
passenger aircraft to stipulated return condition <strong>and</strong> to bear the costs of restoration at the end<br />
of the contract period. Since the first operating lease entered by the Group in 2001, these<br />
costs are accrued based on an internal estimate which includes estimates of certain redelivery<br />
costs at the end of the operating aircraft lease. The Group recognizes the present value of<br />
these costs as ARO asset <strong>and</strong> ARO liability.<br />
Assumptions used to compute ARO are reviewed <strong>and</strong> updated annually by the Group.<br />
In 2010, the Group contracted a third-party engineer to reassess the amount of future<br />
restoration costs. Based on the reassessment, the Group recognized additional ARO asset <strong>and</strong><br />
ARO liability amounting to P=705.7 million (Note 17). As of December 31, 2010 <strong>and</strong> 2009,<br />
the present value of the cost of restoration is computed based on the Group’s average<br />
borrowing cost.<br />
The amount <strong>and</strong> timing of recorded expenses for any period would differ if different<br />
judgments were made or different estimates were utilized. The recognition of ARO would<br />
increase noncurrent assets <strong>and</strong> noncurrent liabilities, which results in increase of depreciation<br />
expense <strong>and</strong> interest expense.<br />
The details <strong>and</strong> the carrying value of ARO asset <strong>and</strong> liability are disclosed in Notes 12 <strong>and</strong> 17,<br />
respectively.<br />
d. Estimation of useful lives <strong>and</strong> residual values of property <strong>and</strong> equipment<br />
The Group estimates the useful lives of its property <strong>and</strong> equipment based on the period over<br />
which the assets are expected to be available for use. The Group estimates the residual value<br />
of its property <strong>and</strong> equipment based on the expected amount recoverable at the end of its<br />
useful life. The Group reviews annually the EULs <strong>and</strong> residual values of property <strong>and</strong><br />
equipment based on factors that include physical wear <strong>and</strong> tear, technical <strong>and</strong> commercial<br />
obsolescence <strong>and</strong> other limits on the use of the assets. It is possible that future results of<br />
operations could be materially affected by changes in these estimates brought about by<br />
changes in the factors mentioned. A reduction in the EUL or residual value of property <strong>and</strong><br />
equipment would increase recorded depreciation <strong>and</strong> amortization expense <strong>and</strong> decrease<br />
noncurrent assets.<br />
The details <strong>and</strong> the carrying value of property <strong>and</strong> equipment are disclosed in Note 12.<br />
*SGVMC115503*
- 22 -<br />
e. Recognition of deferred tax assets<br />
The Group assesses the carrying amounts of deferred income taxes at each statement of<br />
financial position date <strong>and</strong> reduces deferred tax assets to the extent that it is no longer<br />
probable that sufficient taxable profit will be available to allow all or part of the deferred tax<br />
assets to be utilized. Significant management judgment is required to determine the amount of<br />
deferred tax assets that can be recognized, based upon the likely timing <strong>and</strong> level of future<br />
taxable profits together with future tax planning strategies.<br />
As of December 31, 2010 <strong>and</strong> 2009, the Group had certain gross deductible <strong>and</strong> taxable<br />
temporary differences which are expected to expire or reverse within the ITH period, <strong>and</strong> for<br />
which deferred tax assets <strong>and</strong> deferred tax liabilities were not set up on account of the Parent<br />
Company’s ITH.<br />
The details of deferred tax asset are disclosed in Note 24.<br />
f. Impairment of nonfinancial assets<br />
The Group assesses the impairment of nonfinancial assets, particularly property <strong>and</strong><br />
equipment <strong>and</strong> investment in JV, whenever events or changes in circumstances indicate that<br />
the carrying amount of the nonfinancial asset may not be recoverable. The factors that the<br />
Group considers important which could trigger an impairment review include the following:<br />
• significant underperformance relative to expected historical or projected future operating<br />
results;<br />
• significant changes in the manner of use of the acquired assets or the strategy for overall<br />
business; <strong>and</strong><br />
• significant negative industry or economic trends.<br />
An impairment loss is recognized whenever the carrying amount of an asset or investment<br />
exceeds its recoverable amount. The recoverable amount is the higher of an asset’s fair value<br />
less cost to sell <strong>and</strong> value in use. The fair value less cost to sell is the amount obtainable from<br />
the sale of an asset in an arm’s length transaction while value in use is the present value of<br />
estimated future cash flows expected to arise from the continuing use of an asset <strong>and</strong> from its<br />
disposal at the end of its useful life.<br />
Recoverable amounts are estimated for individual assets or investments or, if it is not possible,<br />
for the cash-generating unit to which the asset belongs.<br />
In determining the present value of estimated future cash flows expected to be generated from<br />
the continued use of the assets, the Group is required to make estimates <strong>and</strong> assumptions that<br />
can materially affect the consolidated financial statements.<br />
The carrying values of property <strong>and</strong> equipment <strong>and</strong> investment in JV are disclosed in Notes 12<br />
<strong>and</strong> 13, respectively.<br />
*SGVMC115503*
- 23 -<br />
g. Estimation of pension <strong>and</strong> other employee benefit costs<br />
The determination of the obligation <strong>and</strong> cost of pension <strong>and</strong> other employee benefits is<br />
dependent on the selection of certain assumptions used in calculating such amounts. Those<br />
assumptions include, among others, discount rates <strong>and</strong> salary increase rates (Note 22). Actual<br />
results that differ from the Group’s assumptions are accumulated <strong>and</strong> amortized over future<br />
periods <strong>and</strong> therefore, generally affect the recognized expense <strong>and</strong> recorded obligation in such<br />
future periods.<br />
While the Group believes that the assumptions are reasonable <strong>and</strong> appropriate, significant<br />
differences between actual experiences <strong>and</strong> assumptions may materially affect the cost of<br />
employee benefits <strong>and</strong> related obligations.<br />
The Group also estimates other employee benefit obligations <strong>and</strong> expense, including the cost<br />
of paid leaves based on historical leave availments of employees, subject to the Group’s<br />
policy. These estimates may vary depending on the future changes in salaries <strong>and</strong> actual<br />
experiences during the year.<br />
The present value of the defined benefit obligation <strong>and</strong> other details of the retirement plan <strong>and</strong><br />
other employee benefit cost are disclosed in Note 22.<br />
h. Passenger revenue recognition<br />
Passenger sales are recognized as revenue when the obligation of the Group to provide<br />
transportation service ceases, either (a) when transportation services are already rendered or<br />
(b) when the Group estimates that unused tickets are already expired. The value of unused<br />
tickets is included as unearned transportation revenue in the consolidated statement of<br />
financial position <strong>and</strong> recognized as revenue based on estimates. These estimates are based on<br />
historical experience. While actual results may vary from these estimates, the Group believes<br />
it is unlikely that materially different estimates for future refunds, exchanges, <strong>and</strong> forfeited<br />
tickets would be reported based on other reasonable assumptions or conditions suggested by<br />
actual historical experience <strong>and</strong> other data available at the time the estimates were made.<br />
As of December 31, 2010 <strong>and</strong> 2009, the balances of the Group’s unearned transportation<br />
revenue amounted to P=4.6 billion <strong>and</strong> P=3.5 billion, respectively. Ticket sales that are not<br />
expected to be used for transportation are recognized as revenue using estimates regarding the<br />
timing of recognition based on the terms <strong>and</strong> conditions of the tickets <strong>and</strong> historical trends.<br />
4. Financial Risk Management Objectives <strong>and</strong> Policies<br />
The Group’s principal financial instruments, other than derivatives, comprise cash <strong>and</strong> cash<br />
equivalents, financial assets at FVPL, AFS investments, receivables, payables <strong>and</strong> interest-bearing<br />
borrowings. The main purpose of these financial instruments is to finance the Group’s operations<br />
<strong>and</strong> capital expenditures. The Group has various other financial assets <strong>and</strong> liabilities, such as trade<br />
receivables <strong>and</strong> trade payables which arise directly from its operations. The Group also enters into<br />
fuel derivatives to manage its exposure to fuel price fluctuations.<br />
The Group’s BOD reviews <strong>and</strong> approves policies for managing each of these risks <strong>and</strong> they are<br />
summarized in the succeeding paragraphs, together with the related risk management structure.<br />
*SGVMC115503*
- 24 -<br />
Risk Management Structure<br />
The Group’s risk management structure is closely aligned with that of its ultimate parent. The<br />
Group has its own BOD which is ultimately responsible for the oversight of the Group’s risk<br />
management process which involves identifying, measuring, analyzing, monitoring <strong>and</strong><br />
controlling risks.<br />
The risk management framework encompasses environmental scanning, the identification <strong>and</strong><br />
assessment of business risks, development of risk management strategies, design <strong>and</strong><br />
implementation of risk management capabilities <strong>and</strong> appropriate responses, monitoring risks <strong>and</strong><br />
risk management performance, <strong>and</strong> identification of areas <strong>and</strong> opportunities for improvement in<br />
the risk management process.<br />
The Group <strong>and</strong> the ultimate parent with its other subsidiaries (JGSHI Group) created the following<br />
separate board-level independent committees with explicit authority <strong>and</strong> responsibility for<br />
managing <strong>and</strong> monitoring risks.<br />
Each BOD has created the board-level Audit Committee to spearhead the managing <strong>and</strong><br />
monitoring of risks.<br />
Audit Committee<br />
The Group’s Audit Committee assists the Group’s BOD in its fiduciary responsibility for the overall<br />
effectiveness of risk management systems, <strong>and</strong> both the internal <strong>and</strong> external audit functions of<br />
the Group. Furthermore, it is also the Audit Committee’s purpose to lead in the general evaluation<br />
<strong>and</strong> to provide assistance in the continuous improvements of risk management, control <strong>and</strong><br />
governance processes.<br />
The Audit Committee also aims to ensure that:<br />
a. financial reports comply with established internal policies <strong>and</strong> procedures, pertinent<br />
accounting <strong>and</strong> auditing st<strong>and</strong>ards <strong>and</strong> other regulatory requirements;<br />
b. risks are properly identified, evaluated <strong>and</strong> managed, specifically in the areas of managing<br />
credit, market, liquidity, operational, legal <strong>and</strong> other risks, <strong>and</strong> crisis management:<br />
c. audit activities of internal <strong>and</strong> external auditors are done based on plan, <strong>and</strong> deviations are<br />
explained through the performance of direct interface functions with the internal <strong>and</strong> external<br />
auditors; <strong>and</strong><br />
d. the Group’s BOD is properly assisted in the development of policies that would enhance the<br />
risk management <strong>and</strong> control systems.<br />
Enterprise Risk Management Group (ERMG)<br />
The fulfillment of the risk management functions of the Group’s BOD is delegated to the ERMG.<br />
The ERMG is primarily responsible for the execution of the Enterprise Risk Management (ERM)<br />
framework. The ERMG’s main concerns include:<br />
• formulation of risk policies, strategies, principles, framework <strong>and</strong> limits;<br />
• management of the fundamental risk issues <strong>and</strong> monitoring of relevant risk decisions;<br />
• support to management in implementing the risk policies <strong>and</strong> strategies; <strong>and</strong><br />
• development of a risk awareness program.<br />
*SGVMC115503*
- 25 -<br />
Corporate Governance Compliance Officer<br />
Compliance with the principles of good corporate governance is one of the objectives of the<br />
Group’s BOD. To assist the Group’s BOD in achieving this purpose, the Group’s BOD has<br />
designated a Compliance Officer who shall be responsible for monitoring the actual compliance of<br />
the Group with the provisions <strong>and</strong> requirements of good corporate governance, identifying <strong>and</strong><br />
monitoring control compliance risks, determining violations, <strong>and</strong> recommending penalties for such<br />
infringements for further review <strong>and</strong> approval of the Group’s BOD, among others.<br />
Day-to-day Risk Management Functions<br />
At the business unit or company level, the day-to-day risk management functions are h<strong>and</strong>led by<br />
four different groups, namely:<br />
1. Risk-taking personnel - this group includes line personnel who initiate <strong>and</strong> are directly<br />
accountable for all risks taken.<br />
2. Risk control <strong>and</strong> compliance - this group includes middle management personnel who perform<br />
the day-to-day compliance check to approved risk policies <strong>and</strong> risks mitigation decisions.<br />
3. Support - this group includes back office personnel who support the line personnel.<br />
4. Risk management - this group pertains to the Group’s Management Committee which makes<br />
risk mitigating decisions within the enterprise-wide risk management framework.<br />
ERM Framework<br />
The Group’s BOD is also responsible for establishing <strong>and</strong> maintaining a sound risk management<br />
framework <strong>and</strong> is accountable for risks taken by the Group. The Group’s BOD also shares the<br />
responsibility with the ERMG in promoting the risk awareness program enterprise-wide.<br />
The ERM framework revolves around the following eight interrelated risk management<br />
approaches:<br />
1. Internal Environmental Scanning - it involves the review of the overall prevailing risk profile<br />
of the business unit to determine how risks are viewed <strong>and</strong> addressed by management. This is<br />
presented during the strategic planning, annual budgeting <strong>and</strong> mid-year performance reviews<br />
of the business unit.<br />
2. Objective Setting - the Group’s BOD m<strong>and</strong>ates the Group’s management to set the overall<br />
annual targets through strategic planning activities, in order to ensure that management has a<br />
process in place to set objectives which are aligned with the Group’s goals.<br />
3. Risk Assessment - the identified risks are analyzed relative to the probability <strong>and</strong> severity of<br />
potential loss which serves as a basis for determining how the risks should be managed. The<br />
risks are further assessed as to which risks are controllable <strong>and</strong> uncontrollable, risks that<br />
require management’s attention, <strong>and</strong> risks which may materially weaken the Group’s earnings<br />
<strong>and</strong> capital.<br />
4. Risk Response - the Group’s BOD, through the oversight role of the ERMG, approves the<br />
Group’s responses to mitigate risks, either to avoid, self-insure, reduce, transfer or share risk.<br />
5. Control Activities - policies <strong>and</strong> procedures are established <strong>and</strong> approved by the Group’s BOD<br />
<strong>and</strong> implemented to ensure that the risk responses are effectively carried out enterprise-wide.<br />
*SGVMC115503*
- 26 -<br />
6. Information <strong>and</strong> Communication - relevant risk management information are identified,<br />
captured <strong>and</strong> communicated in form <strong>and</strong> substance that enable all personnel to perform their<br />
risk management roles.<br />
7. Monitoring - the ERMG, Internal Audit Group, Compliance Office <strong>and</strong> Business Assessment<br />
Team constantly monitor the management of risks through risk limits, audit reviews,<br />
compliance checks, revalidation of risk strategies <strong>and</strong> performance reviews.<br />
Risk Management Support Groups<br />
The Group’s BOD created the following departments within the Group to support the risk<br />
management activities of the Group <strong>and</strong> the other business units:<br />
1. Corporate Security <strong>and</strong> Safety Board (CSSB) - under the supervision of ERMG, the CSSB<br />
administers enterprise-wide policies affecting physical security of assets exposed to various<br />
forms of risks.<br />
2. Corporate Supplier Accreditation Team (CORPSAT) - under the supervision of ERMG, the<br />
CORPSAT administers enterprise-wide procurement policies to ensure availability of supplies<br />
<strong>and</strong> services of high quality <strong>and</strong> st<strong>and</strong>ards to all business units.<br />
3. Corporate Management Services (CMS) - the CMS is responsible for the formulation of<br />
enterprise-wide policies <strong>and</strong> procedures.<br />
4. Corporate Planning <strong>and</strong> Legal Affairs (CORPLAN) - the CORPLAN is responsible for the<br />
administration of strategic planning, budgeting <strong>and</strong> performance review processes of the<br />
business units.<br />
5. Corporate Insurance Department (CID) - the CID is responsible for the administration of the<br />
insurance program of business units concerning property, public liability, business<br />
interruption, money <strong>and</strong> fidelity, <strong>and</strong> employer compensation insurances, as well as in the<br />
procurement of performance bonds.<br />
Risk Management Policies<br />
The main risks arising from the use of financial instruments are credit risk, liquidity risk <strong>and</strong><br />
market risk, namely foreign currency risk, commodity price risk <strong>and</strong> interest rate risk. The<br />
Group’s policies for managing the aforementioned risks are summarized below.<br />
Credit Risk<br />
Credit risk is defined as the risk of loss due to uncertainty in a third party’s ability to meet its<br />
obligation to the Group. The Group trades only with recognized, creditworthy third parties. It is<br />
the Group’s policy that all customers who wish to trade on credit terms are being subjected to<br />
credit verification procedures. In addition, receivable balances are monitored on a continuous<br />
basis resulting in an insignificant exposure in bad debts.<br />
With respect to credit risk arising from the other financial assets of the Group, which comprise<br />
cash in bank <strong>and</strong> cash equivalents <strong>and</strong> certain derivative instruments, the Group’s exposure to<br />
credit risk arises from default of the counterparty with a maximum exposure equal to the carrying<br />
amount of these instruments.<br />
*SGVMC115503*
- 27 -<br />
Maximum exposure to credit risk without taking account of any credit enhancement<br />
The table below shows the gross maximum exposure to credit risk (including derivative assets) of<br />
the Group as of December 31, 2010 <strong>and</strong> 2009, without considering the effects of collaterals <strong>and</strong><br />
other credit risk mitigation techniques.<br />
2010 2009<br />
Financial assets at FVPL (Note 8)<br />
Designated at FVPL<br />
Quoted debt securities<br />
Private P=2,086,089,903 P=–<br />
Government 1,017,480,478 –<br />
3,103,570,381 –<br />
Quoted equity securities 285,950,784 –<br />
3,389,521,165 –<br />
Derivative financial instruments<br />
not designated as accounting hedges 489,917,466 227,794,364<br />
3,879,438,631 227,794,364<br />
AFS investments (Note 8)<br />
Quoted equity securities 114,532,000 –<br />
Loans <strong>and</strong> receivables<br />
Cash <strong>and</strong> cash equivalents* (Note 7) 9,748,864,734 3,826,551,232<br />
Receivables (Note 9)<br />
Trade receivables 465,134,940 564,785,691<br />
Interest receivable 134,819,376 –<br />
Due from related parties 86,576,474 40,389,601<br />
Others** 175,878,801 189,759,389<br />
862,409,591 794,934,681<br />
Refundable deposits*** (Note 14) 9,240,000 9,240,000<br />
P=14,614,484,956 P=4,858,520,277<br />
*Excluding cash on h<strong>and</strong><br />
**Include nontrade receivables from derivative counterparties <strong>and</strong> employees<br />
***Included under ‘Other noncurrent assets’ account in the consolidated statements of financial position.<br />
Risk concentrations of the maximum exposure to credit risk<br />
Concentrations arise when a number of counterparties are engaged in similar business activities, or<br />
activities in the same geographic region or have similar economic features that would cause their<br />
ability to meet contractual obligations to be similarly affected by changes in economic, political or<br />
other conditions. Concentrations indicate the relative sensitivity of the Group’s performance to<br />
developments affecting a particular industry or geographical location. Such credit risk<br />
concentrations, if not properly managed, may cause significant losses that could threaten the<br />
Group's financial strength <strong>and</strong> undermine public confidence. In order to avoid excessive<br />
concentrations of risk, identified concentrations of credit risks are controlled <strong>and</strong> managed<br />
accordingly.<br />
*SGVMC115503*
- 28 -<br />
The Group’s credit risk exposures, before taking into account any collateral held or other credit<br />
enhancements, are categorized by geographic location as follows:<br />
2010<br />
Philippines<br />
Asia<br />
(excluding<br />
Philippines) Europe Others Total<br />
Financial assets at FVPL (Note 8)<br />
Designated at FVPL<br />
Quoted debt securities<br />
Private P=159,862,560 P=17,853,621 P=1,525,694,362 P=382,679,360 P=2,086,089,903<br />
Government 948,259,200 69,221,278 – – 1,017,480,478<br />
1,108,121,760 87,074,899 1,525,694,362 382,679,360 3,103,570,381<br />
Quoted equity securities – – – 285,950,784 285,950,784<br />
1,108,121,760 87,074,899 1,525,694,362 668,630,144 3,389,521,165<br />
Derivative financial instruments<br />
not designated as accounting hedges 136,094,034 206,652,904 147,170,528 – 489,917,466<br />
1,244,215,794 293,727,803 1,672,864,890 668,630,144 3,879,438,631<br />
AFS investments (Note 8)<br />
Quoted equity securities – – – 114,532,000 114,532,000<br />
Loans <strong>and</strong> receivables<br />
Cash <strong>and</strong> cash equivalents* (Note 7) 9,461,735,841 287,128,893 – – 9,748,864,734<br />
Receivables (Note 9)<br />
Trade receivables 349,540,164 84,845,412 30,749,364 – 465,134,940<br />
Interest receivable 71,058,584 4,248,439 6,633,159 52,879,194 134,819,376<br />
Due from related parties 86,576,474 – – – 86,576,474<br />
Others** 77,620,296 59,537,007 38,721,498 – 175,878,801<br />
584,795,518 148,630,858 76,104,021 52,879,194 862,409,591<br />
Refundable deposits*** (Note 14) – – 9,240,000 – 9,240,000<br />
P=11,290,747,153 P=729,487,554 P=1,758,208,911 P=836,041,338 P=14,614,484,956<br />
*Excluding cash on h<strong>and</strong><br />
**Include nontrade receivables from derivative counterparties <strong>and</strong> employees<br />
***Included under ‘Other noncurrent assets’ account in the consolidated statement of financial position.<br />
2009<br />
Philippines<br />
Asia<br />
(excluding<br />
Philippines) Europe Total<br />
Financial assets at FVPL (Note 8)<br />
Derivative financial instruments<br />
not designated as accounting hedges P=– P=227,794,364 P=– P=227,794,364<br />
Loans <strong>and</strong> receivables<br />
Cash <strong>and</strong> cash equivalents* (Note 7) 3,603,491,343 223,059,889 – 3,826,551,232<br />
Receivables (Note 9)<br />
Trade receivables 403,862,479 143,956,471 16,966,741 564,785,691<br />
Due from related parties 40,389,601 – – 40,389,601<br />
Others** 21,433,462 642,642 167,683,285 189,759,389<br />
465,685,542 144,599,113 184,650,026 794,934,681<br />
Refundable deposits*** (Note 14) – – 9,240,000 9,240,000<br />
P=4,069,176,885 P=595,453,366 P=193,890,026 P=4,858,520,277<br />
* Excluding cash on h<strong>and</strong><br />
**Include nontrade receivables from derivative counterparties <strong>and</strong> employees.<br />
*** Included under ‘Other noncurrent assets’ account in the consolidated statement of financial position.<br />
The Group has no concentration of risk with regard to various industry sectors. The major<br />
industry relevant to the Group is the transportation sector <strong>and</strong> financial intermediaries.<br />
Credit quality per class of financial assets<br />
The Group rates its financial assets based on an internal <strong>and</strong> external credit rating system.<br />
*SGVMC115503*
- 29 -<br />
The table below shows the credit quality by class of financial assets based on internal credit rating<br />
of the Group (gross of allowance for impairment losses) as of December 31, 2010 <strong>and</strong> 2009.<br />
2010<br />
Neither Past Due Nor Specifically Impaired<br />
Past Due<br />
High<br />
Grade<br />
St<strong>and</strong>ard<br />
Grade<br />
Subst<strong>and</strong>ard<br />
Grade<br />
or Individually<br />
Impaired<br />
Total<br />
Financial assets at FVPL (Note 8)<br />
Derivative financial<br />
instruments not designated as<br />
accounting hedges P=489,917,466 P=– P=– P=– P=489,917,466<br />
Loans <strong>and</strong> receivables:<br />
Cash <strong>and</strong> cash equivalents*<br />
(Note 7) 9,748,864,734 – – – 9,748,864,734<br />
Receivables (Note 9)<br />
Trade receivables 296,387,293 96,158,122 – 78,920,400 471,465,815<br />
Interest receivable 134,819,376 – – – 134,819,376<br />
Due from related parties 86,576,474 – – – 86,576,474<br />
Others** 45,199,323 83,708,347 – 273,224,396 402,132,066<br />
Refundable deposits*** (Note 14) 9,240,000 – – – 9,240,000<br />
P=10,811,004,666 P=179,866,469 P=– P=352,144,796 P=11,343,015,931<br />
*Excluding cash on h<strong>and</strong><br />
**Include nontrade receivables from derivative counterparties <strong>and</strong> employees<br />
***Included under ‘Other noncurrent assets’ account in the consolidated statement of financial position.<br />
2009<br />
Neither Past Due Nor Specifically Impaired<br />
Past Due<br />
High<br />
Grade<br />
St<strong>and</strong>ard<br />
Grade<br />
Subst<strong>and</strong>ard<br />
Grade<br />
or Individually<br />
Impaired<br />
Total<br />
Financial assets at FVPL (Note 8)<br />
Derivative financial<br />
instruments not designated as<br />
accounting hedges P=227,794,364 P=– P=– P=– P=227,794,364<br />
Loans <strong>and</strong> receivables:<br />
Cash <strong>and</strong> cash equivalents*<br />
(Note 7) 3,826,551,232 – – – 3,826,551,232<br />
Receivables (Note 9)<br />
Trade receivables 481,749,690 – – 89,366,876 571,116,566<br />
Due from related parties 40,389,601 – – – 40,389,601<br />
Others** 186,328,128 – – 242,617,195 428,945,323<br />
Refundable deposits***(Note 14) 9,240,000 – – – 9,240,000<br />
P=4,772,053,015 P=– P=– P=331,984,071 P=5,104,037,086<br />
*Excluding cash on h<strong>and</strong><br />
**Include nontrade receivables from derivative counterparties <strong>and</strong> employees<br />
***Included under ‘Other noncurrent assets’ account in the consolidated statement of financial position.<br />
High grade cash <strong>and</strong> cash equivalents are short-term placements <strong>and</strong> working cash fund placed,<br />
invested, or deposited in foreign <strong>and</strong> local banks belonging to the top ten banks in terms of<br />
resources <strong>and</strong> profitability.<br />
High grade accounts are accounts considered to be of high value. The counterparties have a very<br />
remote likelihood of default <strong>and</strong> have consistently exhibited good paying habits.<br />
St<strong>and</strong>ard grade accounts are active accounts with propensity of deteriorating to mid-range age<br />
buckets. These accounts are typically not impaired as the counterparties generally respond to<br />
credit actions <strong>and</strong> update their payments accordingly.<br />
Subst<strong>and</strong>ard grade accounts are accounts which have probability of impairment based on historical<br />
trend. These accounts show propensity to default in payment despite regular follow-up actions<br />
<strong>and</strong> extended payment terms.<br />
*SGVMC115503*
- 30 -<br />
Past due or individually impaired accounts consist of past due but not impaired receivables<br />
amounting to P=119.6 million <strong>and</strong> P=86.5 million as December 31, 2010 <strong>and</strong> 2009, respectively, <strong>and</strong><br />
past due <strong>and</strong> impaired receivables amounting to P=232.6 million <strong>and</strong> P=245.5 million as of<br />
December 31, 2010 <strong>and</strong> 2009, respectively. Past due but not impaired receivables are secured by<br />
cash bonds from major sales <strong>and</strong> ticket offices recorded under ‘Accounts payable <strong>and</strong> other<br />
accrued liabilities’ account in the consolidated statement of financial position. For the past due<br />
<strong>and</strong> impaired receivables, specific allowance for impairment losses amounted to P=232.6 million<br />
<strong>and</strong> P=245.5 million as of December 31, 2010 <strong>and</strong> 2009, respectively (Note 9).<br />
For financial assets such as designated financial assets at FVPL <strong>and</strong> AFS investments, the Group<br />
assesses their credit quality using external credit ratings from St<strong>and</strong>ard & Poor’s (S&P). Financial<br />
assets with at least A- are identified as high grade, at least B- as st<strong>and</strong>ard grade <strong>and</strong> not rated (NR)<br />
if the credit rating is not performed by an external credit rating agency.<br />
Below is a summary of the Group’s external credit rating classification:<br />
2010<br />
Neither Past Due Nor Specifically Impaired<br />
Past Due<br />
High<br />
Grade<br />
St<strong>and</strong>ard<br />
Grade Not Rated<br />
or Individually<br />
Impaired<br />
Total<br />
Financial assets at FVPL (Note 8)<br />
Designated at FVPL<br />
Quoted debt securities<br />
Private<br />
BBB+ P=– P=47,785,600 P=– P=– P=47,785,600<br />
BB+ – 160,021,480 – – 160,021,480<br />
BB – 81,662,412 – – 81,662,412<br />
B+ – 234,719,360 – – 234,719,360<br />
B- – 159,862,560 – – 159,862,560<br />
NR – – 1,402,038,491 – 1,402,038,491<br />
– 684,051,412 1,402,038,491 – 2,086,089,903<br />
Government<br />
BB – 1,017,480,478 – – 1,017,480,478<br />
– 1,701,531,890 1,402,038,491 – 3,103,570,381<br />
Quoted equity securities<br />
A- 285,950,784 – – – 285,950,784<br />
285,950,784 1,701,531,890 1,402,038,491 – 3,389,521,165<br />
AFS investments (Note 8)<br />
Quoted equity securities<br />
BBB- – 114,532,000 – – 114,532,000<br />
P=285,950,784 P=1,816,063,890 P=1,402,038,491 P=– P=3,504,053,165<br />
The following tables show the aging analysis of the Group’s receivables:<br />
2010<br />
Neither Past Past Due But Not Impaired Past<br />
Due Nor<br />
Impaired 31-60 days 61-90 days 91-180 days<br />
Over<br />
180 days<br />
Due <strong>and</strong><br />
Impaired Total<br />
Trade receivables P=392,545,415 P=29,123,386 P=24,822,321 P=12,190,557 P=6,453,261 P=6,330,875 471,465,815<br />
Interest receivable 134,819,376 – – – – – 134,819,376<br />
Due from related parties 86,576,474 – – – – – 86,576,474<br />
Others* 128,907,670 – 739,356 38,400,282 7,831,493 226,253,265 402,132,066<br />
P=742,848,935 P=29,123,386 P=25,561,677 P=50,590,839 P=14,284,754 P=232,584,140 P=1,094,993,731<br />
*Include nontrade receivables from derivative counterparties <strong>and</strong> employees<br />
2009<br />
Neither Past Past Due But Not Impaired Past<br />
Due Nor<br />
Impaired 31-60 days 61-90 days 91-180 days<br />
Over<br />
180 days<br />
Due <strong>and</strong><br />
Impaired<br />
Total<br />
Trade receivables P=481,749,690 P=45,462,279 P=13,771,807 P=17,361,412 P=6,440,503 P=6,330,875 P=571,116,566<br />
Due from related parties 40,389,601 – – – – – 40,389,601<br />
Others* 186,328,128 3,431,261 – – – 239,185,934 428,945,323<br />
P=708,467,419 P=48,893,540 P=13,771,807 P=17,361,412 P=6,440,503 P=245,516,809 P=1,040,451,490<br />
*Include nontrade receivables from derivative counterparties <strong>and</strong> employees<br />
*SGVMC115503*
- 31 -<br />
Collateral or credit enhancements<br />
As collateral against trade receivables from sales ticket offices or agents, the Group requires cash<br />
bonds from major sales ticket offices or agents ranging from P=50,000 to P=2.1 million depending<br />
on the Group’s assessment of sales ticket offices <strong>and</strong> agents’ credit st<strong>and</strong>ing <strong>and</strong> volume of<br />
transactions. As of December 31, 2010 <strong>and</strong> 2009, outst<strong>and</strong>ing cash bonds (included under<br />
‘Accounts payable <strong>and</strong> other accrued liabilities’ account in the consolidated statement of financial<br />
position) amounted to P=136.9 million <strong>and</strong> P=101.0 million, respectively (Note 15). There are no<br />
collaterals for impaired receivables.<br />
Impairment assessment<br />
The Group recognizes impairment losses based on the results of its specific/individual <strong>and</strong><br />
collective assessment of its credit exposures. Impairment has taken place when there is a presence<br />
of known difficulties in the servicing of cash flows by counterparties, infringement of the original<br />
terms of the contract has happened, or when there is an inability to pay principal overdue beyond a<br />
certain threshold. These <strong>and</strong> the other factors, either singly or in t<strong>and</strong>em, constitute observable<br />
events <strong>and</strong>/or data that meet the definition of an objective evidence of impairment.<br />
The two methodologies applied by the Group in assessing <strong>and</strong> measuring impairment include:<br />
(1) specific/individual assessment; <strong>and</strong> (2) collective assessment.<br />
Under specific/individual assessment, the Group assesses each individually significant credit<br />
exposure for any objective evidence of impairment, <strong>and</strong> where such evidence exists, accordingly<br />
calculates the required impairment. Among the items <strong>and</strong> factors considered by the Group when<br />
assessing <strong>and</strong> measuring specific impairment allowances are: (a) the timing of the expected cash<br />
flows; (b) the projected receipts or expected cash flows; (c) the going concern of the<br />
counterparty’s business; (d) the ability of the counterparty to repay its obligations during financial<br />
crises; (e) the availability of other sources of financial support; <strong>and</strong> (f) the existing realizable value<br />
of collateral. The impairment allowances, if any, are evaluated as the need arises, in view of<br />
favorable or unfavorable developments.<br />
With regard to the collective assessment of impairment, allowances are assessed collectively for<br />
losses on receivables that are not individually significant <strong>and</strong> for individually significant<br />
receivables when there is no apparent nor objective evidence of individual impairment yet.<br />
A particular portfolio is reviewed on a periodic basis in order to determine its corresponding<br />
appropriate allowances. The collective assessment evaluates <strong>and</strong> estimates the impairment of the<br />
portfolio in its entirety even though there is no objective evidence of impairment yet on an<br />
individual assessment. Impairment losses are estimated by taking into consideration the following<br />
deterministic information: (a) historical losses/write-offs; (b) losses which are likely to occur but<br />
have not yet occurred; <strong>and</strong> (c) the expected receipts <strong>and</strong> recoveries once impaired.<br />
Liquidity Risk<br />
Liquidity is generally defined as the current <strong>and</strong> prospective risk to earnings or capital arising<br />
from the Group’s inability to meet its obligations when they become due without recurring<br />
unacceptable losses or costs.<br />
The Group’s liquidity management involves maintaining funding capacity to finance capital<br />
expenditures <strong>and</strong> service maturing debts, <strong>and</strong> to accommodate any fluctuations in asset <strong>and</strong><br />
liability levels due to changes in the Group’s business operations or unanticipated events created<br />
by customer behavior or capital market conditions. The Group maintains a level of cash <strong>and</strong> cash<br />
*SGVMC115503*
- 32 -<br />
equivalents deemed sufficient to finance operations. As part of its liquidity risk management, the<br />
Group regularly evaluates its projected <strong>and</strong> actual cash flows. It also continuously assesses<br />
conditions in the financial markets for opportunities to pursue fund raising activities. Fund raising<br />
activities may include obtaining bank loans <strong>and</strong> availing of export credit agency facilities.<br />
Financial assets<br />
The analysis of financial assets held for liquidity purposes into relevant maturity grouping is based<br />
on the remaining period at the statement of financial position date to the contractual maturity date<br />
or if earlier the expected date the assets will be realized.<br />
Financial liabilities<br />
The relevant maturity grouping is based on the remaining period at the statement of financial<br />
position date to the contractual maturity date. When counterparty has a choice of when the amount<br />
is paid, the liability is allocated to the earliest period in which the Group can be required to pay.<br />
When an entity is committed to make amounts available in installments, each installment is<br />
allocated to the earliest period in which the entity can be required to pay.<br />
The tables below summarize the maturity profile of financial instruments based on remaining<br />
contractual undiscounted cash flows as of December 31, 2010 <strong>and</strong> 2009:<br />
2010<br />
Less than one<br />
month<br />
1 to 3<br />
months<br />
3 to 12<br />
months<br />
1 to 5<br />
years<br />
More than<br />
5 years Total<br />
Financial Assets<br />
Financial assets at FVPL<br />
Designated at FVPL<br />
Quoted debt securities<br />
Private P=51,745,229 P=6,510,240 P=13,472,306 P=1,868,966,549 P=2,299,273,923 P=4,239,968,247<br />
Government – 32,606,000 2,144,050 312,750,450 1,338,688,650 1,686,189,150<br />
51,745,229 39,116,240 15,616,356 2,181,716,999 3,637,962,573 5,926,157,397<br />
Quoted equity securities – – – – 285,950,784 285,950,784<br />
51,745,229 39,116,240 15,616,356 2,181,716,999 3,923,913,357 6,212,108,181<br />
Derivative financial<br />
instruments not<br />
designated as<br />
accounting hedges – 139,059,297 351,425,270 – – 490,484,567<br />
51,745,229 178,175,537 367,041,626 2,181,716,999 3,923,913,357 6,702,592,748<br />
AFS investments<br />
Quoted equity securities – – – – 104,120,000 104,120,000<br />
Loans <strong>and</strong> receivables<br />
Cash <strong>and</strong> cash equivalents 9,776,460,386 – – – – 9,776,460,386<br />
Receivables:<br />
Trade receivables 386,222,100 56,120,518 11,647,971 11,144,351 – 465,134,940<br />
Interest receivable 134,819,376 – – – – 134,819,376<br />
Due from related<br />
parties* 86,576,474 – – – – 86,576,474<br />
Others ** 135,284,134 39,319,282 969,633 305,752 – 175,878,801<br />
P=10,571,107,699 P=273,615,337 P=379,659,230 P=2,193,167,102 P=4,028,033,357 P=17,445,582,725<br />
Financial Liabilities<br />
On-balance sheet<br />
Financial liabilities at<br />
amortized cost<br />
Accounts payable <strong>and</strong><br />
other accrued<br />
liabilities*** P=1,538,738,776 P=1,469,497,765 P=1,727,247,931 P=361,781,897 P=19,886,872 5,117,153,241<br />
Due to related parties* 35,529,304 – – – – 35,529,304<br />
Long-term debt 213,007,746 566,294,911 2,079,034,332 10,616,930,315 8,713,422,758 22,188,690,062<br />
Others**** – – – 923,451,428 – 923,451,428<br />
1,787,275,826 2,035,792,676 3,806,282,263 11,902,163,640 8,733,309,630 28,264,824,035<br />
Off-balance sheet<br />
Contingent liability***** – – 6,711,777,434 24,777,021,191 – 31,488,798,625<br />
P=1,787,275,826 P=2,035,792,676 P=10,518,059,697 P=36,679,184,831 P=8,733,309,630 P=59,753,622,660<br />
*Receivable <strong>and</strong> payable on dem<strong>and</strong><br />
**Include nontrade receivables from derivative counterparties <strong>and</strong> employees<br />
***Excluding government-related payables<br />
****Included under ‘Other noncurrent liabilities’ in the consolidated statement of financial position.<br />
*****Pertains to capital expenditure commitments (Note 27)<br />
*SGVMC115503*
- 33 -<br />
2009<br />
Less than one<br />
month<br />
1 to 3<br />
months<br />
3 to 12<br />
months<br />
1 to 5<br />
years<br />
More than<br />
5 years Total<br />
Financial Assets<br />
Financial assets at FVPL<br />
Derivative financial<br />
instruments not<br />
designated as accounting<br />
hedges P=– P=75,690,598 P=227,552,424 P=– P=– P=303,243,022<br />
Loans <strong>and</strong> receivables<br />
Cash <strong>and</strong> cash equivalents 3,841,124,922 – – – – 3,841,124,922<br />
Receivables<br />
Trade receivables 500,388,829 42,657,317 21,739,545 – – 564,785,691<br />
Due from related<br />
parties* 40,389,601 – – – – 40,389,601<br />
Others** 189,759,389 – – – – 189,759,389<br />
P=4,571,662,741 P=118,347,915 P=249,291,969 P=– P=– P=4,939,302,625<br />
Financial Liabilities<br />
Financial liabilities at<br />
amortized cost<br />
Accounts payable <strong>and</strong><br />
other accrued<br />
liabilities*** P=454,140,097 P=4,176,669,268 P=33,120,435 P=– P=– P=4,663,929,800<br />
Due to related parties* 73,716,757 – – – – 73,716,757<br />
Long-term debt – 553,806,613 1,884,006,031 9,135,034,372 7,443,503,843 19,016,350,859<br />
Others**** – – – 910,665,374 – 910,665,374<br />
P=527,856,854 P=4,730,475,881 P=1,917,126,466 P=10,045,699,746 P=7,443,503,843 P=24,664,662,790<br />
*Receivable <strong>and</strong> payable on dem<strong>and</strong><br />
**Include nontrade receivables from derivative counterparties <strong>and</strong> employees<br />
***Excluding government-related payables<br />
****Included under ‘Other noncurrent liabilities’ in the consolidated statement of financial position.<br />
Market Risk<br />
Market risk is the risk of loss to future earnings, to fair values or to future cash flows that may<br />
result from changes in the price of a financial instrument. The value of a financial instrument may<br />
change as a result of changes in foreign currency exchange rates, interest rates, commodity prices<br />
or other market changes. The Group’s market risk originates from its holding of foreign exchange<br />
instruments, interest-bearing instruments <strong>and</strong> derivatives.<br />
Foreign currency risk<br />
Foreign currency risk arises on financial instruments that are denominated in a foreign currency<br />
other than the functional currency in which they are measured. It is the risk that the value of a<br />
financial instrument will fluctuate due to changes in foreign exchange rates.<br />
The Group has transactional currency exposures. Such exposures arise from sales <strong>and</strong> purchases<br />
in currencies other than the Parent Company’s functional currency. During the years ended<br />
December 31, 2010, 2009 <strong>and</strong> 2008, approximately 24.40%, 23.20% <strong>and</strong> 21.10%, respectively, of<br />
the Group’s total sales are denominated in currencies other than the functional currency.<br />
Furthermore, the Group’s capital expenditures are substantially denominated in US Dollar. As of<br />
December 31, 2010 <strong>and</strong> 2009, 68.32% <strong>and</strong> 73.91%, respectively, of the Group’s financial<br />
liabilities were denominated in US Dollar, respectively.<br />
The Group does not have any foreign currency hedging arrangements.<br />
*SGVMC115503*
- 34 -<br />
The tables below summarize the Group’s exposure to foreign currency risk. Included in the tables<br />
are the Group’s financial assets <strong>and</strong> liabilities at carrying amounts, categorized by currency.<br />
2010<br />
US Dollar<br />
Hong Kong<br />
Dollar<br />
Singaporean<br />
Dollar<br />
Other<br />
Currencies*<br />
Total<br />
Financial Assets<br />
Financial Assets at FVPL<br />
Designated at FVPL<br />
Quoted debt securities<br />
Private P=2,086,089,903 P=– P=– P=– P=2,086,089,903<br />
Government 1,017,480,478 – – – 1,017,480,478<br />
3,103,570,381 – – – 3,103,570,381<br />
Quoted equity securities 285,950,784 – – – 285,950,784<br />
3,389,521,165 – – – 3,389,521,165<br />
Derivative financial<br />
instruments not designated<br />
as accounting hedges 489,917,466 – – – 489,917,466<br />
3,879,438,631 – – – 3,879,438,631<br />
AFS investments:<br />
Quoted equity securities 114,532,000 114,532,000<br />
Cash <strong>and</strong> cash equivalents 1,567,055,465 45,463,367 13,116,910 258,013,947 1,883,649,689<br />
Receivables 348,009,633 6,836,340 36,788,388 70,264,523 461,898,884<br />
Refundable deposits** 9,240,000 – – – 9,240,000<br />
5,918,275,729 52,299,707 49,905,298 328,278,470 6,348,759,204<br />
Financial Liabilities<br />
Accounts payable <strong>and</strong> other<br />
accrued liabilities*** 2,527,277,204 35,990,964 45,849,225 79,987,436 2,689,104,829<br />
Long-term debt 18,432,708,704 – – – 18,432,708,704<br />
Others**** 923,451,428 – – – 923,451,428<br />
P=21,883,437,336 P=35,990,964 P=45,849,225 P=79,987,436 P=22,045,264,961<br />
* Other currencies include Malaysian ringgit, Korean won, New Taiwan dollar, Japanese yen, Australian dollar <strong>and</strong> Euro.<br />
** Included under ‘Other noncurrent assets’ account in the consolidated statement of financial position.<br />
***Excluding government-related payables<br />
**** Included under ‘Other noncurrent liabilities’ in the consolidated statement of financial position.<br />
2009<br />
US Dollar<br />
Hong Kong<br />
Dollar<br />
Singaporean<br />
Dollar<br />
Other<br />
Currencies*<br />
Total<br />
Financial Assets<br />
Financial Assets at FVPL<br />
Derivative financial<br />
instruments not designated<br />
as accounting hedges P=227,794,364 P=– P=– P=– P=227,794,364<br />
Cash <strong>and</strong> cash equivalents 66,485,872 35,259,013 37,841,597 139,543,036 279,129,518<br />
Receivables 473,305,027 16,017,938 13,207,009 72,026,367 574,556,341<br />
Refundable deposits** 9,240,000 – – – 9,240,000<br />
P=776,825,263 P=51,276,951 P=51,048,606 P=211,569,403 P=1,090,720,223<br />
Financial Liabilities<br />
Accounts payable <strong>and</strong> other<br />
accrued liabilities*** P=2,724,153,551 P=34,577,933 P=21,349,961 P=68,484,838 P=2,848,566,283<br />
Long-term debt 17,110,126,731 – – – 17,110,126,731<br />
Others**** 910,665,374 – – – 910,665,374<br />
P=20,744,945,656 P=34,577,933 P=21,349,961 P=68,484,838 P=20,869,358,388<br />
* Other currencies include Malaysian ringgit, Korean won, New Taiwan dollar, Japanese yen, Australian dollar <strong>and</strong> Euro.<br />
** Included under ‘Other noncurrent assets’ account in the consolidated statement of financial position.<br />
***Excluding government-related payables<br />
**** Included under ‘Other noncurrent liabilities’ in the consolidated statement of financial position.<br />
*SGVMC115503*
- 35 -<br />
The exchange rates used to restate the Group’s foreign currency-denominated assets <strong>and</strong> liabilities<br />
as of December 31, 2010 <strong>and</strong> 2009 follow:<br />
2010 2009<br />
US dollar P=43.84 to US$1.00 P=46.20 to US$1.00<br />
Singapore dollar P=34.16 to SGD1.00 P=33.11 to SGD1.00<br />
Hong Kong dollar P=5.64 to HKD1.00 P=5.99 to HKD1.00<br />
The following table sets forth the impact of the range of reasonably possible changes in the<br />
US dollar - Philippine peso exchange value on the Group’s pre-tax income for the years ended<br />
December 31, 2010, 2009 <strong>and</strong> 2008 (in thous<strong>and</strong>s).<br />
2010 2009 2008<br />
Changes in foreign exchange value P=5 (P=5) P=5 (P=5) P=5 (P=5)<br />
Change in pre-tax income (P=1,833,907) P=1,833,907 (P=2,161,052) P=2,161,052 (P=1,836,122) P=1,836,122<br />
Change in equity P=13,063 (P=13,063) – – – –<br />
Other than the potential impact on the Group’s pre-tax income <strong>and</strong> change in equity from AFS<br />
investments, there is no other effect on equity.<br />
The Group does not expect the impact of the volatility on other currencies to be material.<br />
Commodity price risk<br />
The Group enters into commodity derivatives to manage its price risks on fuel purchases.<br />
Commodity hedging allows stability in prices, thus offsetting the risk of volatile market<br />
fluctuations. Depending on the economic hedge cover, the price changes on the commodity<br />
derivative positions are offset by higher or lower purchase costs on fuel. A change in price by<br />
US$10.00 per barrel of jet fuel affects the Group’s fuel costs in pre-tax income by<br />
P=989.8 million, P=938.3 million <strong>and</strong> P=707.9 million as of December 31, 2010, 2009 <strong>and</strong> 2008,<br />
respectively, in each of the covered periods, assuming no change in volume of fuel is consumed.<br />
Interest rate risk<br />
Interest rate risk arises on interest-bearing financial instruments recognized in the consolidated<br />
statement of financial position <strong>and</strong> on some financial instruments not recognized in the<br />
consolidated statement of financial position (i.e., some loan commitments, if any). The Group’s<br />
policy is to manage its interest cost using a mix of fixed <strong>and</strong> variable rate debt (Note 16).<br />
*SGVMC115503*
- 36 -<br />
The following tables show information about the Group’s long-term debt that are exposed to interest rate risk <strong>and</strong> are presented by maturity profile:<br />
December 31, 2010<br />
Total<br />
(In US Dollar)<br />
Total<br />
(in Philippine<br />
Peso)<br />
1-2 years >2-3 years >3-4 years >4-5 years >5 years<br />
Fair Value<br />
ECA-backed loans<br />
from foreign banks<br />
(Note 16)<br />
Floating rate<br />
US Dollar<br />
London<br />
Interbank<br />
Offering<br />
Rate (LIBOR)<br />
6 months + margin US$1,211,956 US$1,132,585 US$1,181,953 US$1,232,086 US$1,284,346 US$7,291,709 US$13,334,635 P=584,590,468 P=392,351,552<br />
US Dollar<br />
LIBOR<br />
3 months + margin 7,268,522 7,482,058 7,741,580 7,986,369 8,231,612 65,439,910 104,150,051 4,565,938,174 4,248,601,240<br />
8,480,478 8,614,643 8,923,533 9,218,455 9,515,958 72,731,619 117,484,686 5,150,528,642 4,640,952,792<br />
Commercial loans<br />
from foreign banks<br />
(Note 16)<br />
Floating rate<br />
US Dollar<br />
LIBOR<br />
6 months + margin 1,484,287 1,556,977 1,635,135 1,361,101 – – 6,037,500 264,683,997 234,616,294<br />
US$9,964,765 US$10,171,620 US$10,558,668 US$10,579,556 US$9,515,958 US$72,731,619 US$123,522,186 P=5,415,212,639 P=4,875,569,086<br />
*SGVMC115503*
- 37 -<br />
December 31, 2009<br />
Total<br />
(In US Dollar)<br />
Total<br />
(in Philippine<br />
Peso)<br />
1-2 years >2-3 years >3-4 years >4-5 years >5 years<br />
Fair Value<br />
Commercial loans<br />
from foreign banks<br />
(Note 16)<br />
Floating rate<br />
US Dollar<br />
LIBOR<br />
6 months + margin US$1,693,626 US$1,777,678 US$1,865,176 US$1,958,488 US$1,700,951 US$– US$8,995,919 P=415,611,458 P=365,629,445<br />
*SGVMC115503*
- 38 -<br />
The following table sets forth the impact of the range of reasonably possible changes in interest<br />
rates on the Group’s pre-tax income for the years ended December 31, 2010, 2009 <strong>and</strong> 2008.<br />
2010 2009 2008<br />
Changes in interest rates 1.50% (1.50%) 1.50% (1.50%) 1.50% (1.50%)<br />
Changes in pre-tax income (P=42,709,321) P=42,709,321 (P=17,090,428) P=17,090,428 (P=185,959,218) P=185,959,218<br />
Fair value interest rate risk<br />
Fair value interest rate risk is the risk that the value/future cash flows of a financial instrument<br />
will fluctuate because of changes in market interest rates. The Group’s exposure to interest rate<br />
risk relates primarily to the Group’s financial assets designated at FVPL.<br />
The following table demonstrates the sensitivity to a reasonably possible change in interest rates,<br />
with all other variables held constant, of the Group’s pre-tax income, through the impact of<br />
mark-to-market of financial assets designated at FVPL which are recognized in profit or loss.<br />
2010<br />
Changes in market interest rates 1.50% (1.50%)<br />
Changes in pre-tax income (P=210,554,767) P=248,358,396<br />
Other than the potential impact on the Group’s pre-tax income, there is no other effect on equity.<br />
5. Fair Value Measurement<br />
The methods <strong>and</strong> assumptions used by the Group in estimating the fair value of its financial<br />
instruments are:<br />
Cash <strong>and</strong> cash equivalents (excluding cash on h<strong>and</strong>), Receivables <strong>and</strong> Accounts payable <strong>and</strong> other<br />
accrued liabilities<br />
Carrying amounts approximate their fair values due to the relatively short-term maturity of these<br />
instruments.<br />
Investments in quoted equity securities<br />
Fair values are based on quoted prices published in markets.<br />
Amounts due from <strong>and</strong> due to related parties<br />
Carrying amounts of due from/to related parties, which are receivable/payable <strong>and</strong> due on dem<strong>and</strong>,<br />
approximate their fair values.<br />
Non-interest bearing refundable deposits<br />
The fair values are determined based on the present value of estimated future cash flows using<br />
prevailing market rates. The Group used discount rates of 6.93% in 2010 <strong>and</strong> 8.72% in 2009.<br />
Derivative instruments<br />
The fair values of fuel derivatives are based on quotes obtained from an independent counterparty.<br />
Long-term debt<br />
The fair value of long-term debt is determined using the discounted cash flow methodology, with<br />
reference to the Group’s current incremental lending rates for similar types of loans. The discount<br />
curve used range from 3.29% to 3.72% as of December 31, 2010 <strong>and</strong> from 6.14% to 6.88% as of<br />
December 31, 2009.<br />
*SGVMC115503*
- 39 -<br />
The following table summarizes the carrying amounts <strong>and</strong> fair values of all the Group’s financial<br />
instruments.<br />
2010 2009<br />
Carrying Value Fair Value Carrying Value Fair Value<br />
Financial Assets<br />
Financial assets at FVPL (Note 8)<br />
Designated at FVPL<br />
Quoted debt securities<br />
Private P=2,086,089,903 P=2,086,089,903 P=– P=–<br />
Government 1,017,480,478 1,017,480,478 – –<br />
3,103,570,381 3,103,570,381 – –<br />
Quoted equity securities 285,950,784 285,950,784 – –<br />
3,389,521,165 3,389,521,165 – –<br />
Derivative financial instruments<br />
not designated as accounting<br />
hedges 489,917,466 489,917,466 227,794,364 227,794,364<br />
3,879,438,631 3,879,438,631 227,794,364 227,794,364<br />
AFS investments (Note 8)<br />
Quoted equity securities 114,532,000 114,532,000 – –<br />
Loans <strong>and</strong> receivables<br />
Cash <strong>and</strong> cash equivalents<br />
(Note 7) 9,763,288,972 9,763,288,972 3,840,859,455 3,840,859,455<br />
Receivables (Note 9)<br />
Trade receivables 465,134,940 465,134,940 564,785,691 564,785,691<br />
Interest receivable 134,819,376 134,819,376 – –<br />
Due from related parties 86,576,474 86,576,474 40,389,601 40,389,601<br />
Others* 175,878,801 175,878,801 189,759,389 189,759,389<br />
Refundable deposits** (Note 14) 9,240,000 5,870,794 9,240,000 5,123,925<br />
10,749,470,563 10,746,101,357 4,645,034,136 4,640,918,061<br />
Total financial assets P=14,628,909,194 P=14,625,539,988 P=4,872,828,500 P=4,868,712,425<br />
Financial Liabilities<br />
Financial liabilities at amortized<br />
cost:<br />
Accounts payable <strong>and</strong> other<br />
accrued liabilities***<br />
(Note 15) P=5,117,153,241 P=5,117,153,241 P=4,663,929,800 P=4,663,929,800<br />
Due to related parties 35,529,304 35,529,304 73,716,757 73,716,757<br />
Long-term debt****(Note 16) 18,432,708,704 16,164,927,534 17,110,126,731 14,503,855,491<br />
Others***** 923,451,428 923,451,428 910,665,374 910,665,374<br />
Total financial liabilities P=24,508,842,677 P=22,241,061,507 P=22,758,438,662 P=20,152,167,422<br />
* Include nontrade receivables from derivative counterparties <strong>and</strong> employees<br />
** Included under ‘Other noncurrent assets’ account in the consolidated statements of financial position<br />
*** Excluding government-related payables<br />
**** Includes current portion<br />
***** Included under ‘Other noncurrent liabilities’ in the consolidated statements of financial position.<br />
The Group uses the following hierarchy for determining <strong>and</strong> disclosing the fair value of financial<br />
assets designated at FVPL, derivative financial instruments <strong>and</strong> AFS investments by valuation<br />
techniques:<br />
(a) Level 1: quoted (unadjusted) prices in an active market for identical assets or liabilities;<br />
(b) Level 2: other techniques for which all inputs which have a significant effect on the recorded<br />
fair value are observable, either directly or indirectly; <strong>and</strong><br />
(c) Level 3: techniques which use inputs which have a significant effect on the recorded fair value<br />
that are not based on observable market data.<br />
*SGVMC115503*
- 40 -<br />
The table below shows the Group’s financial instruments carried at fair value hierarchy<br />
classification:<br />
2010 2009<br />
Level 1 Level 2 Level 1 Level 2<br />
Financial assets at FVPL (Note 8)<br />
Designated at FVPL<br />
Quoted debt securities<br />
Private P=2,086,089,903 P=– P=– P=–<br />
Government 1,017,480,478 – – –<br />
3,103,570,381 – – –<br />
Quoted equity securities 285,950,784 – – –<br />
3,389,521,165 – – –<br />
Derivative financial instruments<br />
not designated as accounting<br />
hedges – 489,917,466 – 227,794,364<br />
3,389,521,165 489,917,466 – 227,794,364<br />
AFS investments (Note 8)<br />
Quoted equity securities 114,532,000 – – –<br />
P=3,504,053,165 P=489,917,466 P=– P=227,794,364<br />
There are no financial instruments measured at Level 3. There were no transfers within any<br />
hierarchy level of fair value measurements for the years ended December 31, 2010 <strong>and</strong> 2009,<br />
respectively.<br />
6. Segment Information<br />
The Group has one reportable operating segment, which is the airline business (system-wide).<br />
This is consistent with how the Group’s management internally monitors <strong>and</strong> analyzes the<br />
financial information for reporting to the CODM, who is responsible for allocating resources,<br />
assessing performance <strong>and</strong> making operating decisions.<br />
The revenue of the operating segment was mainly derived from rendering transportation services.<br />
All sales are made to external customers.<br />
Segment information for the reportable segment is shown in the following table:<br />
2010 2009 2008<br />
Revenue P=30,510,408,495 P=24,423,611,516 P=19,711,905,090<br />
Net income (loss) 6,922,493,280 3,257,848,705 (3,259,888,005)<br />
Depreciation <strong>and</strong> amortization 2,100,929,764 1,917,683,713 1,546,753,381<br />
Interest expense 931,482,279 1,012,826,822 838,465,333<br />
Interest income 237,495,750 8,848,551 14,231,024<br />
The reconciliation of total revenue reported by reportable operating segment to revenue in the<br />
consolidated statements of comprehensive income is presented in the following table:<br />
2010 2009 2008<br />
Total segment revenue of reportable operating<br />
segment P=29,088,798,959 P=23,311,006,311 P=19,682,144,058<br />
Nontransport revenue <strong>and</strong> other income 1,421,609,536 1,112,605,205 29,761,032<br />
Total revenue P=30,510,408,495 P=24,423,611,516 P=19,711,905,090<br />
*SGVMC115503*
- 41 -<br />
The reconciliation of total income reported by reportable operating segment to total<br />
comprehensive income in the consolidated statements of comprehensive income is presented in<br />
the following table:<br />
2010 2009 2008<br />
Total segment income of reportable segment P=6,450,125,710 P=3,164,042,762 P=1,727,860,535<br />
Add (deduct) unallocated items:<br />
Nontransport revenue <strong>and</strong> other income 1,421,609,536 1,112,605,205 29,761,032<br />
Nontransport expenses <strong>and</strong> other charges (931,482,279) (1,038,300,945) (4,940,188,091)<br />
Benefit from (provision for) income tax (17,759,687) 19,501,683 (77,321,481)<br />
Net income (loss) 6,922,493,280 3,257,848,705 (3,259,888,005)<br />
Other comprehensive loss (2,714,902) – –<br />
Total comprehensive income (loss) P=6,919,778,378 P=3,257,848,705 (P=3,259,888,005)<br />
The Group’s major revenue-producing asset is the fleet of aircraft owned by the Group, which is<br />
employed across its route network (Note 12).<br />
The Group has no significant customer which contributes 10.00% or more to the revenues of the<br />
Group.<br />
7. Cash <strong>and</strong> Cash Equivalents<br />
This account consists of:<br />
2010 2009<br />
Cash on h<strong>and</strong> P=14,424,238 P=14,308,223<br />
Cash in banks 669,548,018 2,021,058,418<br />
Short-term placements (Note 26) 9,079,316,716 1,805,492,814<br />
P=9,763,288,972 P=3,840,859,455<br />
Cash in banks earns interest at the respective bank deposit rates. Short-term placements, which<br />
represent money market placements, are made for varying periods of up to three months<br />
depending on the immediate cash requirements of the Group, <strong>and</strong> earn an average interest of<br />
4.24%, 2.20% <strong>and</strong> 0.50% in 2010, 2009 <strong>and</strong> 2008, respectively, on short-term placements<br />
denominated in Philippine peso. Moreover, short-term placements in US dollar earn an average of<br />
1.20% in 2010.<br />
Interest income on cash <strong>and</strong> cash equivalents, presented in the consolidated statements of<br />
comprehensive income, amounted to P=133.5 million, P=8.8 million <strong>and</strong> P=11.3 million in 2010, 2009<br />
<strong>and</strong> 2008, respectively.<br />
*SGVMC115503*
- 42 -<br />
8. Investment <strong>and</strong> Trading Securities<br />
Financial Assets at FVPL<br />
This account consists of:<br />
2010 2009<br />
Designated at FVPL<br />
Quoted debt securities:<br />
Private P=2,086,089,903 P=–<br />
Government 1,017,480,478 –<br />
3,103,570,381 –<br />
Quoted equity securities 285,950,784 –<br />
3,389,521,165 –<br />
Derivative financial instruments<br />
not designated as accounting hedges 489,917,466 227,794,364<br />
P=3,879,438,631 P=227,794,364<br />
On June 30, 2010, the Group acquired from JGSHI the financial assets designated at FVPL <strong>and</strong><br />
AFS by execution of deed of assignment.<br />
At inception, the Group classified this group of debt <strong>and</strong> equity securities as financial assets<br />
designated at FVPL since their performance are managed <strong>and</strong> evaluated on a fair value basis in<br />
accordance with the Group’s documented investment strategy. The information about these<br />
financial instruments is reported to management on that basis.<br />
As of December 31, 2010, the Group earned interest income of P=104.0 million from debt<br />
securities as financial assets designated at FVPL.<br />
The financial assets designated at FVPL are shown inclusive of unrealized gain amounting to<br />
P=107.6 million.<br />
Commodity options<br />
The Group enters into fuel derivatives to manage its exposure to fuel price fluctuations. Such fuel<br />
derivatives are not designated as accounting hedges. The gains or losses on these instruments are<br />
accounted for directly as a charge against or credit to profit or loss. As of December 31, 2010<br />
<strong>and</strong> 2009, the Group has outst<strong>and</strong>ing fuel hedging transactions with notional quantity of<br />
845,000 US barrels <strong>and</strong> 420,000 US barrels, respectively. The notional quantity is the amount of<br />
the derivatives’ underlying asset or liability, reference rate or index <strong>and</strong> is the basis upon which<br />
changes in the value of derivatives are measured. The options can be exercised at various<br />
calculation dates with specified quantities on each calculation date. The options have various<br />
maturity dates through December 31, 2011.<br />
*SGVMC115503*
- 43 -<br />
Fair value changes on derivatives<br />
The changes in fair value of all derivative financial instruments not designated as accounting<br />
hedges follow:<br />
2010 2009<br />
Balance at beginning of period<br />
Derivative assets P=227,794,364 P=–<br />
Derivative liabilities – (1,945,985,534)<br />
227,794,364 (1,945,985,534)<br />
Net changes in fair value of derivatives 474,255,226 685,574,528<br />
702,049,590 (1,260,411,006)<br />
Fair value of settled instruments (212,132,124) 1,488,205,370<br />
Balance at end of period P=489,917,466 P=227,794,364<br />
Attributable to:<br />
Derivative assets P=489,917,466 P=227,794,364<br />
AFS Investment<br />
This account represents investment in a quoted equity security. As of December 31, 2010, the<br />
carrying value of AFS investment amounted to P=114.5 million.<br />
In 2010, the Group recognized unrealized loss on AFS amounting to P=2.7 million, net of tax<br />
amounting to P=1.2 million.<br />
9. Receivables<br />
This account consists of:<br />
2010 2009<br />
Trade receivables (Note 26) P=471,465,815 P=571,116,566<br />
Interest receivable 134,819,376 –<br />
Due from related parties (Note 26) 86,576,474 40,389,601<br />
Others 402,132,066 428,945,323<br />
1,094,993,731 1,040,451,490<br />
Less allowance for credit losses 232,584,140 245,516,809<br />
P=862,409,591 P=794,934,681<br />
Trade receivables are non-interest bearing <strong>and</strong> generally have 30 to 90 days terms.<br />
In 2010, there was reclassification of advances to suppliers from ‘Receivables’ to ‘Other current<br />
assets’. The Group made the reclassification to make receivables purely financial assets since<br />
advances to suppliers are to be settled through goods <strong>and</strong> services.<br />
Others include receivable under a sublease agreement amounting to P=225.4 million with another<br />
airline company denominated in US dollar. This receivable is fully provided with allowance for<br />
credit losses.<br />
*SGVMC115503*
- 44 -<br />
The changes in the allowance for credit losses on receivables follow:<br />
2010<br />
Trade<br />
Receivables Others Total<br />
Balance at beginning of year P=6,330,875 P=239,185,934 P=245,516,809<br />
Unrealized foreign exchange gain on<br />
allowance for credit losses – (12,932,669) (12,932,669)<br />
Provision for credit losses (Note 21) 2,127,309 – 2,127,309<br />
Write-off (2,127,309) – (2,127,309)<br />
Balance at end of year P=6,330,875 P=226,253,265 P=232,584,140<br />
2009<br />
Trade<br />
Receivables Others Total<br />
Balance at beginning of year P=6,330,875 P= 29,523,507 P=35,854,382<br />
Provision for credit losses (Note 21) – 209,662,427 209,662,427<br />
Balance at end of year P=6,330,875 P=239,185,934 P=245,516,809<br />
As of December 31, 2010 <strong>and</strong> 2009, the specific allowance for credit losses on trade receivables<br />
<strong>and</strong> other receivables amounted to P=6.3 million <strong>and</strong> P=226.3 million, <strong>and</strong> P=6.3 million <strong>and</strong><br />
P=239.2 million, respectively. In 2010, the Group has written off receivables amounting to<br />
P=2.1 million. The provision for credit loss in 2009 relates to other receivables.<br />
10. Expendable Parts, Fuel, Materials <strong>and</strong> Supplies<br />
This account consists of:<br />
2010 2009<br />
At cost:<br />
Expendable parts P=246,212,162 P=172,061,131<br />
Fuel 100,926,756 155,635,257<br />
Materials <strong>and</strong> supplies 22,893,117 21,276,100<br />
P=370,032,035 P=348,972,488<br />
The cost of expendable <strong>and</strong> consumable parts, <strong>and</strong> materials <strong>and</strong> supplies recognized as expense<br />
(included under ‘Repairs <strong>and</strong> maintenance’ account in the consolidated statement of<br />
comprehensive income) for years ended December 31, 2010, 2009 <strong>and</strong> 2008 amounted to<br />
P=172.2 million, P=94.5 million <strong>and</strong> P=63.9 million, respectively.<br />
*SGVMC115503*
- 45 -<br />
11. Other Current Assets<br />
This account consists of:<br />
2010 2009<br />
Prepaid rent P=135,568,016 P=127,689,069<br />
Advances to suppliers 50,042,184 141,523,959<br />
Prepaid insurance 39,089,719 42,014,640<br />
Prepaid fuel tax 36,306,139 23,456,483<br />
Others 3,067,745 6,454,765<br />
P=264,073,803 P=341,138,916<br />
Prepaid rent pertains to advance rental on aircraft under operating lease <strong>and</strong> on office spaces in<br />
airports (Note 27).<br />
*SGVMC115503*
- 46 -<br />
12. Property <strong>and</strong> Equipment<br />
The composition <strong>and</strong> movements in this account follow:<br />
Passenger<br />
<strong>Air</strong>craft<br />
(Notes 16 <strong>and</strong> 28) Engines Rotables<br />
2010<br />
Ground<br />
Support<br />
Equipment<br />
EDP<br />
Equipment,<br />
Mainframe <strong>and</strong><br />
Peripherals<br />
Leasehold<br />
Improvements<br />
Transportation<br />
Equipment<br />
Sub-total<br />
Cost<br />
Balance at January 1, 2010 P=29,082,449,841 P=1,861,014,616 P=645,242,966 P=226,290,672 P=401,958,225 P=123,328,105 P=132,976,761 P=32,473,261,186<br />
Additions 4,617,905,673 – 249,857,038 61,171,112 79,198,359 – 13,870,536 5,022,002,718<br />
Reclassification 1,480,356,826 – – – – 33,634,663 – 1,513,991,489<br />
Disposals/others (845,724,477) (164,105,247) (96,278,255) – – (132,812) (13,718,075) (1,119,958,866)<br />
Balance at December 31, 2010 34,334,987,863 1,696,909,369 798,821,749 287,461,784 481,156,584 156,829,956 133,129,222 37,889,296,527<br />
Accumulated Depreciation<br />
<strong>and</strong> Amortization<br />
Balance at January 1, 2010 5,608,304,763 500,303,926 87,047,351 125,785,164 306,959,766 84,204,878 68,991,712 6,781,597,560<br />
Depreciation <strong>and</strong> amortization 1,802,923,773 95,647,460 46,311,472 42,305,054 60,803,986 15,353,198 19,343,695 2,082,688,638<br />
Disposals/others (91,815,044) (9,535,490) (1,802,621) – – (29,514) (13,405,902) (116,588,571)<br />
Balance at December 31, 2010 7,319,413,492 586,415,896 131,556,202 168,090,218 367,763,752 99,528,562 74,929,505 8,747,697,627<br />
Net Book Value at<br />
December 31, 2010 P=27,015,574,371 P=1,110,493,473 P=667,265,547 P=119,371,566 P=113,392,832 P=57,301,394 P=58,199,717 P=29,141,598,900<br />
(Forward)<br />
*SGVMC115503*
- 47 -<br />
Furniture,<br />
Fixtures <strong>and</strong><br />
Office<br />
Equipment<br />
Communication<br />
Equipment<br />
Special<br />
Tools<br />
2010<br />
Maintenance<br />
<strong>and</strong> Test<br />
Equipment<br />
Other<br />
Equipment<br />
Construction<br />
In-progress<br />
Total<br />
Cost<br />
Balance at January 1, 2010 P=54,222,266 P=6,174,321 P=11,933,090 P=5,697,385 P=59,654,657 P=3,409,527,269 P=36,020,470,174<br />
Additions 10,402,157 1,062,698 457,490 712,992 7,558,844 3,027,480,866 8,069,677,765<br />
Reclassification – – – – – (1,513,991,489) –<br />
Disposals/others – – – – – (134,848,017) (1,254,806,883)<br />
Balance at December 31, 2010 64,624,423 7,237,019 12,390,580 6,410,377 67,213,501 4,788,168,629 42,835,341,056<br />
Accumulated Depreciation <strong>and</strong> Amortization<br />
Balance at January 1, 2010 34,648,972 3,407,186 10,720,871 5,596,765 29,327,430 – 6,865,298,784<br />
Depreciation <strong>and</strong> amortization 6,933,482 940,470 498,330 124,379 9,744,465 – 2,100,929,764<br />
Disposals/others – – – – – – (116,588,571)<br />
Balance at December 31, 2010 41,582,454 4,347,656 11,219,201 5,721,144 39,071,895 – 8,849,639,977<br />
Net Book Value at December 31, 2010 P=23,041,969 P=2,889,363 P=1,171,379 P=689,233 P=28,141,606 P=4,788,168,629 P=33,985,701,079<br />
*SGVMC115503*
- 48 -<br />
Passenger<br />
<strong>Air</strong>craft<br />
(Note 16) Engines Rotables<br />
2009<br />
Ground<br />
Support<br />
Equipment<br />
EDP<br />
Equipment,<br />
Mainframe <strong>and</strong><br />
Peripherals<br />
Leasehold<br />
Improvements<br />
Transportation<br />
Equipment<br />
Sub-total<br />
Cost<br />
Balance at January 1, 2009 P=27,135,964,502 P=1,445,988,273 P=452,887,018 P=172,712,317 P=327,772,983 P=110,312,277 P=84,131,582 P=29,729,768,952<br />
Additions 1,946,485,339 415,026,343 227,259,326 53,578,355 74,185,242 – 48,845,179 2,765,379,784<br />
Reclassification – – – – – 13,015,828 – 13,015,828<br />
Disposals/others – – (34,903,378) – – – – (34,903,378)<br />
Balance at December 31, 2009 29,082,449,841 1,861,014,616 645,242,966 226,290,672 401,958,225 123,328,105 132,976,761 32,473,261,186<br />
Accumulated Depreciation<br />
<strong>and</strong> Amortization<br />
Balance at January 1, 2009 3,922,697,367 421,807,112 53,823,013 92,674,545 261,769,001 73,985,295 54,125,739 4,880,882,072<br />
Depreciation <strong>and</strong> amortization 1,685,607,396 78,496,814 34,167,620 33,110,619 45,190,765 10,219,583 14,865,973 1,901,658,770<br />
Disposals – – (943,282) – – – – (943,282)<br />
Balance at December 31, 2009 5,608,304,763 500,303,926 87,047,351 125,785,164 306,959,766 84,204,878 68,991,712 6,781,597,560<br />
Net Book Value at December 31, 2009 P=23,474,145,078 P=1,360,710,690 P=558,195,615 P=100,505,508 P=94,998,459 P=39,123,227 P=63,985,049 P=25,691,663,626<br />
Furniture,<br />
Fixtures <strong>and</strong><br />
Office<br />
Equipment<br />
Communication<br />
Equipment<br />
Special<br />
Tools<br />
2009<br />
Maintenance<br />
<strong>and</strong> Test<br />
Equipment<br />
Other<br />
Equipment<br />
Construction<br />
In-progress<br />
Total<br />
Cost<br />
Balance at January 1, 2009 P=45,918,941 P=4,886,541 P=11,187,696 P=5,599,173 P=39,896,606 P=2,800,329,434 P=32,637,587,343<br />
Additions 8,303,325 1,287,780 745,394 98,212 19,758,051 622,213,663 3,417,786,209<br />
Reclassification – – – – – (13,015,828) –<br />
Disposals/others – – – – – – (34,903,378)<br />
Balance at December 31, 2009 54,222,266 6,174,321 11,933,090 5,697,385 59,654,657 3,409,527,269 36,020,470,174<br />
Accumulated Depreciation <strong>and</strong> Amortization<br />
Balance at January 1, 2009 28,088,534 2,590,665 10,198,179 5,584,468 21,214,435 – 4,948,558,353<br />
Depreciation <strong>and</strong> amortization 6,560,438 816,521 522,692 12,297 8,112,995 – 1,917,683,713<br />
Disposals – – – – – – (943,282)<br />
Balance at December 31, 2009 34,648,972 3,407,186 10,720,871 5,596,765 29,327,430 – 6,865,298,784<br />
Net Book Value at December 31, 2009 P=19,573,294 P=2,767,135 P=1,212,219 P=100,620 P=30,327,227 P=3,409,527,269 P=29,155,171,390<br />
*SGVMC115503*
- 49 -<br />
Passenger <strong>Air</strong>craft Held as Securing Assets Under Various Loans<br />
In 2005 <strong>and</strong> 2006, the Group entered into Export Credit Agency (ECA)-backed loan facilities<br />
(ECA loans) to partially finance the purchase of ten <strong>Air</strong>bus A319 aircraft. In 2007, the Group also<br />
entered into a commercial loan facility to partially finance the purchase of two <strong>Air</strong>bus A320<br />
aircraft, one CFM 565B4/P engine, two CFM 565B5/P engines <strong>and</strong> one Quick Engine Change<br />
(QEC) Kit. In 2008, the Group entered into both ECA loans <strong>and</strong> commercial loans to partially<br />
finance the purchase of six Avion de Transport Regional (ATR) 72-500 turboprop aircraft. Then<br />
in 2009, ECA loans were availed to finance the purchase of two ATR 72-500 turboprop aircraft.<br />
In 2010, the Group entered into ECA loan to finance the purchase of three <strong>Air</strong>bus A320 aircraft.<br />
Under the terms of the ECA loan <strong>and</strong> the commercial loan facilities (Note 16), upon the event of<br />
default, the outst<strong>and</strong>ing amount of loan (including accrued interest) will be payable by CALL or<br />
ILL or BLL or SLL or SALL, or by the guarantors which are CPAHI <strong>and</strong> JGSHI. Failure to pay<br />
the obligation will allow the respective lenders to foreclose the securing assets.<br />
As of December 31, 2010 <strong>and</strong> 2009, the carrying amounts of the securing assets (included under<br />
the ‘Property <strong>and</strong> equipment’ account) amounted to P=26.6 billion <strong>and</strong> P=23.6 billion, respectively.<br />
On July 18, 2010, one ATR 72-500 turboprop aircraft was damaged due to a hard l<strong>and</strong>ing at the<br />
Ninoy Aquino International <strong>Air</strong>port (NAIA). On November 30, 2010, the Group received<br />
insurance proceeds <strong>and</strong> terminated the related loan. Accordingly, rights over the aircraft went to<br />
the insurers.<br />
Operating Fleet<br />
As of December 31, 2010 <strong>and</strong> 2009, the Group’s operating fleet follows:<br />
2010 2009<br />
Owned (Note 16):<br />
<strong>Air</strong>bus A319 10 10<br />
<strong>Air</strong>bus A320 5 2<br />
ATR 72-500 7 8<br />
Under operating lease (Note 27):<br />
<strong>Air</strong>bus A320 9 9<br />
31 29<br />
Construction in-progress represents the cost of aircraft <strong>and</strong> engine construction in progress <strong>and</strong><br />
buildings <strong>and</strong> improvements <strong>and</strong> other ground property under construction. Construction<br />
in-progress is not depreciated until such time when the relevant assets are completed <strong>and</strong> available<br />
for use. As of December 31, 2010 <strong>and</strong> 2009, the Group’s capitalized pre-delivery payments as<br />
construction-in-progress amounted to P=4.8 billion <strong>and</strong> P=3.4 billion, respectively.<br />
As of December 31, 2010 <strong>and</strong> 2009, the gross amount of fully depreciated property <strong>and</strong> equipment<br />
which are still in use by the Group amounted to P=430.4 million <strong>and</strong> P=345.0 million, respectively.<br />
*SGVMC115503*
- 50 -<br />
13. Investment in Joint Ventures<br />
This account represents the Group’s 49.00% <strong>and</strong> 35.00% interest in A-plus <strong>and</strong> SIAEP,<br />
respectively. These jointly controlled entities were established for the purpose of providing line,<br />
light <strong>and</strong> heavy maintenance services to foreign <strong>and</strong> local airlines, utilizing the facilities <strong>and</strong><br />
services at airports in the country, as well as aircraft maintenance <strong>and</strong> repair organizations. A-plus<br />
was incorporated on May 24, 2005 <strong>and</strong> started commercial operations on July 1, 2005 while<br />
SIAEP was incorporated on July 27, 2008 <strong>and</strong> started commercial operations on August 17, 2009.<br />
The movements in the carrying values of the Group’s investments in A-plus <strong>and</strong> SIAEP follow:<br />
2010<br />
A-plus SIAEP Total<br />
Cost P=87,012,572 P=304,763,900 P=391,776,472<br />
Accumulated Equity in Net Income (Loss)<br />
Balance at beginning of period 21,590,662 (47,011,448) (25,420,786)<br />
Equity in net income (loss) for the period 30,485,667 (5,237,133) 25,248,534<br />
Dividends received (21,959,482) – (21,959,482)<br />
Balance at end of period 30,116,847 (52,248,581) (22,131,734)<br />
Net Carrying Value P=117,129,419 P=252,515,319 P=369,644,738<br />
2009<br />
A-plus SIAEP Total<br />
Cost<br />
Balance at beginning of period P=87,012,572 P=270,950,400 P=357,962,972<br />
Additions – 33,813,500 33,813,500<br />
Balance at end of period 87,012,572 304,763,900 391,776,472<br />
Accumulated Equity in Net Income (Loss)<br />
Balance at beginning of period 24,157,910 (4,660,978) 19,496,932<br />
Equity in net income (loss) for the period 16,876,347 (42,350,470) (25,474,123)<br />
Dividends received (19,443,595) – (19,443,595)<br />
Balance at end of period 21,590,662 (47,011,448) (25,420,786)<br />
Net Carrying Value P=108,603,234 P=257,752,452 P=366,355,686<br />
Selected financial information of A-plus <strong>and</strong> SIAEP follows:<br />
2010 2009<br />
A-plus SIAEP A-plus SIAEP<br />
Total current assets P=389,229,753 P=198,601,718 P=320,311,261 P=180,571,520<br />
Total assets 440,003,102 827,498,709 395,640,695 824,131,114<br />
Total current liabilities 199,744,327 136,071,974 163,605,255 79,651,426<br />
Total liabilities 199,744,327 136,071,974 172,079,904 79,651,426<br />
Net income (loss) 62,215,647 (14,963,237) 34,441,525 (121,001,344)<br />
The fiscal year-end of A-plus <strong>and</strong> SIAEP is every March 31.<br />
The undistributed earnings of A-plus included in the consolidated retained earnings amounted to<br />
P=30.1 million <strong>and</strong> P=21.6 million as of December 31, 2010 <strong>and</strong> 2009, respectively, which is not<br />
currently available for dividend distribution unless declared by A-plus.<br />
The Group has no share of any contingent liabilities or capital commitments as of<br />
December 31, 2010 <strong>and</strong> 2009.<br />
*SGVMC115503*
- 51 -<br />
14. Other Noncurrent Assets<br />
This account consists of:<br />
2010 2009<br />
Creditable withholding tax P=105,122,460 P=106,718,423<br />
Refundable deposits 9,240,000 9,240,000<br />
Others 213,484,694 131,790,499<br />
P=327,847,154 P=247,748,922<br />
Refundable deposits pertain to security deposits provided to lessor for aircraft under operating<br />
lease.<br />
Others include option <strong>and</strong> commitment fees.<br />
15. Accounts Payable <strong>and</strong> Other Accrued Liabilities<br />
This account consists of:<br />
2010 2009<br />
Accrued expenses P=2,756,352,038 P=2,680,026,500<br />
Trade payables (Note 26) 1,995,958,241 1,653,174,194<br />
<strong>Air</strong>port <strong>and</strong> other related fees payable 435,286,079 330,026,161<br />
Advances from agents <strong>and</strong> others 159,557,017 116,676,592<br />
Accrued interest payable (Note 16) 118,666,608 160,873,352<br />
Other payables 132,666,336 59,034,908<br />
P=5,598,486,319 P=4,999,811,707<br />
Accrued Expenses<br />
The Group’s accrued expenses include accruals for:<br />
2010 2009<br />
Maintenance P=637,721,177 P=867,799,823<br />
Compensation <strong>and</strong> benefits 519,578,237 189,958,024<br />
Advertising <strong>and</strong> promotion 292,832,984 189,072,676<br />
L<strong>and</strong>ing <strong>and</strong> take-off fees 237,135,007 255,145,076<br />
Training costs 221,810,780 147,092,481<br />
Ground h<strong>and</strong>ling charges 185,902,242 174,394,466<br />
Navigational charges 185,830,569 156,160,771<br />
Repairs <strong>and</strong> services 115,290,273 213,394,866<br />
Rent (Note 27) 71,405,104 59,030,433<br />
Fuel 66,914,013 120,563,391<br />
<strong>Air</strong>craft insurance 41,059,836 40,622,537<br />
Catering supplies 38,441,922 38,819,586<br />
Reservation costs 11,773,991 12,087,036<br />
Others 130,655,903 215,885,334<br />
P=2,756,352,038 P=2,680,026,500<br />
*SGVMC115503*
- 52 -<br />
Others represent accrual of professional fees, security, utilities <strong>and</strong> other expenses.<br />
Trade Payables<br />
Trade payables, which consist mostly of payables related to the purchase of inventories, are<br />
non interest-bearing <strong>and</strong> are normally settled on a 60-day term. These inventories are necessary<br />
for the daily operations <strong>and</strong> maintenance of the aircraft, which include aviation fuel, expendables<br />
parts, equipment <strong>and</strong> in-flight supplies.<br />
<strong>Air</strong>port <strong>and</strong> Other Related Fees Payable<br />
<strong>Air</strong>port <strong>and</strong> other related fees payable are amounts payable to the Philippine Tourism Authority<br />
<strong>and</strong> <strong>Air</strong> Transportation Office on aviation security, terminal fees <strong>and</strong> travel taxes.<br />
Interest Payable<br />
Interest payable is related to long-term debt <strong>and</strong> normally settled quarterly throughout the year.<br />
Advances from Agents <strong>and</strong> Others<br />
Advances from agents <strong>and</strong> others represent cash bonds required from major sales <strong>and</strong> ticket<br />
offices or agents.<br />
Other Payables<br />
Other payables are non interest-bearing <strong>and</strong> have an average term of two months. This account<br />
includes commissions payable, refunds payable <strong>and</strong> other tax liabilities such as withholding taxes<br />
<strong>and</strong> output VAT.<br />
16. Long-term Debt<br />
This account consists of:<br />
2010<br />
Interest Rates Maturities US Dollar<br />
Philippine Peso<br />
Equivalent<br />
ECA loans 3.37% to 5.83% Various<br />
dates<br />
through<br />
2022<br />
US$242,476,310 P=10,630,161,421<br />
Commercial loans from<br />
foreign banks<br />
0.86% to 2.54%<br />
(US Dollar LIBOR<br />
6 months + margin or<br />
3 months + margin) 117,484,686 5,150,528,642<br />
359,960,996 15,780,690,063<br />
4.11% to 5.67% Various<br />
dates<br />
1.64% to 2.12% through<br />
(US Dollar LIBOR 2017<br />
54,455,626 2,387,334,644<br />
6 months + margin) 6,037,500 264,683,997<br />
60,493,126 2,652,018,641<br />
420,454,122 18,432,708,704<br />
Less current portion 46,898,810 2,056,043,837<br />
US$373,555,312 P=16,376,664,867<br />
*SGVMC115503*
- 53 -<br />
2009<br />
Interest Rates Maturities US Dollar<br />
Philippine Peso<br />
Equivalent<br />
ECA loans 3.37% to 5.83% Various<br />
dates<br />
through<br />
2018 US$300,086,362 P=13,863,989,944<br />
Commercial loans from<br />
foreign banks<br />
4.11% to 5.67% Various<br />
dates<br />
4.75% to 5.25% through<br />
(US Dollar LIBOR 2017<br />
61,266,782 2,830,525,329<br />
6 months + margin) 8,995,919 415,611,458<br />
70,262,701 3,246,136,787<br />
370,349,063 17,110,126,731<br />
Less current portion 40,319,559 1,862,763,608<br />
US$330,029,504 P=15,247,363,123<br />
ECA Loans<br />
In 2005 <strong>and</strong> 2006, the Group entered into ECA-backed loan facilities to partially finance the<br />
purchase of ten <strong>Air</strong>bus A319 aircraft. The security trustee of the ECA loans established CALL, a<br />
special purpose company, which purchased the aircraft from the supplier <strong>and</strong> leases such aircraft<br />
to the Parent Company pursuant to twelve-year finance lease agreements. The quarterly rental<br />
payments made by the Parent Company to CALL correspond to the principal <strong>and</strong> interest<br />
payments made by CALL to the ECA-backed lenders. The quarterly lease rentals to CALL are<br />
guaranteed by CPAHI <strong>and</strong> JGSHI. The Parent Company has the option to purchase the aircraft for<br />
a nominal amount at the end of such leases.<br />
In 2008, the Group entered into ECA-backed loan facilities to partially finance the purchase of six<br />
ATR 72-500 turboprop aircraft. The security trustee of the ECA loans established BLL, a special<br />
purpose company, which purchased the aircraft from the supplier <strong>and</strong> leases such aircraft to the<br />
Parent Company pursuant to ten-year finance lease agreements. The semi-annual rental payments<br />
made by the Parent Company to BLL corresponds to the principal <strong>and</strong> interest payments made by<br />
BLL to the ECA-backed lenders. The semi-annual lease rentals to BLL are guaranteed by JGSHI.<br />
The Parent Company has the option to purchase the aircraft for a nominal amount at the end of<br />
such leases.<br />
In 2009, the Group entered into ECA-backed loan facilities to fully finance the purchase of two<br />
ATR 72-500 turboprop aircraft. The security trustee of the ECA loans established SLL, a special<br />
purpose company, which purchased the aircraft from the supplier <strong>and</strong> leases such aircraft to the<br />
Parent Company pursuant to ten-year finance lease agreements. The semi-annual rental payments<br />
made by the Parent Company to SLL corresponds to the principal <strong>and</strong> interest payments made by<br />
SLL to the ECA-backed lenders. The semi-annual lease rentals to SLL are guaranteed by JGSHI.<br />
The Parent Company has the option to purchase the aircraft for a nominal amount at the end of<br />
such leases.<br />
In 2010, the Group entered into ECA-backed loan facilities to fully finance the purchase of three<br />
<strong>Air</strong>bus A320 aircraft. The security trustee of the ECA loans established SALL, a special purpose<br />
company, which purchased the aircraft from the supplier <strong>and</strong> leases such aircraft to the Parent<br />
Company pursuant to twelve-year finance lease agreements. The quarterly rental payments made<br />
by the Parent Company to SALL corresponds to the principal <strong>and</strong> interest payments made by<br />
SALL to the ECA-backed lenders. The quarterly lease rentals to SALL are guaranteed by JGSHI.<br />
The Parent Company has the option to purchase the aircraft for a nominal amount at the end of<br />
such leases.<br />
*SGVMC115503*
- 54 -<br />
The terms of the ECA-backed facilities, which are the same for each of the ten <strong>Air</strong>bus A319<br />
aircraft, eight ATR 72-500 turboprop aircraft <strong>and</strong> three <strong>Air</strong>bus A320 aircraft, follow:<br />
• Term of 12 years starting from the delivery date of each <strong>Air</strong>bus A319 aircraft <strong>and</strong> <strong>Air</strong>bus<br />
A320, <strong>and</strong> ten years for each ATR 72-500 turboprop aircraft.<br />
• Annuity style principal repayments for the first four <strong>Air</strong>bus A319 aircraft, eight<br />
ATR 72-500 turboprop aircraft <strong>and</strong> three <strong>Air</strong>bus A320 aircraft, <strong>and</strong> equal principal<br />
repayments for the last six <strong>Air</strong>bus A319 aircraft. Principal repayments shall be made on a<br />
semi-annual basis for ATR 72-500 turboprop aircraft. Principal repayments shall be made on<br />
a quarterly basis for <strong>Air</strong>bus A319 <strong>and</strong> A320 aircraft.<br />
• Interest on loans from the ECA lenders related to CALL <strong>and</strong> BLL shall be at fixed rates,<br />
which range from 3.78% to 5.83% in 2010, 2009 <strong>and</strong> 2008. Interest on loans from ECA<br />
lenders related to SLL shall be fixed at 3.37% for one aircraft <strong>and</strong> US dollar LIBOR 6 months<br />
plus margin for the other aircraft. Interest on loans from the ECA lenders related to SALL for<br />
the three <strong>Air</strong>bus A320 aircraft shall be US dollar LIBOR 3 months plus margin.<br />
• As provided under the ECA-backed facility, CALL, BLL, SLL <strong>and</strong> SALL cannot create or<br />
allow to exist any security interest, other than what is permitted by the transaction documents<br />
or the ECA administrative parties. CALL, BLL, SLL <strong>and</strong> SALL must not allow impairment<br />
of first priority nature of the lenders’ security interests.<br />
• The ECA-backed facilities also provide for the following events of default: (a) nonpayment of<br />
the loan principal or interest or any other amount payable on the due date, (b) breach of<br />
negative pledge, covenant on preservation of transaction documents, (c) misrepresentation,<br />
(d) commencement of insolvency proceedings against CALL or BLL or SLL or SALL or<br />
CALL or BLL or SLL or SALL becomes insolvent, (e) failure to discharge any attachment or<br />
sequestration order against CALL’s, BLL’s, SLL’s <strong>and</strong> SALL’s assets, (f) entering into an<br />
undervalued transaction, obtaining preference or giving preference to any person, contrary to<br />
the laws of the Cayman Isl<strong>and</strong>s, (g) sale of any aircraft under ECA financing prior to<br />
discharge date, (h) cessation of business, (i) revocation or repudiation by CALL or BLL or<br />
SLL or SALL, the Group, JGSHI or CPAHI of any transaction document or security interest,<br />
<strong>and</strong> (j) occurrence of an event of default under the lease agreement with the Parent Company.<br />
• Upon default, the outst<strong>and</strong>ing amount of loan will be payable, including interest accrued.<br />
Also, the ECA lenders will foreclose on secured assets, namely the aircraft.<br />
• An event of default under any ECA loan agreement will occur if an event of default as<br />
enumerated above occurs under any other ECA loan agreement.<br />
On November 30, 2010, the Parent Company pre-terminated the lease agreement with BLL.<br />
The outst<strong>and</strong>ing balance of the related loans <strong>and</strong> accrued interests amounting to P=638.1 million<br />
(US$14.5 million) <strong>and</strong> P=13.0 million (US$0.3 million), respectively, were also pre-terminated.<br />
The proceeds from the insurance claim on the related aircraft were used to settle the loan <strong>and</strong><br />
accrued interest. JGSHI was released as guarantor on the related loans.<br />
As of December 31, 2010 <strong>and</strong> 2009, the total outst<strong>and</strong>ing balance of the ECA loans amounted to<br />
P=15.8 billion (US$360.0 million) <strong>and</strong> P=13.9 billion (US$300.1 million), respectively. Interest<br />
expense amounted to P=623.4 million, P=732.8 million <strong>and</strong> P=614.6 million in 2010, 2009 <strong>and</strong> 2008,<br />
respectively.<br />
*SGVMC115503*
- 55 -<br />
Commercial Loans from Foreign Banks<br />
In 2007, the Group entered into a commercial loan facility to partially finance the purchase of<br />
two <strong>Air</strong>bus A320 aircraft, one CFM 565B4/P engine, two CFM 565B5/P engines <strong>and</strong> one QEC<br />
Kit. The security trustee of the commercial loan facility established ILL, a special purpose<br />
company, which purchased the aircraft from the supplier <strong>and</strong> leases such aircraft to the Parent<br />
Company pursuant to (a) ten-year finance lease arrangement for the aircraft, (b) six-year finance<br />
lease arrangement for the engines <strong>and</strong> (c) five-year finance lease arrangement for the QEC Kit.<br />
The quarterly rental payments of the Parent Company correspond to the principal <strong>and</strong> interest<br />
payments made by ILL to the commercial lenders <strong>and</strong> are guaranteed by JGSHI. The Parent<br />
Company has the option to purchase the aircraft, the engines <strong>and</strong> the QEC Kit for a nominal<br />
amount at the end of such leases.<br />
In 2008, the Group also entered into a commercial loan facility, in addition to ECA-backed loan<br />
facility, to partially finance the purchase of six ATR 72-500 turboprop aircraft. The security<br />
trustee of the commercial loan facility established BLL, a special purpose company, which<br />
purchased the aircraft from the supplier <strong>and</strong> leases such aircraft to the Parent Company. The<br />
commercial loan facility is payable in 12 equal, consecutive, semi-annual installments starting six<br />
months after the utilization date.<br />
The terms of the commercial loans from foreign banks follow:<br />
• Term of ten years starting from the delivery date of each <strong>Air</strong>bus A320 aircraft.<br />
• Terms of six <strong>and</strong> five years for the engines <strong>and</strong> QEC Kit, respectively.<br />
• Term of six years starting from the delivery date of each ATR 72-500 turboprop aircraft.<br />
• Annuity style principal repayments for the two <strong>Air</strong>bus A320 aircraft <strong>and</strong> six ATR 72-500<br />
turboprop aircraft, <strong>and</strong> equal principal repayments for the engines <strong>and</strong> the QEC Kit. Principal<br />
repayments shall be made on a quarterly <strong>and</strong> semi-annual basis for the two <strong>Air</strong>bus A320<br />
aircraft, engines <strong>and</strong> the QEC Kit <strong>and</strong> six ATR 72-500 turboprop aircraft, respectively.<br />
• Interest on the commercial loan facility for the two <strong>Air</strong>bus A320 aircraft shall be<br />
US dollar LIBOR 3 months plus margin. On February 29, 2009, the interest rates on the two<br />
<strong>Air</strong>bus A320 aircraft, engines <strong>and</strong> QEC Kit were fixed ranging from 4.11% to 5.67%.<br />
• Interest on the commercial loan facility for the six ATR 72-500 turboprop aircraft shall be<br />
US dollar LIBOR 6 months plus margin.<br />
• The commercial loan facility provides for material breach as an event of default.<br />
• Upon default, the outst<strong>and</strong>ing amount of loan will be payable, including interest accrued.<br />
The lenders will foreclose on secured assets, namely the aircraft.<br />
As of December 31, 2010 <strong>and</strong> 2009, the total outst<strong>and</strong>ing balance of the commercial loans from<br />
foreign banks amounted to P=2.7 billion (US$60.5 million) <strong>and</strong> P=3.2 billion (US$70.3 million),<br />
respectively. Interest expense amounted to P=137.7 million, P=173.1 million <strong>and</strong> P=157.8 million in<br />
2010, 2009 <strong>and</strong> 2008, respectively.<br />
*SGVMC115503*
- 56 -<br />
17. Other Noncurrent Liabilities<br />
This account consists of:<br />
2010 2009<br />
ARO P=2,070,145,159 P=1,194,091,048<br />
Accrued maintenance 923,451,428 910,665,374<br />
Pension liability (Note 22) 210,156,100 172,317,200<br />
P=3,203,752,687 P=2,277,073,622<br />
ARO<br />
The Group is legally required under certain lease contracts to restore certain leased passenger<br />
aircraft to stipulated return conditions <strong>and</strong> to bear the costs of restoration at the end of the contract<br />
period. These costs are accrued based on an internal estimate made by the work of both third<br />
party <strong>and</strong> the Group’s engineers in 2007, which includes estimates of certain redelivery costs at<br />
the end of the operating aircraft lease (see Note 3).<br />
In 2010, the Group employed third party professionals to reevaluate the Group’s estimates on<br />
ARO. In relation to this, the Group recorded additional ARO asset <strong>and</strong> liability amounting to<br />
P=705.7 million.<br />
The rollforward analysis of the Group’s ARO follows:<br />
2010 2009<br />
Balance at beginning of year<br />
P=1,194,091,048 P=1,258,139,119<br />
Additional provision for the year* 705,651,245 –<br />
Accretion expense** 170,402,866 106,955,190<br />
Capitalized during the year*** – 211,006,826<br />
Payment of restorations during the year – (382,010,087)<br />
Balance at end of year<br />
P=2,070,145,159 P=1,194,091,048<br />
*Related to the change in accounting estimates for the recognized ARO liability<br />
**Included under interest expense account in the consolidated statements of comprehensive income<br />
***Related to recognized ARO liability for two additional <strong>Air</strong>bus A320 aircraft under operating lease agreements entered in<br />
2009<br />
Accrued Maintenance<br />
This account pertains to accrual of maintenance costs of aircraft based on the number of flying<br />
hours but will be settled beyond one year based on management’s assessment.<br />
18. Equity<br />
The details of the Parent Company’s common stock follow:<br />
2010 2009 2008<br />
Beginning of year P=582,574,750 P=582,574,750 P=335,000,000<br />
Issuance of stock dividends – – 112,000,000<br />
Issuance of shares during the year 30,661,800 – 135,574,750<br />
End of year P=613,236,550 P=582,574,750 P=582,574,750<br />
*SGVMC115503*
- 57 -<br />
The Parent Company has 1.34 billion authorized shares at P=1.00 par value per share. As of<br />
December 31, 2010 <strong>and</strong> 2009, all of the Parent Company’s issued common stocks are outst<strong>and</strong>ing.<br />
Capital Management<br />
The primary objective of the Group’s capital management is to ensure that it maintains healthy<br />
capital ratios in order to support its business <strong>and</strong> maximize shareholder value. The Group<br />
manages its capital structure, which composed of paid up capital <strong>and</strong> retained earnings, <strong>and</strong> makes<br />
adjustments to these ratios in light of changes in economic conditions <strong>and</strong> the risk characteristics<br />
of its activities. In order to maintain or adjust the capital structure, the Group may adjust the<br />
amount of dividend payment to shareholders, return capital structure or issue capital securities.<br />
No changes have been made in the objective, policies <strong>and</strong> processes as they have been applied in<br />
previous years.<br />
The Group’s debt-to-capital ratios follow:<br />
2010 2009<br />
(a) Long term debt (Note 16)<br />
P=18,432,708,704 P=17,110,126,731<br />
(b) Capital 17,907,049,902 7,254,961,854<br />
(c) Debt-to-capital ratio (a/b) 1.0:1 2.4:1<br />
The JGSHI Group’s policy is to keep the debt to capital ratio at the 2:1 level as of<br />
December 31, 2010 <strong>and</strong> 2009. Such ratio is currently being managed on a group level by the<br />
Group’s ultimate parent.<br />
Appropriation of Retained Earnings<br />
On May 21, 2007, the Parent Company’s BOD appropriated P=300.0 million from its unrestricted<br />
retained earnings as of December 31, 2006 for purposes of the Parent Company’s re-fleeting<br />
program. The BOD approved further the appropriation of P=2.7 billion from its unrestricted<br />
retained earnings as of December 31, 2007. The appropriation will be used for purposes of the<br />
Group’s re-fleeting <strong>and</strong> expansion programs, <strong>and</strong> settlement of certain maturing loans.<br />
On March 4, 2008, the Parent Company’s BOD approved the additional appropriation of<br />
P=1.0 billion from its unrestricted retained earnings as of December 31, 2007 for the same purpose.<br />
Subsequently on September 22, 2008, the Parent Company’s BOD <strong>and</strong> stockholders approved the<br />
reversal of the total appropriated retained earnings of P=4.0 billion <strong>and</strong> such amount was made part<br />
of the unrestricted retained earnings.<br />
Issuance of Common Shares of Stock<br />
On October 26, 2010, the Parent Company listed with the PSE its common stock, wherein it<br />
offered 212,419,700 shares to the public at P=125.00 per share. Of the total shares sold, 30,661,800<br />
shares are newly issued shares with total proceeds amounting to P=3.8 billion. The Parent<br />
Company incurred transaction costs incidental to the IPO amounting to P=100.4 million, which is<br />
charged against ‘Capital paid in excess of par value’ in the consolidated statement of financial<br />
position.<br />
*SGVMC115503*
- 58 -<br />
19. Ancillary Revenue<br />
Ancillary revenue consists of:<br />
2010 2009 2008<br />
Excess baggage fees P=778,395,570 P=733,642,196 P=465,318,108<br />
Rebooking, refunds <strong>and</strong> cancellation fees 423,397,044 690,763,508 344,043,895<br />
Others 1,135,315,885 697,841,275 429,857,087<br />
P=2,337,108,499 P=2,122,246,979 P=1,239,219,090<br />
Others pertain to revenues from in-flight sales <strong>and</strong> services provided through reservation system<br />
such as advance seat selection, website administration as well as commissions.<br />
20. Operating Expenses<br />
Flying Operations<br />
Flying operations consists of:<br />
2010 2009 2008<br />
Aviation fuel expense<br />
P=9,807,825,079 P=7,360,258,422 P=8,502,271,999<br />
Flight deck 1,365,724,876 1,171,174,972 877,482,118<br />
<strong>Air</strong>craft insurance 152,573,085 146,903,306 123,828,503<br />
Others 91,365,472 178,678,223 104,123,356<br />
P=11,417,488,512 P=8,857,014,923 P=9,607,705,976<br />
<strong>Air</strong>craft <strong>and</strong> Traffic Servicing<br />
<strong>Air</strong>craft <strong>and</strong> traffic servicing consists of:<br />
2010 2009 2008<br />
<strong>Air</strong>port charges<br />
P=1,405,341,791 P=1,625,449,978 P=1,159,209,189<br />
Ground h<strong>and</strong>ling 758,912,700 768,108,059 583,514,333<br />
Others 297,552,706 238,275,212 204,186,956<br />
P=2,461,807,197 P=2,631,833,249 P=1,946,910,478<br />
Repairs <strong>and</strong> maintenance<br />
Repairs <strong>and</strong> maintenance expenses relate to the cost of maintaining, repairing <strong>and</strong> overhauling of<br />
all aircraft <strong>and</strong> engines, technical h<strong>and</strong>ling fees on pre-flight inspections <strong>and</strong> cost of aircraft spare<br />
parts <strong>and</strong> other related equipment.<br />
21. General <strong>and</strong> Administrative Expenses<br />
This account consists of staff-related expenses, provision for credit losses on receivables (Note 9),<br />
travel <strong>and</strong> transportation, rent, non-aircraft repairs <strong>and</strong> maintenance, utilities <strong>and</strong> insurance.<br />
*SGVMC115503*
- 59 -<br />
22. Employee Benefits<br />
Employee Benefit Cost<br />
Total personnel expenses, consisting of salaries, expense related to defined benefit plans <strong>and</strong> other<br />
employee benefits, are included in flying operations, aircraft traffic <strong>and</strong> servicing, repairs <strong>and</strong><br />
maintenance, reservation <strong>and</strong> sales, general <strong>and</strong> administrative, <strong>and</strong> passenger service.<br />
Defined Benefit Plan<br />
The Parent Company has an unfunded, noncontributory, defined benefit plan covering<br />
substantially all of its regular employees. The benefits are based on years of service <strong>and</strong><br />
compensation on the last year of employment.<br />
As of January 1, 2010, 2009 <strong>and</strong> 2008, the assumptions used to determine pension benefits of the<br />
Parent Company follow:<br />
2010 2009 2008<br />
Average remaining working life 10 years 9 years 9 years<br />
Discount rate 9.93% 13.49% 10.22%<br />
Salary rate increase 5.50% 5.50% 7.00%<br />
As of December 31, 2010, 2009 <strong>and</strong> 2008, the discount rate used in determining the pension<br />
liability is 8.65%, 9.93% <strong>and</strong> 13.49%, which is determined by reference to market yields at the<br />
statement of financial position date on Philippine government bonds.<br />
The amounts recognized as pension liability (included under ‘Other noncurrent liabilities’ account<br />
in the consolidated statements of financial position) follow (Note 17):<br />
2010 2009<br />
Present value of defined benefit obligation (PVO) P=230,193,900 P=160,237,500<br />
Unrecognized actuarial gain (loss) (20,037,800) 12,079,700<br />
Pension liability at end of year P=210,156,100 P=172,317,200<br />
Movements in unrecognized actuarial gain (loss) follow:<br />
2010 2009<br />
Balance at beginning of year P=12,079,700 P=62,577,400<br />
Amortization of actuarial gain – (5,937,300)<br />
Actuarial loss due to PVO (32,117,500) (44,560,400)<br />
Balance at end of year (P=20,037,800) P=12,079,700<br />
Movements in the defined benefit liability follow:<br />
2010 2009<br />
Balance at beginning of year P=172,317,200 P=153,990,700<br />
Pension expense during year 40,229,800 19,261,800<br />
Benefits paid during year (2,390,900) (935,300)<br />
Balance at end of year P=210,156,100 P=172,317,200<br />
*SGVMC115503*
- 60 -<br />
Components of pension expense included in the consolidated statements of comprehensive income<br />
follow:<br />
2010 2009 2008<br />
Current service cost P=24,318,200 P=12,867,400 P=14,592,600<br />
Interest cost 15,911,600 12,331,700 10,337,000<br />
Past service cost – – 12,384,600<br />
Amortization of actuarial gain – (5,937,300) (672,500)<br />
Total pension expense P=40,229,800 P=19,261,800 P=36,641,700<br />
Changes in the present value of the defined benefit obligation follow:<br />
2010 2009<br />
Balance at beginning of year P=160,237,500 P=91,413,300<br />
Current service cost 24,318,200 12,867,400<br />
Interest cost 15,911,600 12,331,700<br />
Benefits paid (2,390,900) (935,300)<br />
Actuarial loss 32,117,500 44,560,400<br />
Balance at end of year P=230,193,900 P=160,237,500<br />
Amounts for the current <strong>and</strong> previous periods follow:<br />
2010 2009 2008 2007 2006<br />
Present value of retirement<br />
obligation P=230,193,900 P=160,237,500 P=91,413,300 P=101,178,300 P=124,264,500<br />
Experience adjustments –<br />
(gain)/loss (1,435,700) 1,445,500 1,199,000 (10,200,000) (13,402,800)<br />
23. Other Expenses<br />
This account consists mainly of bank charges.<br />
24. Income Taxes<br />
Provision for (benefit from) income tax consists of:<br />
2010 2009 2008<br />
Current:<br />
MCIT P=1,595,963 P=4,585,763 P=–<br />
Deferred 16,163,724 (24,087,446) 77,321,481<br />
P=17,759,687 (P=19,501,683) P=77,321,481<br />
Provision for income tax pertains to RCIT or minimum corporate income tax (MCIT) <strong>and</strong><br />
deferred income tax.<br />
*SGVMC115503*
- 61 -<br />
Income taxes include corporate income tax, as discussed below, <strong>and</strong> final taxes paid at the rate of<br />
20.00% <strong>and</strong> 7.50% on peso-denominated <strong>and</strong> foreign currency-denominated short-term<br />
placements <strong>and</strong> cash in banks, respectively, which are final withholding taxes on gross interest<br />
income.<br />
Effective November 1, 2005, RA No. 9337, an act amending the National Internal Revenue Code<br />
(NIRC of 1997), provides that the RCIT rate shall be 35.00% until January 1, 2009. Starting<br />
January 1, 2009 the RCIT rate shall be 30.00%. Interest allowed as a deductible expense is<br />
reduced by an amount equivalent to 42.00% of interest income subjected to final tax starting<br />
November 1, 2005 until December 31, 2008. Starting January 1, 2009, interest allowed as<br />
deductible expense shall be reduced by 33.00% of interest income subjected to final tax.<br />
The NIRC of 1997 also provides for rules on the imposition of a 2.00% MCIT on the gross<br />
income as of the end of the taxable year beginning on the fourth taxable year immediately<br />
following the taxable year in which the Parent Company commenced its business operations.<br />
Any excess MCIT over the RCIT can be carried forward on an annual basis <strong>and</strong> credited against<br />
the RCIT for the three immediately succeeding taxable years.<br />
In addition, the NIRC of 1997 allows the Parent Company to deduct from its taxable income for<br />
the current year its accumulated net operating losses carried over (NOLCO) from the immediately<br />
preceding three consecutive taxable years.<br />
Details of the Parent Company’s NOLCO <strong>and</strong> MCIT are as follows:<br />
NOLCO<br />
MCIT<br />
Year Incurred Amount Expired Balance Expiry Year<br />
2008 P=81,434,888 P=– P=81,434,888 2011<br />
2009 79,186,012 – 79,186,012 2012<br />
2010 533,255,953 – 533,255,953 2013<br />
P=693,876,853 P=– P=693,876,853<br />
Year Incurred Amount Expired Balance Expiry Year<br />
2009 P=4,585,763 P=– P=4,585,763 2012<br />
2010 1,595,963 – 1,595,963 2013<br />
P=6,181,726 P=– P=6,181,726<br />
The Parent Company has the following registrations with the BOI as a new operator of air<br />
transport on a non-pioneer status under the Omnibus Investments Code of 1987 (Executive<br />
Order 226):<br />
Batch Date of Registration<br />
Registration<br />
Number ITH Period<br />
Number of<br />
<strong>Air</strong>craft<br />
First December 14, 2005 2005-213 2007-2010 20<br />
Second June 4, 2008 2008-119 2010-2013 8<br />
Third November 3,2010 2010-180 2011-2016 3<br />
31<br />
*SGVMC115503*
- 62 -<br />
On the above registrations, the Parent Company can avail of bonus years in certain specified cases<br />
but the aggregate ITH availment (basic <strong>and</strong> bonus years) shall not exceed eight years.<br />
As of December 31, 2010, the Parent Company has complied with externally imposed capital<br />
requirements set by the BOI in order to avail the ITH incentives for the first <strong>and</strong> second batch<br />
aircraft of registered activity (Note 1).<br />
The components of the Group’s deferred tax assets <strong>and</strong> liabilities follow:<br />
2010 2009<br />
Deferred tax assets on:<br />
ARO - liability P=621,043,542 P=358,227,314<br />
NOLCO 208,163,056 48,186,270<br />
Allowance for impairment losses on<br />
receivables 69,775,242 73,655,043<br />
Unrealized foreign exchange loss 56,819,216 –<br />
Accrued retirement costs 63,046,830 51,695,160<br />
MCIT 6,181,726 4,585,763<br />
Unrealized loss on AFS investment* 1,163,530 –<br />
1,026,193,142 536,349,550<br />
Deferred tax liabilities on:<br />
Unrealized foreign exchange gain 586,658,102 369,252,479<br />
ARO - asset 248,190,060 110,720,283<br />
Double depreciation 194,506,665 194,506,665<br />
Unrealized gain on derivative asset 117,679,009 –<br />
Unrealized gain on financial assets designated<br />
at FVPL 32,289,377 –<br />
1,179,323,213 674,479,427<br />
Net deferred tax liabilities P=153,130,071 P=138,129,877<br />
* Movement under other comprehensive income (loss)<br />
The Group’s recognized deferred tax assets <strong>and</strong> deferred tax liabilities are expected to be reversed<br />
more than twelve months after the statement of financial position date.<br />
The Group has the following gross deductible <strong>and</strong> taxable temporary differences which are<br />
expected to reverse within the ITH period, <strong>and</strong> for which deferred tax assets <strong>and</strong> deferred tax<br />
liabilities, respectively, were not set up on account of the Parent Company’s ITH.<br />
2010 2009<br />
Deductible temporary differences:<br />
Accrued expenses P=297,646,860 P=24,081,919<br />
Taxable temporary differences:<br />
ARO - asset P=307,286,348 294,671,234<br />
Derivative asset 97,654,104 227,794,364<br />
Foreign exchange gain - net – 209,902,587<br />
P=404,940,452 P=732,368,185<br />
*SGVMC115503*
- 63 -<br />
A reconciliation of the statutory income tax rate to the effective income tax rate follows:<br />
2010 2009 2008<br />
Statutory income tax rate 30.00% 30.00% 35.00%<br />
Adjustments resulting from:<br />
Income subject to ITH (29.71) (27.33) 5.03<br />
Interest income subjected to final tax (0.49) (0.08) 0.01<br />
Unrecognized deferred tax<br />
assets <strong>and</strong> liabilities 0.41 (3.46) (37.62)<br />
Nondeductible items 0.16 0.03 –<br />
Equity in net (income ) loss of JV (0.11) 0.24 0.15<br />
Effect of change in income tax rates – – (5.00)<br />
Effective income tax rate 0.26% (0.60%) (2.43%)<br />
Entertainment, Amusement <strong>and</strong> Recreation (EAR) Expenses<br />
Current tax regulations define expenses to be classified as EAR expenses <strong>and</strong> set a limit for the<br />
amount that is deductible for tax purposes. EAR expenses are limited to 0.50% of net sales for<br />
sellers of goods or properties or 1.00% of net revenue for sellers of services. For sellers of both<br />
goods or properties <strong>and</strong> services, an apportionment formula is used in determining the ceiling on<br />
such expenses. The Parent Company recognized EAR expenses (allocated under different expense<br />
accounts in the consolidated statements of comprehensive income) amounting to P=4.8 million,<br />
P=12.7 million, <strong>and</strong> P=10.7 million in 2010, 2009 <strong>and</strong> 2008, respectively.<br />
25. Earnings Per Share<br />
The following reflects the income <strong>and</strong> share data used in the basic/dilutive EPS computations:<br />
2010 2009 2008<br />
(a) Net income (loss) attributable to common<br />
shareholders<br />
P=6,922,493,280 P=3,257,848,705 (P=3,259,888,005)<br />
(b) Weighted average number of common<br />
shares for basic EPS 587,685,050 582,574,750 458,297,986<br />
(c) Basic/diluted earnings (loss) per share P=11.78 P=5.59 (P=7.11)<br />
The Group has no dilutive potential common shares in 2010, 2009 <strong>and</strong> 2008.<br />
26. Related Party Transactions<br />
The Group has entered into transactions with its ultimate parent, its JV <strong>and</strong> affiliates principally<br />
consisting of advances, sale of passenger tickets, reimbursement of expenses, regular banking<br />
transactions, maintenance <strong>and</strong> administrative service agreements. In addition to the related<br />
information disclosed elsewhere in the financial statements, the following are the year-end<br />
balances in respect of transactions with related parties, which were carried out in the normal<br />
course of business on terms agreed with related parties during the year.<br />
*SGVMC115503*
- 64 -<br />
The significant transactions <strong>and</strong> outst<strong>and</strong>ing balances of the Group with the related parties follow.<br />
Consolidated Statement of Financial Position<br />
Due to<br />
Due from Related<br />
Related Parties Parties<br />
Cash <strong>and</strong> Cash<br />
Equivalents<br />
Trade<br />
Receivables<br />
Trade<br />
Payables<br />
Ultimate parent company<br />
JGSHI December 31, 2010 P=– P=– P=350,000 P=– P=–<br />
December 31, 2009 – – 42,357,610 – P=6,200<br />
CPAHI December 31, 2010 – 58,814,274 – – –<br />
December 31, 2009 – 900,670 – – –<br />
JV in which the Parent<br />
Company is a venturer<br />
A-plus December 31, 2010 – 26,929,793 – – 71,153,167<br />
December 31, 2009 – 35,416,334 – – 11,647,754<br />
SIAEP December 31, 2010 – 832,407 – – –<br />
December 31, 2009 – 4,072,597 – – –<br />
Other related parties<br />
Robinsons Savings December 31, 2010 4,552,678,192 – 858,368 5,631 150,859<br />
Bank (RSB) December 31, 2009 225,301,492 – 563,510 48,544 511,746<br />
Universal Robina December 31, 2010 – – 33,709,732 2,183,937 6,241,941<br />
Corporation (URC) December 31, 2009 – – 30,666,495 1,809,752 2,157,837<br />
Digitel Telecommunication December 31, 2010 – – – 1,671,261 –<br />
(DIGITEL) December 31, 2009 – – – 1,964,812 241,740<br />
Robinsons L<strong>and</strong> December 31, 2010 – – – 281,841 21,113<br />
Corporation (RLC) December 31, 2009 – – 129,142 314,339 315,858<br />
Summit Publishing, December 31, 2010 – – – 855,930 –<br />
Inc. (SPI) December 31, 2009 – – – 630,178 –<br />
JG Petrochemical December 31, 2010 – – – 263,484 –<br />
Corporation (JGPC) December 31, 2009 – – – 3,396 –<br />
Robinsons Inc. December 31, 2010 – – 611,204 1,131,598 3,677,235<br />
December 31, 2009 – – – 500,914 –<br />
Unicon Insurance Brokers December 31, 2010 – – – – 3,512<br />
December 31, 2009 – – – – –<br />
Total December 31, 2010 P=4,552,678,192 P=86,576,474 P=35,529,304 P=6,393,682 P=81,247,827<br />
December 31, 2009 P=225,301,492 P=40,389,601 P=73,716,757 P=5,271,935 P=14,881,135<br />
*SGVMC115503*
- 65 -<br />
Consolidated Statement of Comprehensive Income<br />
Sale of <strong>Air</strong><br />
Year Transportation Service Interest Income Repairs <strong>and</strong> Maintenance<br />
JV in which the Parent<br />
Company is a venturer<br />
A-plus 2010 P=– P=– P=259,226,381<br />
2009 – – 260,736,827<br />
2008 – – 178,272,202<br />
SIAEP 2010 263,606 – –<br />
2009 – – 4,053,972<br />
2008 – – –<br />
Other related parties<br />
RSB 2010 715,413 28,960,516 –<br />
2009 692,339 240,915 –<br />
2008 – 10,890 –<br />
URC 2010 23,185,728 – –<br />
2009 21,576,590 – –<br />
2008 17,997,037 – –<br />
DIGITEL 2010 15,921,059 – –<br />
2009 11,499,788 – –<br />
2008 10,196,168 – –<br />
RLC 2010 6,035,538 – –<br />
2009 7,723,286 – –<br />
2008 2,566,877 – –<br />
SPI 2010 2,484,213 – –<br />
2009 2,026,424 – –<br />
2008 841,467 – –<br />
JGPC 2010 830,006 – –<br />
2009 40,398 – –<br />
2008 146,366 – –<br />
Robinsons Inc. 2010 11,592,290 – –<br />
2009 – – –<br />
2008 – – –<br />
Total 2010 P=61,027,853 P=28,960,516 P=259,226,381<br />
2009 P=43,558,825 P=240,915 P=264,790,799<br />
2008 P=31,747,915 P=10,890 P=178,272,202<br />
*Other related parties pertain to entities which are subsidiaries of JGSHI <strong>and</strong> therefore, entities under common control.<br />
There are no impairment losses recorded against outst<strong>and</strong>ing balances with related parties as of<br />
December 31, 2010, 2009 <strong>and</strong> 2008. Also, these transactions are unsecured, interest-free <strong>and</strong><br />
short-term in nature.<br />
The Group’s significant transactions with related parties follow:<br />
1. In 2010 <strong>and</strong> 2009, the Group provides non interest-bearing advances to JGSHI recorded as<br />
‘Due from related parties’. In 2010, total advances made to JGSHI amounted to P=3.7 billion,<br />
which was settled on June 30, 2010 by assigning debt <strong>and</strong> equity securities amounting to<br />
P=3.7 billion (Note 28). In 2009, total advances made to JGSHI amounted to P=1.8 billion,<br />
which were settled in the same year.<br />
*SGVMC115503*
- 66 -<br />
2. Expenses advanced by the Group on behalf of CPAHI. The said expenses are subject to<br />
reimbursement <strong>and</strong> are recorded under ‘Receivables’ in the consolidated statements of<br />
financial position.<br />
3. The Group entered into a Shared Services Agreement with A-plus. Under the aforementioned<br />
agreement, the Group will render certain administrative services to A-plus which include<br />
payroll processing <strong>and</strong> certain information technology-related functions. The Group also<br />
entered into a Ground Support Equipment (GSE) Maintenance Services Agreement with<br />
A-plus. Under the GSE Maintenance Services Agreement, the Group shall render routine<br />
preventive maintenance services on certain ground support equipment used by A-plus in<br />
providing technical GSE to airline operators in major airports in the Philippines. The Group<br />
also performs repair or rectification of deficiencies noted <strong>and</strong> supply replacement components.<br />
4. For the aircraft maintenance program, the Group engaged SIAEC to render line maintenance,<br />
light aircraft checks <strong>and</strong> technical ramp h<strong>and</strong>ling services at various domestic <strong>and</strong><br />
international airports which were performed by A-plus, <strong>and</strong> to maintain <strong>and</strong> provide aircraft<br />
heavy maintenance services which was performed by SIAEP. Cost of services are recorded as<br />
‘Repairs <strong>and</strong> maintenance’ in the consolidated statements of comprehensive income <strong>and</strong> any<br />
unpaid amount as of statement of financial position date as trade payable under ‘Accounts<br />
payable <strong>and</strong> other accrued liabilities’.<br />
5. The Group maintains deposit accounts <strong>and</strong> short-term investments with RSB which is reported<br />
as ‘Cash <strong>and</strong> cash equivalents’. The Group also incurs liabilities to RSB for loan payments of<br />
its employees <strong>and</strong> to URC primarily for the rendering of payroll service to the Group which<br />
are recorded as ‘Due to related parties’.<br />
6. The Group provides air transportation services to certain related parties, for which unpaid<br />
amounts are recorded as trade receivables under ‘Receivables’ in the consolidated statements<br />
of financial position. The Group also purchases goods from URC for in-flight sales <strong>and</strong><br />
recorded as trade payable, if unpaid, in the consolidated statements of financial position.<br />
The compensation of the Group’s key management personnel by benefit type follows:<br />
2010 2009 2008<br />
Short-term employee benefits P=118,221,095 P=92,213,212 P=84,568,078<br />
Post-employment benefits 1,528,853 3,404,135 259,203<br />
P=119,749,948 P=95,617,347 P=84,827,281<br />
There are no agreements between the Group <strong>and</strong> any of its directors <strong>and</strong> key officers providing for<br />
benefits upon termination of employment, except for such benefits to which they may be entitled<br />
under the Group’s pension plans.<br />
*SGVMC115503*
- 67 -<br />
27. Commitments <strong>and</strong> Contingencies<br />
Operating <strong>Air</strong>craft Lease Commitments<br />
The Group entered into operating lease agreements with certain leasing companies which cover<br />
the following aircraft:<br />
A320 aircraft<br />
The following table summarizes the specific lease agreements on nine <strong>Air</strong>bus A320 aircraft:<br />
Date of Lease<br />
Agreement Original Lessors New Lessors No. of Units Lease Term<br />
December 23, 2004 CIT Aerospace International<br />
(CITAI)<br />
Wilmington Trust SP<br />
Services (Dublin)<br />
Limited*<br />
2 May 2005 - May 2012<br />
June 2005 - June 2012<br />
April 23, 2007 Celestial Aviation Trading 17 Inishcrean Leasing 1 October 2007 - October 2016<br />
Limited (CAT 17)<br />
Limited (Inishcrean)**<br />
May 29, 2007 CITAI – 4 March 2008 - March 2014<br />
April 2008 - April 2014<br />
May 2008 - May 2014<br />
October 2008 - October 2014<br />
March 14, 2008 Celestial Aviation Trading 19 GY Aviation Lease 2 January 2009 - January 2017<br />
Limited (CAT 19)<br />
0905 Co. Limited***<br />
* Effective November 21, 2008 for the first aircraft <strong>and</strong> December 9, 2008 for the second aircraft.<br />
** Effective June 24, 2009.<br />
*** Effective March 25, 2010.<br />
On March 14, 2008, the Group entered into an operating lease agreement with CAT 19 for the<br />
lease of two <strong>Air</strong>bus A320 aircraft, which were delivered in 2009. On the same date, the Group<br />
also entered into another lease agreement with Celestial Aviation Trading 23 Limited (CAT 23)<br />
for the lease of two additional <strong>Air</strong>bus A320 aircraft to be received in 2012. In November 2010,<br />
the Group signed an amendment to the operating lease agreements with CAT 23, advancing the<br />
delivery of the two <strong>Air</strong>bus A320 aircraft from 2012 to 2011.<br />
Lease agreements with CITAI, CAT 17 <strong>and</strong> CAT 19 were amended to effect the novation of lease<br />
rights by the original lessors to new lessors as allowed under the existing lease agreements.<br />
Boeing 757 aircraft<br />
On August 22, 2001, the Group entered into aircraft operating lease agreements with PALSI, Inc.<br />
(PALSI) <strong>and</strong> Pegasus Aviation IV, Inc. (Pegasus) for the lease of one B757-236 aircraft from<br />
each company. The respective lease terms are for a period of seven years. The delivery dates of<br />
the aircraft which were leased from Pegasus <strong>and</strong> PALSI were December 13, 2001 <strong>and</strong><br />
February 18, 2002, respectively. The lease agreements expired on December 13, 2008 <strong>and</strong><br />
February 18, 2009, <strong>and</strong> the two aircraft were returned to the lessors in June <strong>and</strong> October 2009.<br />
*SGVMC115503*
- 68 -<br />
Under the aforementioned aircraft lease agreements, the Group paid PALSI <strong>and</strong> Pegasus monthly<br />
maintenance expenses based on billing statements (included in ‘Accounts payable <strong>and</strong> other<br />
accrued liabilities’ account in the consolidated statements of financial position) throughout the<br />
lease term.<br />
On March 18, 2006, the Group entered into a sub-lease agreement with <strong>Air</strong> Slovakia for the sublease<br />
of the two B757-236 aircraft which were leased from PALSI <strong>and</strong> Pegasus. The sub-lease<br />
agreements were for a period of two years, which expired on February 18, 2009 <strong>and</strong><br />
December 13, 2008. Rent income earned (included in the consolidated statements of<br />
comprehensive income) under the aforementioned sub-lease agreement amounted to<br />
P=131.7 million <strong>and</strong> P=204.3 million in 2009 <strong>and</strong> 2008, respectively.<br />
Future minimum lease payments under the above-indicated operating aircraft leases follow:<br />
2010 2009 2008<br />
US dollar<br />
Philippine peso<br />
equivalent<br />
US dollar<br />
Philippine peso<br />
equivalent US dollar<br />
Philippine peso<br />
equivalent<br />
Within one year US$37,805,531 P=1,657,394,460 US$33,749,946 P=1,559,247,483 US$27,900,136 P=1,325,814,463<br />
After one year but not more<br />
than five years 113,948,252 4,995,491,378 118,485,725 5,474,040,499 97,286,394 4,623,049,443<br />
Over five years 8,408,350 368,622,089 25,541,362 1,180,010,948 35,857,829 1,703,964,034<br />
US$160,162,133 P=7,021,507,927 US$177,777,033 P=8,213,298,930 US$161,044,359 P=7,652,827,940<br />
Lease expenses relating to aircraft leases (included in ‘<strong>Air</strong>craft <strong>and</strong> engine lease’ account in the<br />
consolidated statements of comprehensive income) amounted to P=1.6 billion, P=1.7 billion <strong>and</strong><br />
P=1.1 billion in 2010, 2009 <strong>and</strong> 2008, respectively.<br />
Operating Non-<strong>Air</strong>craft Lease Commitments<br />
The Group has entered into various lease agreements for its hangar, office spaces, ticketing<br />
stations <strong>and</strong> certain equipment. These leases have remaining lease terms ranging from one to ten<br />
years. Certain leases include a clause to enable upward revision of the annual rental charge<br />
ranging from 5.00% to 10.00%.<br />
Future minimum lease payments under these noncancellable operating leases follow:<br />
2010 2009 2008<br />
Within one year P=101,622,518 P=92,283,350 P=76,145,138<br />
After one year but not more than<br />
five years 443,485,392 406,896,291 432,109,782<br />
Over five years 124,367,033 230,752,642 280,466,642<br />
P=669,474,943 P=729,932,283 P=788,721,562<br />
Lease expenses relating to both cancellable <strong>and</strong> non-cancellable non-aircraft leases (allocated<br />
under different expense accounts in the consolidated statements of comprehensive income)<br />
amounted to P=231.2 million, P=239.7 million <strong>and</strong> P=149.2 million in 2010, 2009 <strong>and</strong> 2008,<br />
respectively.<br />
*SGVMC115503*
- 69 -<br />
<strong>Air</strong>craft <strong>and</strong> Spare Engine Purchase Commitments<br />
As of December 31, 2009, the Group has existing commitments to purchase 15 additional new<br />
<strong>Air</strong>bus A320 aircraft, which are scheduled for delivery between 2010 <strong>and</strong> 2014, <strong>and</strong> one spare<br />
engine to be delivered in 2011. In 2010, the Group exercised its option to purchase five <strong>Air</strong>bus<br />
A320 aircraft <strong>and</strong> entered into a new commitment to purchase two <strong>Air</strong>bus A320 aircraft to be<br />
delivered between 2011 <strong>and</strong> 2014. As of December 31, 2010, the Group has existing<br />
commitments to purchase 22 new <strong>Air</strong>bus A320 aircraft, three of which were delivered on<br />
October 28, December 10 <strong>and</strong> December 22, 2010, respectively. The remaining 19 <strong>Air</strong>bus A320<br />
aircraft are scheduled to be delivered between 2011 <strong>and</strong> 2014, <strong>and</strong> one spare engine is to be<br />
delivered in 2011.<br />
Also in 2007, the Group has a commitment to purchase six ATR 72-500 turboprop aircraft <strong>and</strong> has<br />
exercised an option to purchase additional four ATR 72-500 turboprop aircraft. These turboprop<br />
aircraft will cater to destinations in the country’s smaller airports. The Group has taken delivery<br />
of the initial six aircraft in 2008 <strong>and</strong> the remaining two were received during the first quarter of<br />
2009. One ATR 72-500 turboprop aircraft is scheduled for delivery in March 2011. The Group<br />
terminated the purchase commitment for one ATR 72-500 turboprop aircraft.<br />
The above-indicated commitments relate to the Group’s re-fleeting <strong>and</strong> expansion programs.<br />
Capital Expenditure Commitments<br />
The Group’s capital expenditure commitments relate principally to the acquisition of aircraft fleet,<br />
aggregating to P=31.5 billion as of December 31, 2010.<br />
December 31, 2010<br />
Philippine peso<br />
US dollar equivalent<br />
Within one year US$153,097,113 P=6,711,777,434<br />
After one year but not more than<br />
five years 565,169,279 24,777,021,191<br />
US$718,266,392 P=31,488,798,625<br />
Contingencies<br />
The Group has pending suits <strong>and</strong> claims for sums of money against certain general sales agents<br />
which are either pending decision by the courts or being contested, the outcome of which are not<br />
presently determinable. The estimate of the probable costs for the resolution of these claims has<br />
been developed in consultation with outside counsel h<strong>and</strong>ling the defense in these matters <strong>and</strong> is<br />
based upon an analysis of potential results. The Group currently does not believe that these<br />
proceedings will have a material adverse effect on the Group’s financial position <strong>and</strong> results of<br />
operations.<br />
The Parent Company has a pending tax preassessment, the outcome of which is not presently<br />
determinable.<br />
*SGVMC115503*
- 70 -<br />
28. Supplemental Disclosures to the Consolidated Statements of Cash Flows<br />
The principal noncash activities of the Group were as follows:<br />
a. On June 30, 2010, JGSHI settled its payable to the Group through transfer of quoted debt <strong>and</strong><br />
equity securities amounting to P=3.7 billion <strong>and</strong> accrued interest receivable amounting<br />
to P=71.4 million. The transfer price was at fair value. These investments are classified by the<br />
Group as designated financial assets at FVPL <strong>and</strong> AFS investments amounting to P=3.5 billion<br />
<strong>and</strong> P=118.4 million, respectively (Notes 8 <strong>and</strong> 26).<br />
b. On February 28, 2010, the Group sold an engine for P=89.5 million with a book value of<br />
P=72.2 million to a third party maintenance service provider (buyer). The transaction was<br />
settled through direct offset against the Group’s US-dollar denominated liability to the buyer<br />
amounting to P=88.3 million.<br />
c. On December 31, 2010, the Group recognized a liability based on the schedule of pre-delivery<br />
payments amounting to P=286.0 million with a corresponding debit to ‘Construction-in<br />
progress’ account. The liability was paid on January 3, 2011.<br />
d. In 2010, the additions in ‘Passenger aircraft’ account include increase in ARO asset<br />
amounting to P=705.7 million due to change in accounting estimates. In 2009, the additions in<br />
‘Passenger aircraft’ account include capitalized ARO asset related to new operating lease<br />
agreements amounting to P=211.0 million (Note 17). The above capitalized ARO asset has<br />
corresponding recognition of ARO liability with the same amount.<br />
e. In 2010, the Group acquired three passenger aircraft by assuming direct liabilities (Notes 12<br />
<strong>and</strong> 16). This transaction is considered as a non-cash financing activity.<br />
Presentation of cash flows from financing activities<br />
Beginning 2010, cash flows arising from financing activities with related parties are reported on a<br />
net basis since turnover for cash receipts <strong>and</strong> payments for these items is quick, the amounts are<br />
large, <strong>and</strong> the maturities are short. The 2009 <strong>and</strong> 2008 cash flows presentation have been aligned<br />
with the 2010 cash flows presentation.<br />
29. Events After the Statement of Financial Position Date<br />
From January 1, 2011 up to March 17, 2011, a total of 5,554,280 common shares of the Parent<br />
Company were acquired by JGSHI.<br />
On February 28, 2011, the BOD of the Parent Company approved the creation <strong>and</strong><br />
implementation of a share buyback program (SBP). The SBP will involve up to P=2.0 billion<br />
worth of the Parent Company’s common share. The SBP shall commence upon approval <strong>and</strong><br />
shall end upon utilization of the said amount, or as may be otherwise determined by the BOD.<br />
On March 7, 2011, the Group received one ATR 72-500 turboprop aircraft.<br />
*SGVMC115503*
- 71 -<br />
On March 17, 2011, the BOD of the Parent Company approved the declaration of a regular cash<br />
dividend in the amount of P=2.00 per share <strong>and</strong> a special cash dividend in the amount of P=1.00 per<br />
share from the unrestricted retained earnings of the Parent Company to all stockholders of record<br />
as of April 14, 2011 <strong>and</strong> payable on May 12, 2011.<br />
*SGVMC115503*
SyCip Gorres Velayo & Co.<br />
6760 Ayala Avenue<br />
1226 Makati City<br />
Philippines<br />
Phone: (632) 891 0307<br />
Fax: (632) 819 0872<br />
www.sgv.com.ph<br />
BOA/PRC Reg. No. 0001<br />
SEC Accreditation No. 0012-FR-2<br />
INDEPENDENT AUDITORS’ REPORT<br />
ON SUPPLEMENTARY SCHEDULE<br />
The Stockholders <strong>and</strong> the Board of Directors<br />
<strong>Cebu</strong> <strong>Air</strong>, Inc.<br />
2nd Floor, Doña Juanita Marquez Lim Building<br />
Osmeña Boulevard, <strong>Cebu</strong> City<br />
We have audited in accordance with Philippine St<strong>and</strong>ards on Auditing the consolidated financial<br />
statements of <strong>Cebu</strong> <strong>Air</strong>, Inc. <strong>and</strong> Subsidiaries (the Group) included in this Form 17-A <strong>and</strong> have issued<br />
our report thereon dated March 17, 2011. Our audits were made for the purpose of forming an opinion<br />
on the basic consolidated financial statements taken as a whole. The schedules listed in the Index to<br />
Consolidated Financial Statements <strong>and</strong> Supplementary Schedules are the responsibility of the Group’s<br />
management <strong>and</strong> are presented for purposes of complying with Securities Regulation Code Rule 68.1,<br />
<strong>and</strong> are not part of the basic consolidated financial statements. These schedules have been subjected<br />
to the auditing procedures applied in the audit of the basic consolidated financial statements <strong>and</strong>, in<br />
our opinion, fairly state in all material respects the financial data required to be set forth therein in<br />
relation to the basic consolidated financial statements taken as a whole.<br />
SYCIP GORRES VELAYO & CO.<br />
Vicky B. Lee-Salas<br />
Partner<br />
CPA Certificate No. 86838<br />
SEC Accreditation No. 0115-AR-2<br />
Tax Identification No. 129-434-735<br />
BIR Accreditation No. 08-001998-53-2009,<br />
June 1, 2009, Valid until May 31, 2012<br />
PTR No. 2641532, January 3, 2011, Makati City<br />
March 17, 2011<br />
*SGVMC115503*<br />
A member firm of Ernst & Young Global Limited