English - Stora Enso
English - Stora Enso
English - Stora Enso
Create successful ePaper yourself
Turn your PDF publications into a flip-book with our unique Google optimized e-Paper software.
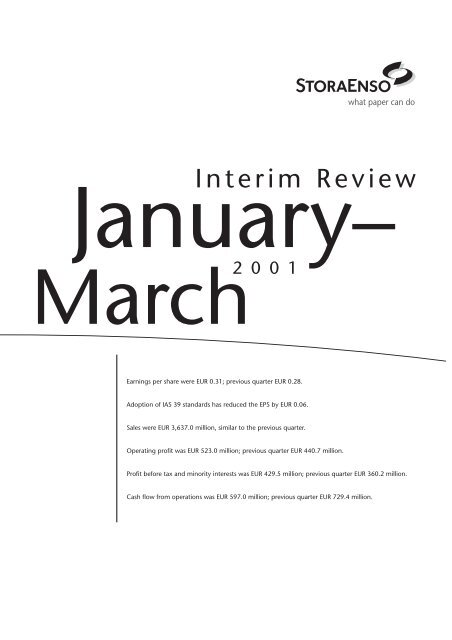
Interim Review<br />
January–<br />
March2 001<br />
Earnings per share were EUR 0.31; previous quarter EUR 0.28.<br />
Adoption of IAS 39 standards has reduced the EPS by EUR 0.06.<br />
Sales were EUR 3,637.0 million, similar to the previous quarter.<br />
Operating profit was EUR 523.0 million; previous quarter EUR 440.7 million.<br />
Profit before tax and minority interests was EUR 429.5 million; previous quarter EUR 360.2 million.<br />
Cash flow from operations was EUR 597.0 million; previous quarter EUR 729.4 million.
Key Ratios I/00 II/00 III/00 IV/00 2000 I/01<br />
Earnings per share (basic), EUR 0.38 0.83 0.36 0.19 1.77 0.31<br />
Earnings per share excl.<br />
non-rec. items, EUR 0.36 0.26 0.37 0.28 1.32 0.31<br />
Cash earnings per share (CEPS), EUR 0.69 1.14 0.66 0.62 3.16 0.65<br />
CEPS excl. non-recurring items, EUR 0.67 0.57 0.67 0.61 2.61 0.65<br />
Return on capital employed (ROCE), % 17.7 36.5 20.7 9.3 20.7 15.2<br />
ROCE excl. non-recurring items, % 16.9 16.1 21.6 12.4 16.8 15.2<br />
Return on equity (ROE), % 19.4 38.9 18.1 8.0 19.5 16.1<br />
Debt/equity ratio 0.72 0.40 0.65 0.59 0.59 0.59<br />
Equity per share, EUR 8.0 8.7 9.5 9.4 9.4 9.3<br />
Equity ratio, % 38.4 43.0 39.6 40.9 40.9 39.9<br />
Operating profit, % of sales 17.2 32.1 16.4 9.0 18.2 14.4<br />
Operating profit excl. non-recurring items, % of sales 16.2 14.1 17.1 12.0 14.8 14.4<br />
Capital expenditure, EUR million 134 162 207 266 769 176<br />
Capital expenditure, % of sales 4.5 5.2 6.4 7.2 5.9 4.8<br />
Capital employed, EUR million 10 792 9 499 14 644 13 903 13 903 13 611<br />
Interest-bearing net liabilities, EUR million 4 515 2 711 5 759 5 183 5 183 5 040<br />
Average number of employees 39 029 41 157 42 978 43 975 41 785 42 570<br />
Average number of shares (million) 759.8 759.9 812.1 914.7 812.0 906.2<br />
Number of shares diluted (million) 813.5 908.3<br />
January - March result<br />
Earnings per share for January to March were EUR 0.31<br />
(EUR 0.28), up 10.7% on the previous quarter, and cash<br />
earnings per share were EUR 0.65 (EUR 0.61), up 6.6%.<br />
There were no non-recurring items in the first quarter of<br />
2001.<br />
The general slowdown in the US economy has<br />
increased uncertainty and lowered consumption, especially<br />
in coated fine paper and coated magazine paper in<br />
North America, where coated fine paper prices have<br />
softened. European demand and prices have remained<br />
fairly stable. To keep the supply and demand balance<br />
healthy, <strong>Stora</strong> <strong>Enso</strong> curtailed production of paper and<br />
board for market reasons by 205,000 tonnes in the first<br />
quarter.<br />
Paper and board deliveries totalled 3,337,000 tonnes,<br />
which is 256,000 tonnes less than the previous quarter’s<br />
3,593,000 tonnes. Deliveries of timber products totalled<br />
1,242,000 m 3 , compared with the previous quarter's<br />
1,312,000 m 3 .<br />
EUR million Jan-Dec 2000 Jan-Mar 2000 Oct-Dec 2000 Jan-Mar 2001<br />
Sales 13 017.0 2 991.7 3 678.0 3 637.0<br />
EBITDA 1) 2) 2 970.2 716.7 748.9 825.8<br />
Operating profit 2) 1 925.6 485.6 440.7 523.0<br />
Operating margin 2) 14.8% 16.2% 12.0% 14.4%<br />
Operating profit 2 371.3 509.6 330.6 523.0<br />
Profit before taxes 2) 1 653.3 422.6 360.2 429.5<br />
Profit before taxes 2 099.0 446.6 250.1 429.5<br />
Net profit 1 435.0 290.7 175.9 283.3<br />
EPS 2) , Basic, EUR 1.32 0.36 0.28 0.31<br />
EPS, Basic, EUR 1.77 0.38 0.19 0.31<br />
CEPS 2) , EUR 2.61 0.67 0.61 0.65<br />
ROCE 2) 16.8% 16.9% 12.4% 15.2%<br />
1) EBITDA = Earnings Before Interest, Taxes, Depreciation and Amortisation<br />
2) Excluding non-recurring items<br />
2 <strong>Stora</strong> <strong>Enso</strong> Interim Review
First quarter results (compared with previous quarter)<br />
Sales for the quarter at EUR 3,637.0 million were almost<br />
the same as the previous quarter's EUR 3,678.0 million.<br />
The previous quarter's figure included sales of EUR 74.7<br />
million from the Gruvön mill, which has been accounted<br />
as an associated company from 1 January 2001<br />
onwards. The sales increase was attributable to increased<br />
sales prices in magazine paper, newsprint and packaging<br />
boards, partially offset by a decrease in fine paper prices.<br />
Regardless of recent weakening, the euro was on average<br />
stronger against the US dollar and the British pound<br />
than in the previous quarter having a negative EUR 90<br />
million effect on sales.<br />
The operating profit excluding non-recurring items<br />
for the first quarter was EUR 523.0 million (EUR 440.7<br />
million), which is 18.7% more than in the previous<br />
quarter and 14.4% of sales. There was an improvement<br />
in operating profit in all paper and board product areas<br />
except fine paper due to increased prices, especially in<br />
newsprint. The previous period included EUR 8.3 million<br />
of operating profit from the Gruvön mill. Timber,<br />
Merchants and Forest operations reported lower profits<br />
than in the previous quarter.<br />
The estimated currency effect of the US dollar and<br />
British pound on the operating profit was a negative<br />
EUR 20 million or EUR 0.01 per share. The fall in recovered<br />
paper prices increased the operating profit by EUR<br />
15 million and the earnings per share by EUR 0.01.<br />
Increase in energy prices decreased operating profit by<br />
EUR 14 million or by EUR 0.01 per share.<br />
The share of results of associated companies<br />
amounted to EUR 28.3 million (EUR 7.7 million), of<br />
which EUR 5.8 million was from Sunila Oy and EUR<br />
21.4 million from Billerud AB. This contributed EUR<br />
0.02 to earnings per share.<br />
Net financial items were EUR 121.8 million. Net<br />
interest expenses for the quarter were EUR 77.0 million<br />
(EUR 95.9 million), which is 5.7% of interest-bearing<br />
net liabilities. Net foreign exchange loss was EUR 53.6<br />
million, of which EUR –77.2 million (EUR 0.06 per<br />
share) was due to adoption of the new International<br />
Accounting Standard for Financial Instruments (IAS 39).<br />
Profit before taxes and minority interests excluding<br />
non-recurring items amounted to EUR 429.5 million<br />
(EUR 250.1 million). Taxes totalled EUR 146 million<br />
(EUR 73.1 million), equivalent to a tax rate of 34.0%<br />
(29.2%). Taxes reduced earnings per shares by EUR 0.16.<br />
The minority interest on profits was EUR -0.2 million<br />
(EUR -1.2 million), and the profit for the period was<br />
EUR 283.3 million (EUR 175.9 million).<br />
The return on capital employed was 15.2% (12.4%).<br />
Capital employed was EUR 13,611.1 million at the end<br />
of the period, a net decrease of EUR 291.8 million since<br />
the beginning of the year mainly due to year 2000 dividends.<br />
First quarter results (compared with the same period<br />
in 2000)<br />
Sales increased by EUR 645.3 million or 21.6%, including<br />
EUR 553.6 million due to the acquisition of<br />
Consolidated Papers. The first quarter of 2000 included<br />
EUR 81.7 million of sales from the Gruvön mill.<br />
The operating profit excluding non-recurring items<br />
increased by EUR 37.4 million or 7.7%. Paper and board<br />
product areas reported increased profits with the largest<br />
increase in newsprint, but the operating profits of<br />
Timber, Merchants and Forest operations were lower<br />
than in the same period last year.<br />
Profit before taxes and minority interests excluding<br />
non-recurring items increased by EUR 6.9 million. The<br />
estimated currency effect of the US dollar on the operating<br />
profit was a EUR 20 million.<br />
<strong>Stora</strong> <strong>Enso</strong> Interim Review 3
Capital structure, EUR million 31 Dec. 2000 31 Mar. 2000 31 Mar. 2001<br />
Fixed assets 15 280.7 11 601.8 15 061.9<br />
Working capital 1 276.2 899.9 1 092.1<br />
Operating capital 16 556.9 12 501.7 16 154.0<br />
Net tax liabilities -2 654.0 -1 711.6 -2 542.9<br />
Capital employed 13 902.9 10 790.1 13 611.1<br />
Shareholders’ equity 8 570.8 6 069.5 8 430.5<br />
Minority interests 149.4 206.6 140.3<br />
Interest-bearing net liabilities 5 182.7 4 514.0 5 040.3<br />
Financing total 13 902.9 10 790.1 13 611.1<br />
Financing<br />
The cash flow from operations was EUR 597.0 million<br />
(EUR 729.4 million). The operating cash flow (cash flow<br />
from operations minus investing activities) amounted to<br />
EUR 715.7 million (EUR 462.8 million). At the end of<br />
the period interest-bearing net liabilities were EUR<br />
5,040.3 million, down EUR 142.4 million compared<br />
with the end of 2000. Cash reserves and unutilised credit<br />
facilities totalled EUR 2.2 billion at the end of the<br />
period.<br />
The debt/equity ratio at the end of period was 0.59,<br />
the same as at the end of 2000. Equity per share was<br />
EUR 9.3 (EUR 9.4). The dividend of EUR 417.8 million<br />
for 2000 was deducted from the equity and entered into<br />
current liabilities. The date of the payment was 4 April<br />
2001, after the end of the review period.<br />
Change in interest-bearing net liabilities Group Translation Impact on the<br />
EUR million cash flow difference balance sheet<br />
Operating profit 523.0 523.0<br />
Depreciation 298.8 298.8<br />
Change in working capital 1) -224.8 -8.9 -233.7<br />
Cash flow from operations 1) 597.0 -8.9 588.1<br />
Capital expenditure -175.7 -175.7<br />
Acquisitions -10.3 -10.3<br />
Disposals 20.6 20.6<br />
Other change in fixed assets 284.1 -198.7 85.4<br />
Operating cash flow 1) 715.7 -207.6 508.1<br />
Net financing items -93.5 -93.5<br />
Taxes paid -246.2 -11.0 -257.2<br />
Share issue 11.9 11.9<br />
Other change in shareholders’ equity 7.2 -24.9 -17.7<br />
Minority interests -9.2 -9.2<br />
Change in net interest-bearing net liabilities 385.9 -243.5 142.4<br />
1) Excluding the unpaid dividend of EUR 417.8 million reported as interest free current liabilities<br />
4 <strong>Stora</strong> <strong>Enso</strong> Interim Review
Capital expenditure<br />
Capital expenditure totalled EUR 175.7 million, which<br />
is in line with the Group’s policy of not exceeding the<br />
annual level of depreciation. The main investment during<br />
the quarter was the new pulping line (EUR 35 million)<br />
at Imatra, Finland, which came on stream 2 April.<br />
On 9 January <strong>Stora</strong> <strong>Enso</strong> announced its plan to<br />
restructure its newsprint and magazine paper production<br />
capacity to increase profitability. <strong>Stora</strong> <strong>Enso</strong> intends<br />
to build a new 400,000 tonnes per year newsprint/SC<br />
machine at Langerbrugge, Belgium and to shut down<br />
two paper machines with a combined capacity of about<br />
230,000 tonnes per year at Langerbrugge and Summa,<br />
Finland. The total investment cost is estimated at EUR<br />
430 million. In addition, it was decided to shut down a<br />
140,000 tonnes per year offline coater at Nymölla,<br />
Sweden. From the year 2002 Nymölla will concentrate<br />
on production of uncoated fine paper. During the quarter<br />
it was also decided to rebuild Summa’s newsprint<br />
machine no. 3 and TMP plant at a cost of EUR 20 million.<br />
Issues outstanding with competition authorities<br />
The company has given its reply to a statement of<br />
objection from European Commission in autumn 1999<br />
related to newsprint producer’s operations from 1989 to<br />
1995. The company is still waiting for the EU’s<br />
response. No provision has been made in this respect.<br />
Changes in group composition<br />
As the Group’s pulp sales and purchases are in balance,<br />
it was decided to dissolve the pulp product area and<br />
reallocate the non-integrated pulp mills to the product<br />
areas, so pulp is now included in product area reporting.<br />
All product area figures in this report have been calculated<br />
accordingly.<br />
Major decisions of AGM on 20 March 2001<br />
The Annual General Meeting of Shareholders approved<br />
the proposed dividend of EUR 0.45 per share.<br />
Ilkka Niemi was elected to the Board of Directors in<br />
place of Raimo Luoma, who was resigning from the<br />
Board. All the other members were re-elected.<br />
The AGM approved reduction of the share capital<br />
by EUR 39,390,190 through the cancellation of 910,600<br />
A and 22,260,100 R repurchased shares. The new share<br />
capital was recorded in the Finnish Trade Register on 9<br />
April 2001. The new share capital is EUR<br />
1,539,058,903.90.<br />
The Board of Directors was authorised to repurchase<br />
up to 9,679,000 A shares and up to 35,586,000 R shares<br />
by 19 March 2002. The repurchases started on 28 March<br />
2001. By 10 April the company had repurchased 62,500<br />
A and 1,721,500 R shares at a total cost of EUR 19 million,<br />
the average price paid for A shares being EUR<br />
10.77 and for R shares EUR 10.75.<br />
Events after the period<br />
On 9 April <strong>Stora</strong> <strong>Enso</strong> announced that it will invest EUR<br />
14 million in expanding the corrugated board and box<br />
production capacity of its Balabanovo mill in Russia<br />
from 70 million to 105 million m 2 . The new capacity<br />
will come on stream in March 2002.<br />
Market outlook<br />
European demand is still fairly stable. European coated<br />
fine paper prices are under pressure, but magazine paper<br />
prices are still solid. European newsprint supply and<br />
demand are in balance. Paperboard market is weakening<br />
slightly. Buyers’ inventories are generally low and further<br />
large-scale de-stocking is unlikely. Demand for<br />
sawn timber will remain weak. In North America, coated<br />
fine paper and magazine paper demand is expected<br />
to remain weak, with prices under pressure.<br />
<strong>Stora</strong> <strong>Enso</strong> will continue to adjust capacity utilisation<br />
as appropriate. The full year financial results will<br />
depend very much on the industry’s ability to maintain<br />
prices, on internal efficiency and cost awareness.<br />
This report is unaudited.<br />
Helsinki, 26 April 2001<br />
<strong>Stora</strong> <strong>Enso</strong> Oyj<br />
Board of Directors<br />
<strong>Stora</strong> <strong>Enso</strong> Interim Review 5
PRODUCT AREAS<br />
Magazine paper<br />
Change<br />
EUR million 2000 I/00 II/00 III/00 IV/00 I/01 I/IV %<br />
Sales 2 818.8 562.5 590.0 729.1 937.2 910.2 -2.9<br />
Operating profit 399.4 91.6 91.4 138.6 77.8 113.6 46.0<br />
% of sales 14.2 16.3 15.5 19.0 8.3 12.5<br />
ROOC, %* 15.5 17.1 17.1 22.9 8.6 12.7<br />
Deliveries, 1000 t 3 269 676 707 838 1 048 994 -5.2<br />
* ROOC = 100% x Operating profit/Operating capital<br />
Compared with the last quarter of 2000, sales decreased<br />
by 2.9% to EUR 910.2 million. The operating profit was<br />
EUR 113.6 million, up 46%. Price rises of 5-8% for SC<br />
and LWC paper implemented in Europe at the beginning<br />
of 2001 and declines in chemical pulp and recovered<br />
paper prices, partially offset by higher energy<br />
prices, increased the operating profit. Production was<br />
curtailed for market reasons by 30,000 tonnes in North<br />
America.<br />
Following the buoyant year 2000 for both Europe<br />
and North America, the market has calmed down, but<br />
demand has still remained fairly good. There is some<br />
concern about medium-weight coated (MWC) grades,<br />
which are affected by the slack market for coated fine<br />
paper.<br />
Producers’ inventories increased during the first<br />
quarter and now exceed last year’s average figures.<br />
The economic outlook for the coming months is still<br />
quite good for Europe, and demand and prices are not<br />
expected to change significantly from today’s levels,<br />
though there is some uncertainty concerning coated<br />
papers. The North American market for magazine paper<br />
will be weaker than last year owing to economic uncertainty.<br />
Newsprint<br />
Change<br />
EUR million 2000 I/00 II/00 III/00 IV/00 I/01 I/IV %<br />
Sales 1 766.7 416.0 417.0 449.6 484.1 501.7 3.6<br />
Operating profit 268.3 62.6 43.2 80.8 81.7 134.1 64.1<br />
% of sales 15.2 15.0 10.4 18.0 16.9 26.7<br />
ROOC, %* 19.9 18.1 12.7 24.1 25.2 43.0<br />
Deliveries, 1000 t 3 134 759 747 789 840 780 -7.1<br />
* ROOC = 100% x Operating profit/Operating capital<br />
Compared with the previous quarter, sales increased by<br />
3.6% to EUR 501.7 million and operating profit by<br />
64.1% to EUR 134.1 million. Rises in European sales<br />
prices and lower recovered paper prices, partially offset<br />
by higher energy prices, increased the operating profit.<br />
Slower growth in the economies has started to<br />
reduce newsprint consumption through cuts in advertising<br />
expenditure. In European markets in particular there<br />
is still good demand, but in North America some producers<br />
have already taken market-related downtime.<br />
There were no curtailments at <strong>Stora</strong> <strong>Enso</strong>’s newsprint<br />
mills during the period.<br />
The market is expected to remain in good balance in<br />
the coming months.<br />
6 <strong>Stora</strong> <strong>Enso</strong> Interim Review
PRODUCT AREAS<br />
Fine paper<br />
Change<br />
EUR million 2000 I/00 II/00 III/00 IV/00 I/01 I/IV %<br />
Sales 3 473.2 758.5 768.1 883.5 1 063.1 1 021.3 -3.9<br />
Operating profit 688.8 150.5 146.5 194.1 197.7 167.6 -15.2<br />
% of sales 19.8 19.8 19.1 22.0 18.6 16.4<br />
ROOC, %* 20.3 21.4 20.9 24.5 16.6 14.9<br />
Deliveries, 1000 t 3 151 771 720 793 867 857 -1.2<br />
* ROOC = 100% x Operating profit/Operating capital<br />
Sales amounted to EUR 1,021.3 million, 3.9% less than<br />
in the previous quarter. The operating profit declined to<br />
EUR 167.6 million, about 15%, owing to market-related<br />
production curtailments of 135,000 tonnes, comprising<br />
35,000 tonnes of curtailments in North America and<br />
100,000 tonnes in Europe.<br />
Demand for coated fine paper remained weak<br />
throughout the first quarter, especially in North<br />
America, mainly because of de-stocking, but price levels<br />
were maintained in Western Europe. Demand for<br />
uncoated fine paper has weakened somewhat, but with<br />
an order book of three weeks the market is still relatively<br />
healthy. However, the weak market is continuing to<br />
put downward pressure on the prices of both grades,<br />
even though producers’ and customers’ inventories are<br />
back to normal.<br />
The coated fine paper market is expected to remain<br />
weak during the second half of the year.<br />
Packaging boards<br />
Change<br />
EUR million 2000 I/00 II/00 III/00 IV/00 I/01 I/IV %<br />
Sales 2 975.0 719.2 746.9 753.0 755.9 651.8 -13.8<br />
Operating profit 441.3 115.7 91.2 130.5 103.9 115.1 10.8<br />
% of sales 14.8 16.1 12.2 17.3 13.7 17.7<br />
ROOC, %* 15.4 16.4 12.7 18.0 14.5 17.5<br />
Deliveries, 1000 t 3 417 876 855 848 838 706 -15.8<br />
* ROOC = 100% x Operating profit/Operating capital<br />
Compared with the previous quarter, sales declined by<br />
EUR 104.1 million to EUR 651.8 million mainly because<br />
they no longer include the Gruvön mill sales. The operating<br />
profit rose by EUR 11.2 million to EUR 115.1 million<br />
due to price rises in some grades. Market-related<br />
production curtailments totalled 40,000 tonnes during<br />
the quarter.<br />
Overall the market for consumer packaging boards<br />
was a bit weaker than in the previous quarter.<br />
Corrugated packaging demand in Russia and the<br />
Baltic States grew. The Finnish market was stable but<br />
demand in Sweden weakened.<br />
The market for laminating papers and cores was<br />
sound. The demand for containerboards and coreboards<br />
was clearly weaker than last year.<br />
No major change in the market situation is expected<br />
in the second quarter.<br />
<strong>Stora</strong> <strong>Enso</strong> Interim Review 7
PRODUCT AREAS<br />
Timber<br />
Change<br />
EUR million 2000 I/00 II/00 III/00 IV/00 I/0I I/IV %<br />
Sales 1 242.1 298.1 334.8 293.7 315.5 307.3 -2.6<br />
Operating profit 73.3 23.8 21.7 16.5 11.3 5.6 -50.4<br />
% of sales 5.9 8.0 6.5 5.6 3.6 1.8<br />
ROOC, %* 18.6 24.6 22.1 16.5 11.5 5.7<br />
Deliveries, 1000 m 3 4 880 1 159 1 290 1 120 1 312 1 242 -5.3<br />
* ROOC = 100% x Operating profit/Operating capital<br />
Sales were EUR 307.3 million, down 2.6% on the previous<br />
quarter. The operating profit was EUR 5.6 million,<br />
down about 50%, mainly due to the weak market.<br />
The global oversupply is especially severe in commodity<br />
construction and packaging grades. Some speciality<br />
segments in interior decorations have also been<br />
hit hard by the oversupply, which has led to a much<br />
steeper price decline than expected.<br />
The markets in the USA and Japan are also suffering<br />
from flat consumption and oversupply in commodity<br />
construction materials, but the balance between supply<br />
and demand seems to be better in system building components.<br />
Global demand for wood products is expected to<br />
remain flat, with the oversupply in the market persisting<br />
through the first half of 2001.<br />
Merchants<br />
Sales were EUR 231.4 million, and the operating profit<br />
was EUR 0.2 million. E-business project costs have<br />
reduced the operating profit by EUR 2.0 million.<br />
The markets are expected to remain difficult<br />
throughout the year.<br />
Forest<br />
Sales rose by 4.2% to EUR 511.5 million, but the operating<br />
profit fell by 12.8% to EUR 25.3 million because<br />
lower volumes were harvested in the Group's own<br />
forests.<br />
The market and wood prices remained stable in<br />
Finland and Sweden. The weather was better than the<br />
very wet end of last year, which had an adverse effect<br />
on forest operations and forest roads. However, curtailed<br />
production at some Swedish mills resulted in regional<br />
stock increases and downward pressure on pulpwood<br />
and sawlog prices.<br />
Deliveries to the mills in the Nordic countries<br />
totalled 10.8 million m 3 (solid under bark), 7% more<br />
than in the previous quarter. Imports of wood increased<br />
by 23% to 2.5 million m 3 . Felling in the Group's forests<br />
at 0.9 million m 3 was 46% less than in the previous<br />
quarter, when felling had been increased to compensate<br />
for private owners' weather-related problems.<br />
8 <strong>Stora</strong> <strong>Enso</strong> Interim Review
FINANCIALS<br />
Condensed Consolidated Income Statement<br />
EUR million Full year 2000 Jan.–Mar. 2000 Jan.–Mar. 2001<br />
Sales 13 017.0 2 991.7 3 637.0<br />
Expenses and other operating income -7 520.6 -1 805.5 -2 251.9<br />
Personnel expenses -1 995.7 -445.5 -559.3<br />
Depreciation, amortisation and impairment charges -1 129.4 -231.1 -302.8<br />
Operating profit 2 371.3 509.6 523.0<br />
Share of results of associated companies 20.6 5.8 28.3<br />
Net financial items -292.9 -68.8 -121.8<br />
Profit before tax and minority interests 2 099.0 446.6 429.5<br />
Income tax expense -650.3 -148.5 -146.0<br />
Profit after tax 1 448.7 298.1 283.5<br />
Minority interests -13.7 -7.4 -0.2<br />
Net profit for the period 1 435.0 290.7 283.3<br />
Key ratios<br />
Basic earnings per share, EUR 1.77 0.38 0.31<br />
Diluted earnings per share, EUR 1.76 0.38 0.31<br />
Accounting principles<br />
This interim report is in compliance with IAS 34 Interim Financial Reporting.<br />
The accounting policies and methods of computation used in this interim<br />
report are the same as used in the last annual report, except that the Group<br />
adopted IAS 39, Financial instruments: Recognition and Measurement as of 1<br />
January 2001,which has resulted in the following adjustments in the opening<br />
balance.<br />
In accordance with the transitional provisions of IAS 39, <strong>Stora</strong> <strong>Enso</strong> recorded a<br />
cumulative adjustment of EUR 15.6 million net of taxes in retained earnings to<br />
recognise at fair value all derivatives that are designated as fair value hedging<br />
instruments. <strong>Stora</strong> <strong>Enso</strong> also recorded a cumulative adjustment of EUR –27.8<br />
million in the retained earnings to recognise the difference between the carrying<br />
values and fair values of related hedged assets and liabilities.<br />
instruments. <strong>Stora</strong> <strong>Enso</strong> also recorded a corresponding cumulative adjustment<br />
of EUR 13.8 million net of taxes in the hedging reserve (equity) to recognise the<br />
difference between the carrying values and fair values of these derivatives.<br />
Upon adoption of IAS 39 <strong>Stora</strong> <strong>Enso</strong> also recognised in its balance sheet<br />
other derivatives, either as assets or liabilities, and measured them at fair value.<br />
This recognition resulted in the adjustments of EUR 5.0 million in interest-bearing<br />
assets and EUR 25.2 million in interest-bearing liabilities. <strong>Stora</strong> <strong>Enso</strong> recorded<br />
a corresponding cumulative adjustment of EUR –14.3 million net of taxes in<br />
retained earnings to recognise the difference between the carrying values and<br />
fair values of these derivatives.<br />
<strong>Stora</strong> <strong>Enso</strong> classified its investments as available for sale. <strong>Stora</strong> <strong>Enso</strong> measured<br />
these securities to fair value and recorded a cumulative adjustment of EUR<br />
61.9 million net of taxes in the available for sale reserve (equity).<br />
<strong>Stora</strong> <strong>Enso</strong> recorded an adjustment of EUR 23.0 million in interest-bearing<br />
This report is unaudited<br />
assets and adjustment of EUR 3.2 million in interest bearing-liabilities to recognise<br />
at the fair value all derivatives that are designated as cash flow hedging<br />
Key exchange rates for the euro<br />
One euro is Closing rate Average rate<br />
31 Dec. 2000 31 Mar. 2001 31 Dec. 2000 31 Mar. 2001<br />
SEK 8.8313 9.157 8.4416 8.998054<br />
USD 0.9305 0.8832 0.9242 0.923648<br />
GBP 0.6241 0.6192 0.6088 0.632958<br />
CAD 1.3965 1.3904 1.3711 1.410168<br />
<strong>Stora</strong> <strong>Enso</strong> Interim Review 9
Condensed Consolidated Cash Flow Statement (IAS)<br />
EUR million 2000 Jan.–Mar. 2000 Jan.–Mar. 2001<br />
Cash flow from operating activities<br />
Operating profit 2 371.3 509.6 523.0<br />
Adjustments 531.9 188.5 298.8<br />
Change in net working capital 96.6 -70.9 -517.1<br />
Cash flow generated by operations 2 999.8 627.2 304.7<br />
Net financial items -285.9 -68.7 -224.9<br />
Income taxes paid -553.3 -144.7 -246.2<br />
Net cash provided by operating activities 2 160.6 413.8 -166.4<br />
Acquisitions -4 559.1 -31.9 -10.3<br />
Proceeds from sale of fixed assets or shares 720.8 78.6 20.6<br />
Capital expenditure -769.3 -134.9 -175.7<br />
Proceeds from the long-term receivables, net -20.6 0.6 47.0<br />
Net cash used in investing activities -4 628.2 -87.6 -118.4<br />
Cash flow from financing activities<br />
Change in long-term liabilities 2 077.8 -147.6 -178.7<br />
Change in short-term borrowings -744.8 -286.5 217.1<br />
Dividends paid -303.9 - -<br />
Proceeds from issuance of share capital 1 717.2 - 11.9<br />
Purchase of own shares -173.7 - -81.6<br />
Other change in shareholders’ equity -2.4 99.7 7.2<br />
Other change in minority interests - -2.8 -9.2<br />
Net cash used in financing activities 2 570.2 -337.2 -33.3<br />
Net increase in cash and cash equivalents 102.6 -11.0 -318.1<br />
Translation differences on cash holdings -0.3 3.6 2.4<br />
Cash and bank at the beginning of period 642.2 642.2 744.5<br />
Cash and cash equivalents at end of period 744.5 634.8 428.8<br />
Capital expenditure and commitments<br />
EUR million 2000 Jan.-Mar. 2000 Jan.-Mar. 2001<br />
Opening net book amount 11 248.4 11 248.4 15 103.4<br />
Acquisition of subsidiary 5 830.3 11.1 10.3<br />
Additions 769.3 134.9 175.7<br />
Disposals -1 315.3 -33.2 -300.6<br />
Depreciation, amortisation, impairment and<br />
translation differences -1 429.3 -39.5 -106.1<br />
Closing net book amount 15 103.4 11 321.7 14 882.7<br />
Borrowings<br />
Current 1 340.8 1 652.7 1 623.7<br />
Non-current 5 514.7 3 829.7 5 358.6<br />
Total 6 855.5 5 482.4 6 982.3<br />
Opening amount, borrowings 5 769.5 5 769.5 6 855.5<br />
Acquisition of subsidiary 1 204.9 10.9 -<br />
Proceeds from (payments of) borrowings, net 76.8 -434.1 106.5<br />
Translation difference -195.7 136.1 20.3<br />
Closing amount 6 855.5 5 482.4 6 982.3<br />
Acquisition<br />
Property, plant and equipment 3 897.3 11.1 10.3<br />
Borrowings -1 204.9 -10.9 -<br />
Other assets, less liabilities -66.3 15.9 -<br />
Fair value of net assets 2 626.1 16.1 10.3<br />
Goodwill 1 933.0 15.8 -<br />
Total purchase consideration 4 559.1 31.9 10.3<br />
10 <strong>Stora</strong> <strong>Enso</strong> Interim Review
Condensed Consolidated Balance sheet<br />
Assets<br />
EUR million 31 Dec. 2000 31 Mar. 2000 31 Mar. 2001<br />
Fixed assets and other long-term investments<br />
Property, plant and equipment,<br />
intangible assets and goodwill O 15 103.4 11 321.7 14 882.7<br />
Investment in other companies O 177.2 280.1 179.2<br />
Investment in associated companies I 213.6 166.6 354.6<br />
Investments I 132.3 50.0 204.7<br />
Non-current loan receivables I 486.3 67.7 484.2<br />
Deferred tax assets T 11.7 5.9 17.0<br />
Other non-current assets O 254.5 87.4 256.1<br />
Fixed assets and other<br />
long-term investments 16 379.0 11 979.4 16 378.5<br />
Current assets<br />
Inventories O 1 589.5 1 343.4 1 676.4<br />
Tax receivables T 153.0 97.1 149.9<br />
Short-term receivables O 2 360.7 2 227.6 2 371.1<br />
Current portion of loan receivables I 96.2 49.3 469.7<br />
Cash and cash equivalents I 744.4 634.8 428.8<br />
4 943.8 4 352.2 5 095.9<br />
Total assets 21 322.8 16 331.6 21 474.4<br />
Shareholders’ equity and liabilities<br />
EUR million 31 Dec. 2000 31 Mar. 2000 31 Mar. 2001<br />
Shareholders’ equity 8 570.8 6 069.5 8 430.5<br />
Minority interests 149.4 206.6 140.3<br />
Long-term liabilities<br />
Pension provisions O 771.8 578.9 777.8<br />
Deferred tax liabilities T 2 247.5 1 521.1 2 256.0<br />
Other provisions O 173.4 200.4 150.2<br />
Long-term debt I 5 514.7 3 829.7 5 358.6<br />
Other long-term liabilities O 92.6 88.0 51.9<br />
8 800.0 6 218.1 8 594.5<br />
Current liabilities<br />
Interest-bearing liabilities I 1 340.8 1 652.7 1 623.7<br />
Tax liabilities T 571.2 293.5 453.8<br />
Other current liabilities O 1 890.6 1 891.2 2 231.6<br />
3 802.6 3 837.4 4 309.1<br />
Total minority interests and liabilities 12 752.0 10 262.1 13 043.9<br />
Total shareholders’ equity and liabilities 21 322.8 16 331.6 21 474.4<br />
Items designated with “O” are included in the operating capital.<br />
Items designated with “I” are included in interest-bearing net liabilities.<br />
Items designated with “T” are included in the tax liability.<br />
<strong>Stora</strong> <strong>Enso</strong> Interim Review 11
Equity Reconciliation (IAS)<br />
Share Share Share Treasury Other com- Cumulative Retained Total<br />
capital issue issue shares prehensive translation earnings<br />
EUR million premium income adjustment<br />
Balance at 31 Dec. 1997 1 277.5 354.3 -19.9 3 901.3 5 513.2<br />
Change in accounting policy with respect<br />
to forest accounting (net of deferred tax) 2.8 12.1 14.9<br />
Balance at 31 Dec. 1997, restated 1 277.5 354.3 -17.1 3 913.4 5 528.1<br />
Transfer to reserves 23.4 -23.4<br />
Dividends paid (EUR 0.33 per share) -242.6 -242.6<br />
Net profit for the period 185.3 185.3<br />
Translation adjustment -170.9 -170.9<br />
Balance at 31 Dec. 1998, restated 1 277.5 377.7 -188.0 3 832.7 5 299.9<br />
Balance at 31 Dec. 1998 1 277.5 377.7 -188.0 3 826.3 5 293.5<br />
Effect of adopting IAS 19 (revised) -27.2 -27.2<br />
Change in accounting policy with respect<br />
to forest accounting (net of deferred tax) 6.4 6.4<br />
Balance at 31 Dec. 1998, restated 1 277.5 377.7 -188.0 3 805.5 5 272.7<br />
Warrants exercised 0.1 1.9 2.0<br />
Dividends paid (EUR 0.35 per share) -268.3 -268.3<br />
Net profit for the period 746.4 746.4<br />
Translation adjustment 203.7 203.7<br />
Balance at 31 Dec. 1999, restated 1 277.6 379.6 15.7 4 283.6 5 956.5<br />
Balance at 31 Dec. 1999,<br />
as previously reported 1 277.6 379.6 12.7 4 283.3 5 953.2<br />
Change in accounting policy with respect<br />
to forest accounting (net of deferred tax) 3.0 0.3 3.3<br />
Balance at 31 Dec. 1999, restated 1 277.6 379.6 15.7 4 283.6 5 956.5<br />
Dividends paid (EUR 0.40 per share) -303.9 -303.9<br />
To be placed at the disposal of the<br />
Board of Directors -1.0 -1.0<br />
Share issue 0.4 -0.4 0.0<br />
Share issue (Consolidated Papers) 284.5 1 432.7 1 717.2<br />
Conversion of share capital from FIM to EUR 13.8 -13.8 0.0<br />
Acquisition of <strong>Stora</strong> <strong>Enso</strong> Oyj shares -173.7 -173.7<br />
Options issued (Consolidated Papers) 25.1 0.9 26.0<br />
Net profit for the period 1 435.0 1 435.0<br />
Translation adjustment -85.3 -85.3<br />
Balance at 31 Dec. 2000 1 576.3 1 823.2 -173.7 -69.6 5 414.6 8 570.8<br />
Effect of adopting IAS 39 75.7 -26.5 49.2<br />
Balance at 31 Dec. 2000, restated 1 576.3 1 823.2 -173.7 75.7 -69.6 5 388.1 8 620.0<br />
Acquisition of <strong>Stora</strong> <strong>Enso</strong> Oyj shares -81.6 -81.6<br />
Dividends paid (EUR 0.45 per share) -417.8 -417.8<br />
Share issue 0.5 1.8 2.3<br />
Share issue 1.6 3.3 4.7 9.6<br />
Net profit for the period 283.3 283.3<br />
Change in other comprehensive income<br />
entries -10.2 -10.2<br />
Translation adjustment 24.9 24.9<br />
Balance at 31 Mar. 2001 1 578.4 3.3 1 829.7 -255.3 65.5 -44.7 5 253.6 8 430.5<br />
Other comprehensive income comprises hedging reserve of cash flow derivatives and available for sale reserve.<br />
12 <strong>Stora</strong> <strong>Enso</strong> Interim Review
Commitments and Contingent Liabilities<br />
EUR million 31 Dec. 2000 31 Mar. 2000 31 Mar. 2001<br />
On own behalf<br />
Pledges given 38.9 67.6 22.0<br />
Mortgages 400.8 646.0 407.1<br />
On behalf of associated companies<br />
Mortgages 1.0 1.0 1.0<br />
Guarantees 14.5 11.2 14.4<br />
On behalf of others<br />
Pledges given 0.4 2.6 0.4<br />
Guarantees 102.8 201.6 101.1<br />
Other commitments, own<br />
Leasing commitments, in next 12 months 30.3 23.2 31.3<br />
Leasing commitments, after next 12 months 106.9 95.3 148.0<br />
Pension liabilities 2.9 3.0 2.7<br />
Other contingencies 87.2 42.3 100.4<br />
Total<br />
Pleges given 39.3 70.2 22.4<br />
Mortgages 401.8 647.0 408.1<br />
Guarantees 117.3 212.8 115.5<br />
Leasing commitments 137.2 118.5 179.3<br />
Pension liabilities 2.9 3.0 2.7<br />
Other commitments 87.2 42.3 100.4<br />
Total 785.7 1 093.8 828.4<br />
Risk Management Contracts<br />
EUR million 31 Dec. 2000 31 Mar. 2000 31 Mar. 2001<br />
Current value<br />
Interest rate derivatives 16.7 -0.5 4.2<br />
Foreign exchange derivatives 113.8 20.3 -125.1<br />
Commodity derivatives 5.0 18.9<br />
Equity swaps -15.8<br />
Nominal value<br />
Interest rate derivatives 737.5 1 059.8 1 356.7<br />
Foreign exchange derivatives 4 801.9 3 781.9 5 134.4<br />
Commodity derivatives 175.9 211.0<br />
Equity swaps 73.8<br />
Sales by product area<br />
EUR million 1999 I/2000 II/2000 III/2000 IV/2000 2000 I/2001<br />
Magazine 2 156.5 562.5 590.0 729.1 937.2 2 818.8 910.2<br />
Newsprint 1 641.8 416.0 417.0 449.6 484.1 1 766.7 501.7<br />
Fine paper 2 493.8 758.5 768.1 883.5 1 063.1 3 473.2 1 021.3<br />
Packaging boards 2 541.5 719.2 746.9 753.0 755.9 2 975.0 651.8<br />
Timber 1 140.0 298.1 334.8 293.7 315.5 1 242.1 307.3<br />
Merchants 787.2 225.4 221.4 212.9 230.9 890.6 231.4<br />
Forest 1 630.3 508.1 452.2 426.4 490.7 1 877.4 511.5<br />
Other -1 880.7 -522.8 -449.5 -494.8 -599.4 -2 066.5 -498.2<br />
Continuing operations total 10 510.4 2 965.0 3 080.9 3 253.4 3 678.0 12 977.3 3 637.0<br />
Divested paper units 24.7 0.0 0.0 0.0 0.0 0.0 0.0<br />
Discontinuing operations, Energy 228.0 46.4 23.9 0.0 0.0 70.3 0.0<br />
Internal sales, Energy -127.4 -19.7 -10.9 0.0 0.0 -30.6 0.0<br />
Total 10 635.7 2 991.7 3 093.9 3 253.4 3 678.0 13 017.0 3 637.0<br />
<strong>Stora</strong> <strong>Enso</strong> Interim Review 13
Adjusted operating profit by product area<br />
(Product area figures excluding non-recurring items and goodwill amortisation)<br />
EUR million 1999 I/2000 II/2000 III/2000 IV/2000 2000 I/2001<br />
Magazine 328.4 91.6 91.4 138.6 77.8 399.4 113.6<br />
Newsprint 306.4 62.6 43.2 80.8 81.7 268.3 134.1<br />
Fine paper 238.7 150.5 146.5 194.1 197.7 688.8 167.6<br />
Packaging boards 237.7 115.7 91.2 130.5 103.9 441.3 115.1<br />
Timber 43.5 23.8 21.7 16.5 11.3 73.3 5.6<br />
Merchants 4.1 5.0 2.4 0.5 2.0 9.9 0.2<br />
Forest 132.3 28.2 34.5 23.6 29.0 115.3 25.3<br />
Other -22.9 -4.6 -2.9 -1.7 -25.9 -35.1 -1.9<br />
Continuing operations Total 1 268.2 472.8 428.0 582.9 477.5 1 961.2 559.6<br />
Divested paper units -1.6 0.0 0.0 0.0 0.0 0.0 0.0<br />
Discontinued operations, Energy 91.9 26.9 25.8 0.0 0.0 52.7 0.0<br />
Operating profit Total (adjusted) 1 358.5 499.7 453.8 582.9 477.5 2 013.9 559.6<br />
Amortisation on consolidation goodwill -61.9 -14.1 -14.8 -22.6 -36.8 -88.3 -36.6<br />
Non-recurring items 103.0 24.0 554.9 -23.1 -110.1 445.7 0.0<br />
Operating profit Total (IAS) 1 399.6 509.6 993.9 537.2 330.6 2 371.3 523.0<br />
Net financial items -266.6 -68.8 -96.5 -39.4 -88.2 -292.9 -121.8<br />
Share of results of associated companies 9.7 5.8 4.4 2.7 7.7 20.6 28.3<br />
Profit before tax and minority interests 1 142.7 446.6 901.8 500.5 250.1 2 099.0 429.5<br />
Income tax expense -391.8 -148.5 -266.9 -161.9 -73.1 -650.3 -146.0<br />
Profit after tax 750.9 298.1 634.9 338.6 177.0 1 448.7 283.5<br />
Minority interests -4.5 -7.4 -1.0 -4.1 -1.2 -13.7 -0.2<br />
Net profit for the period 746.4 290.7 633.9 334.5 175.9 1 435.0 283.3<br />
Operating profit by product area (IAS)<br />
EUR million 1999 I/2000 II/2000 III/2000 IV/2000 2000 I/2001<br />
Magazine 306.0 86.1 87.1 127.9 56.7 357.8 98.1<br />
Newsprint 299.1 61.0 43.2 79.2 80.1 263.5 132.5<br />
Fine paper 238.2 148.1 148.4 167.7 164.7 628.9 152.7<br />
Packaging boards 247.7 114.3 95.3 129.1 13.5 352.2 113.5<br />
Timber 41.0 22.4 21.7 15.1 9.9 69.1 4.1<br />
Merchants 0.5 4.1 2.8 0.3 1.1 8.3 -0.5<br />
Forest 132.3 28.2 36.7 26.5 27.3 118.7 25.3<br />
Other -28.3 18.5 8.1 -8.6 -22.7 -4.7 -2.7<br />
Continuing operations Total 1 236.4 482.7 443.3 537.2 330.6 1 793.8 523.0<br />
Divested paper units 22.9 0.0 0.0 0.0 0.0 0.0 0.0<br />
Discontinued operations, Energy 140.1 26.9 550.6 0.0 0.0 577.5 0.0<br />
Operating profit Total 1 399.4 509.6 993.9 537.2 330.6 2 371.3 523.0<br />
Net financial items -266.6 -68.8 -96.5 -39.4 -88.2 -292.9 -121.8<br />
Share of results of associated companies 9.7 5.8 4.4 2.7 7.7 20.6 28.3<br />
Profit before tax and minority interests 1 142.5 446.6 901.8 500.5 250.1 2 099.0 429.5<br />
Income tax expense -391.8 -148.5 -266.9 -161.9 -73.1 -650.3 -146.0<br />
Profit after tax 750.7 298.1 634.9 338.6 177.0 1 448.7 283.5<br />
Minority interests -4.5 -7.4 -1.0 -4.1 -1.2 -13.7 -0.2<br />
Net profit for the period 746.2 290.7 633.9 334.5 175.9 1 435.0 283.3<br />
14 <strong>Stora</strong> <strong>Enso</strong> Interim Review
SHARES<br />
Closing price Helsinki, EUR Stockholm, SEK New York, USD<br />
Series A Series R Series A Series R ADRs<br />
January 11.40 11.25 99.00 102.00 10.55<br />
February 11.80 11.70 105.50 105.00 10.58<br />
March 10.60 10.74 96.50 98.00 9.25<br />
Trading volume Helsinki Stockholm New York<br />
Series A Series R Series A Series R ADRs<br />
January 268 855 39 171 154 445 589 36 213 250 3 907 200<br />
February 662 961 28 457 016 383 103 36 990 926 3 210 800<br />
March 1 139 490 48 983 467 1 037 696 40 262 981 2 530 200<br />
Total 2 071 306 116 611 637 1 866 388 113 467 157 9 648 200<br />
Market capitalisation on 31 March was EUR 9.9 billion on the Helsinki Exchanges.<br />
Number of shares outstanding A shares R shares Total<br />
Number of shares, 31 Dec. 1999 208 951 188 550 658 501 759 609 689<br />
New R shares subscribed, 26 Jan. 2000 246 000 246 000<br />
Share issue (Consolidated Papers Inc.), 11 Sep. 2000 167 367 577 167 367 577<br />
Conversion of A shares to R shares,16-27 Oct. 2000 -14 454 732 14 454 732 -<br />
Number of shares entered in the trade register, 31 Dec. 2000 194 496 456 732 726 810 927 223 266<br />
New R shares subscribed, 5 Jan. 2001 312 000 312 000<br />
New R shares subscribed, 16 Mar. 2001 964 201 964 201<br />
Shares cancelled as decided by AGM 2001 -910 600 -22 260 100 -23 170 700<br />
Number of shares entered in the trade register, 9 Apr. 2001 193 585 856 711 742 911 905 328 767<br />
Number of shares repurchased, 25 Apr. 2001 62 500 1 721 500 1 784 000<br />
Number of shares outstanding, 25 Apr. 2001 193 523 356 710 021 411 903 544 767<br />
New R shares subscribable against bonds with warrants 2 412 000 2 412 000<br />
New R shares in form of ADRs subscribable against<br />
<strong>Stora</strong> <strong>Enso</strong> North America option programme 4 715 424 4 715 424<br />
R shares owned by <strong>Stora</strong> <strong>Enso</strong>’s subsidiary, Merivienti Oy -5 591 -5 591<br />
• On 25 April 2001 <strong>Stora</strong> <strong>Enso</strong> Oyj held 62,500 Series A shares and 1,721,500 Series R shares, counter value EUR 3.0 million.<br />
This represents 0.2% of the company’s share capital and 0.1% of voting rights.<br />
• <strong>Stora</strong> <strong>Enso</strong>’s subsidiary Merivienti Oy holds 5,591 Series R shares, counter value EUR 9,504.70. This represents 0.0% of the<br />
company’s share capital and voting rights.<br />
Largest Shareholders as of 31 March 2001 % of shares % of votes<br />
Finnish State 14.8 23.8<br />
Investor AB 8.4 23.7<br />
Social Insurance Institution of Finland 3.0 9.0<br />
Sampo-Varma Group 1.1 3.8<br />
Varma-Sampo Mutual Pension Insurance Company 1.0 3.4<br />
Robur 4.0 1.4<br />
Ilmarinen Mutual Pension Insurance Company 0.9 1.1<br />
Erik Johan Ljungberg's Training Fund 0.7 0.9<br />
Suomi Mutual Life Assurance Company 0.2 0.8<br />
Knut and Alice Wallenberg Foundation 0.2 0.6<br />
10 largest in total 34.5 68.7<br />
<strong>Stora</strong> <strong>Enso</strong> Interim Review 15
The interim review for January – June will be published on 26 July 2001.<br />
It should be noted that certain statements herein which are not historical facts, including, without limitation those regarding expectations for market growth and developments;<br />
expectations for growth and profitability; and statements preceded by “believes”, “expects”, “anticipates”, “foresees”, or similar expressions, are forward-looking statements<br />
within the meaning of the United States Private Securities Litigation Reform Act of 1995. Since these statements are based on current plans, estimates and projections, they<br />
involve risks and uncertainties, which may cause actual results to materially differ from those expressed in such forward-looking statements. Such factors include, but are not<br />
limited to: (1) operating factors such as continued success of manufacturing activities and the achievement of efficiencies therein, continued success of product development,<br />
acceptance of new products or services by the Group’s targeted customers, success of the existing and future collaboration arrangements, changes in business strategy or<br />
development plans or targets, changes in the degree of protection created by the Group’s patents and other intellectual property rights, the availability of capital on acceptable<br />
terms; (2) industry conditions, such as strength of product demand, intensity of competition, prevailing and future global market prices for the Group’s products and the pricing<br />
pressures thereto, price fluctuations in raw materials, financial condition of the customers and the competitors of the Group, the potential introduction of competing products<br />
and technologies by competitors; and (3) general economic conditions, such as rates of economic growth in the Group’s principal geographic markets or fluctuations in<br />
exchange and interest rates.<br />
<strong>Stora</strong> <strong>Enso</strong> Oyj<br />
P.O.Box 309 • FIN-00101 Helsinki • Finland<br />
Calling address: Kanavaranta 1<br />
Tel. +358 20 46 131 • Fax +358 20 46 21471<br />
Graphic design: Incognito Design • Paper: <strong>Stora</strong> <strong>Enso</strong> MultiArt Silk 150 g/m 2 /Libris 2001<br />
www.storaenso.com<br />
www.storaenso.com/investors


