A. General Information - Marymount University
A. General Information - Marymount University
A. General Information - Marymount University

You also want an ePaper? Increase the reach of your titles
YUMPU automatically turns print PDFs into web optimized ePapers that Google loves.
Common Data Set 2011-2012<br />
B1<br />
B1<br />
B1 Men<br />
FULL-TIME<br />
Women Men<br />
PART-TIME<br />
Women<br />
B1 Undergraduates<br />
B1 Degree-seeking, first-time<br />
freshmen 132 270 3 4<br />
B1 Other first-year, degree-seeking 0 0 0 0<br />
B1 All other degree-seeking 495 1,187 79 180<br />
B1 Total degree-seeking 627 1,457 82 184<br />
B1 All other undergraduates enrolled<br />
in credit courses 1 2 8 12<br />
B1 Total undergraduates 628 1,459 90 196<br />
B1 Graduate<br />
B1 Degree-seeking, first-time 41 187 39 124<br />
B1 All other degree-seeking 70 263 125 367<br />
B1 All other graduates enrolled in<br />
credit courses 0 1 12 31<br />
B1 Total graduate 111 451 176 522<br />
B1 Total all undergraduates<br />
2,373<br />
B1 Total all graduate<br />
1,260<br />
B1 GRAND TOTAL ALL STUDENTS<br />
3,633<br />
B2<br />
B2<br />
Enrollment by Racial/Ethnic Category. Provide numbers of undergraduate students for each of the<br />
following categories as of the institution's official fall reporting date or as of October 15, 2011.<br />
Include international students only in the category "Nonresident aliens." Complete the "Total<br />
Undergraduates" column only if you cannot provide data for the first two columns. Report as your<br />
institution reports to IPEDS: persons who are Hispanic should be reported only on the Hispanic<br />
line, not under any race, and persons who are non-Hispanic multi-racial should be reported only<br />
under "Two or more races."<br />
Degree-Seeking<br />
First-Time<br />
First Year<br />
Degree-Seeking<br />
Undergraduates<br />
(include first-time<br />
first-year)<br />
Total<br />
Undergraduates<br />
(both degree- and<br />
non-degree-seeking)<br />
B2 Nonresident aliens<br />
25 224 226<br />
B2 Hispanic<br />
55 312 313<br />
B2 Black or African American, non-Hispanic<br />
79 353 353<br />
B2 White, non-Hispanic<br />
147 913 928<br />
B2 American Indian or Alaska Native, non-Hispanic<br />
0 4 4<br />
B2 Asian, non-Hispanic<br />
30 185 188<br />
B2 Native Hawaiian or other Pacific Islander, non-<br />
Hispanic<br />
1 10 10<br />
B2 Two or more races, non-Hispanic<br />
17 54 54<br />
B2 Race and/or ethnicity unknown<br />
55 295 297<br />
B2 TOTAL<br />
409 2,350 2,373<br />
Persistence<br />
B3 Number of degrees awarded from July 1, 2010 to June 30, 2011<br />
B3 Certificate/diploma 2<br />
B3 Associate degrees<br />
B3 Bachelor's degrees 583<br />
B3 Postbachelor's certificates 27<br />
B3 Master's degrees 420<br />
B3 Post-Master's certificates<br />
B3 Doctoral degrees –<br />
research/scholarship<br />
B3 Doctoral degrees – professional<br />
practice<br />
B3 Doctoral degrees – other 24<br />
Graduation Rates<br />
B. ENROLLMENT AND PERSISTENCE<br />
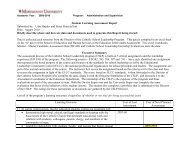
Institutional Enrollment - Men and Women Provide numbers of students for each of the following<br />
categories as of the institution's official fall reporting date or as of October 15, 2011. Note: Report<br />
students formerly designated as “first professional” in the graduate cells.<br />
CDS-B Page 3