FINAL VERSION FOR APPROVAL - Sdn Bhd - WWF Malaysia
FINAL VERSION FOR APPROVAL - Sdn Bhd - WWF Malaysia
FINAL VERSION FOR APPROVAL - Sdn Bhd - WWF Malaysia

Create successful ePaper yourself
Turn your PDF publications into a flip-book with our unique Google optimized e-Paper software.
Gunung Stong State Park Preliminary Management Plan<br />
Machang 54,400 58,040 71,584 79,032<br />
Tanah Merah 86,800 61,996 94,611 103,487<br />
Jeli 132,900 23,352 32,720 36,512<br />
Gua Musang 810,400 18,578 63,816 76,655<br />
Total 1,492,200 859,270 1,181,316 1,313,014<br />
Source: UPEN Kelantan (2001).<br />
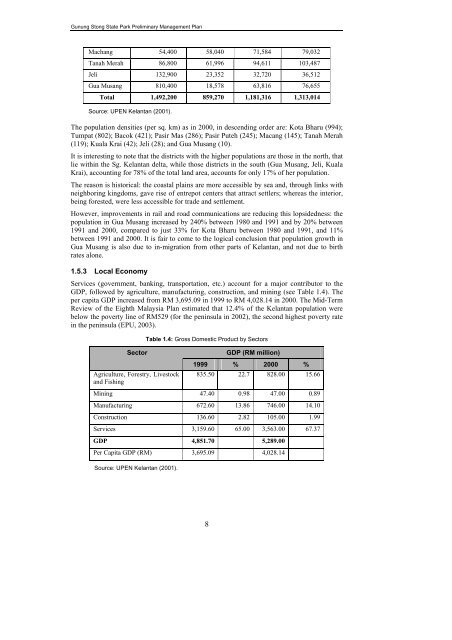
The population densities (per sq. km) as in 2000, in descending order are: Kota Bharu (994);<br />
Tumpat (802); Bacok (421); Pasir Mas (286); Pasir Puteh (245); Macang (145); Tanah Merah<br />
(119); Kuala Krai (42); Jeli (28); and Gua Musang (10).<br />
It is interesting to note that the districts with the higher populations are those in the north, that<br />
lie within the Sg. Kelantan delta, while those districts in the south (Gua Musang, Jeli, Kuala<br />
Krai), accounting for 78% of the total land area, accounts for only 17% of her population.<br />
The reason is historical: the coastal plains are more accessible by sea and, through links with<br />
neighboring kingdoms, gave rise of entrepot centers that attract settlers; whereas the interior,<br />
being forested, were less accessible for trade and settlement.<br />
However, improvements in rail and road communications are reducing this lopsidedness: the<br />
population in Gua Musang increased by 240% between 1980 and 1991 and by 20% between<br />
1991 and 2000, compared to just 33% for Kota Bharu between 1980 and 1991, and 11%<br />
between 1991 and 2000. It is fair to come to the logical conclusion that population growth in<br />
Gua Musang is also due to in-migration from other parts of Kelantan, and not due to birth<br />
rates alone.<br />
1.5.3 Local Economy<br />
Services (government, banking, transportation, etc.) account for a major contributor to the<br />
GDP, followed by agriculture, manufacturing, construction, and mining (see Table 1.4). The<br />
per capita GDP increased from RM 3,695.09 in 1999 to RM 4,028.14 in 2000. The Mid-Term<br />
Review of the Eighth <strong>Malaysia</strong> Plan estimated that 12.4% of the Kelantan population were<br />
below the poverty line of RM529 (for the peninsula in 2002), the second highest poverty rate<br />
in the peninsula (EPU, 2003).<br />
Table 1.4: Gross Domestic Product by Sectors<br />
Sector<br />
Agriculture, Forestry, Livestock<br />
and Fishing<br />
GDP (RM million)<br />
1999 % 2000 %<br />
835.50 22.7 828.00 15.66<br />
Mining 47.40 0.98 47.00 0.89<br />
Manufacturing 672.60 13.86 746.00 14.10<br />
Construction 136.60 2.82 105.00 1.99<br />
Services 3,159.60 65.00 3,563.00 67.37<br />
GDP 4,851.70 5,289.00<br />
Per Capita GDP (RM) 3,695.09 4,028.14<br />
Source: UPEN Kelantan (2001).<br />
8