B - St. Cloud State University
B - St. Cloud State University
B - St. Cloud State University

You also want an ePaper? Increase the reach of your titles
YUMPU automatically turns print PDFs into web optimized ePapers that Google loves.
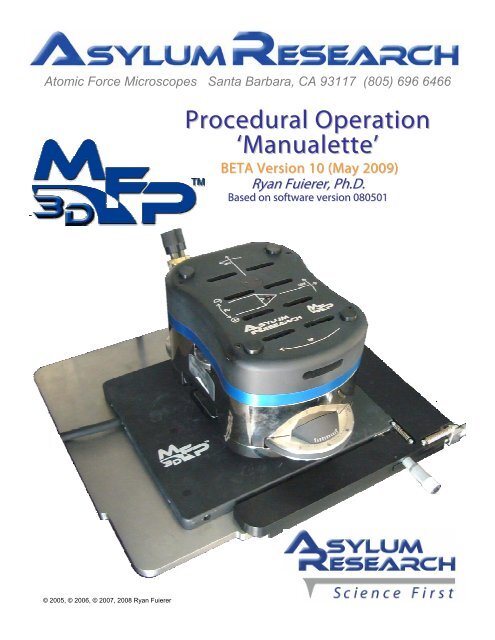
Atomic Force Microscopes Santa Barbara, CA 93117 (805) 696 6466<br />
Procedural Operation<br />
‘Manualette’<br />
BETA Version 10 (May 2009)<br />
Ryan Fuierer, Ph.D.<br />
Based on software version 080501<br />
© 2005, © 2006, © 2007, 2008 Ryan Fuierer
MFP-3D Procedural Operation ‘Manualette’ Version 10 (v080501; Igor 6.04A)<br />
ii<br />
1. Introduction to the MFP-3D<br />
3D<br />
2. Opening the MFP-3D<br />
3D software<br />
3. Loading the Probe<br />
4. Aligning the Laser<br />
5. Thermal Tuning<br />
6. AC mode Operation: 6.1 in Air; 6.2 In Fluid<br />
7. Managing Image Windows<br />
8. Contact Mode Operation<br />
9. Spring Constant Determination<br />
10. Basic MicroAngelo use<br />
11. Basic Force Spectroscopy<br />
12. Introductory Data Analysis<br />
13. ARgyle 3D Image Rendering<br />
14. Misc. Procedures<br />
16. Noise Measurements<br />
17. RF Quick Reference
Ryan’s MFP-3D Procedural Operation ‘Manualette’ Version 10 (v080501; Igor 6.04A);<br />
ix<br />
The purpose of this ‘Manualette’ is to offer new and infrequent MDP-3Dusers some supplemental<br />
documentation on how to procedurally operate an Asylum Research MFP-3D AFM. It’s like a manual, but<br />
more brief and to the point regarding basic ‘how-to’ operational procedures. It started off as a small document,<br />
and was termed the manualette. Its inception was to alleviate time spent training lab members during the<br />
author’s post doc days, but has evolved to this document in efforts to reduce the operational learning curve to<br />
achieve your efficiency.<br />
Also note that this instrument’s standard software is highly versatile, and describing even the most<br />
straightforward techniques in our user base is quite an undertaking. Adding the openness of the software, MFP-<br />
3D accessories (heaters, ORCA, VFM, etc.) and signal routing with the crosspoint switch, makes the instrument<br />
mind-numbingly versatile, and there may be a good chance it’s not described.<br />
It is assumed that the official MFP-3D manual has been perused. The MFP-3D is an expensive, high<br />
precision instrument, and should be treated with great care and common sense. AFM does take patience since<br />
it is an instrument that must be tuned and have proper sample preparation to be successful.<br />
A great effort has been made to ensure this manualette is as accurate as possible, but its accuracy and<br />
completeness cannot be guaranteed. Despite the best efforts by the author, this manualette may contain<br />
mistakes and the reader should use this only as a general guide for operation of the MFP-3D atomic force<br />
microscope, and is not the ultimate source of information about this instrument. The author assumes no<br />
responsibility for any damage whatsoever by persons or property that may result from readers undertaking<br />
operation of the MFP-3D.<br />
This Manualette:<br />
• Is broken down into sections that are in a (seemingly) logical progression for obtaining AFM images or simple<br />
force spectroscopy experiments, and the subsequent (basic) data analysis.<br />
• Only discusses operation of the MFP-3D itself, and does not include any optical microscopy techniques (if<br />
your MFP-3D happens to be sitting on an inverted optical microscope), or operation of electrical techniques or<br />
accessory modules at this time.<br />
• Is in continual development, so more insightful, updated versions will occur in the future. Version 10 by far is<br />
the largest and most comprehensive to date.<br />
If you are not familiar with Igor Pro, you should read through the ‘Getting <strong>St</strong>arted’ manual that comes with the<br />
software documentation. It’s a worthwhile use of a couple hours.<br />
The author also suggests when updating new software from Asylum, to read the ‘what’s new read<br />
me’ files; they are often very descriptive.<br />
The ‘MFP3D Help Files’ under the Igor Help menu are also very useful, especially for image<br />
analysis and display. The programmers write these for a reason, and are generally very<br />
insightful, yet sometimes not procedural- hence, the manualette.<br />
Some features of this manualette-<br />
-Any word in gray bold text in single quotes means it’s an execution button in the software; example ‘Simple<br />
Engage’, represents this button:<br />
The ▪ bullet points denote a new concept or comment.<br />
?
Ryan’s MFP-3D Procedural Operation ‘Manualette’ Version 10 (v080501; Igor 6.04A);<br />
x<br />
Checkmarks denote part of a procedure, typically these are set up in a series of instructions and are included<br />
to help guide the eye through specific operations.<br />
Blue text (accompanied by one of the little note icons in the margin) represents a Note or<br />
empirical trick- something the author has picked up along the way, and is included in<br />
efforts to reduce time to arrive at epiphany.<br />
These icons represent caution should be used to proceed.<br />
Advanced questions should be directed towards the excellent, friendly staff at Asylum Research via<br />
emails to: support@asylumresearch.com, which are forwarded to all of our technical people. It is<br />
company policy to respond to email within a 24 hour period.<br />
Have fun imaging! - Ryan
Ryan’s MFP-3D Procedural Operation ‘Manualette’ Version 10 (v080501; Igor 6.04A);<br />
xi<br />
The author would like to acknowledge all the inmates at Asylum Research who have<br />
answered the many questions between my post doctoral days when first starting to<br />
use the MFP-3D until now, allowing this document to be prepared and presented as<br />
accurately as possible. More than ¾’s of the company has been involved in the technology transfer.<br />
• The author is especially grateful to Scott MacLaren (UIUC material research lab) for taking the time to<br />
carefully edit this document, convey some interesting software techniques, provide valuable discussion<br />
and detailed descriptions of document typos and format issues that became transparent over time from<br />
excessive staring. Scott Rocks!<br />
http://cmm.mrl.uiuc.edu/staff/ScottM.htm<br />
• The author would also like to thank <strong>St</strong>efan Vinzelberg (Applications scientist with Atomic Force in<br />
Manheim Germany) for his particles program, and pedagogy.<br />
The author would not like to thank Keith Jones (AR applications scientist).
Ryan’s MFP-3D Procedural Operation ‘Manualette’ Version 10 (v080501; Igor 6.04A); 1.1<br />
to the MFP-3D components:<br />
Head: this is what contains the optical detection system and controls the Z piezo actuation of<br />
the cantilever; it contains thumbwheel adjustments to position the laser and zero the deflection on the position<br />
sensitive diode/ detector (PSD); the top view optics position knobs and focus wheel to view the tip from above;<br />
has three independent legs that adjust height of head relative to sample. Use two hands to lift the head due to<br />
its weight.<br />
Figure 1.1: MFP-3D head; ‘Extended’ Z range head shown<br />
Probe: the probe is what the entire tip/cantilever/substrate chip is called. The MFP-3D cantilever holder<br />
accommodates all major brands of commercially available probes.<br />
Probe<br />
substrate<br />
Tip<br />
Cantilever<br />
Figure 1.2: Anatomy of the Probe: entire assembly is called the probe (red ellipse).
Ryan’s MFP-3D Procedural Operation ‘Manualette’ Version 10 (v080501; Igor 6.04A); 1.2<br />
A<br />
B<br />
Figure 1.3: MFP-3D cantilever holder: A) older Kel-F design; B) newer<br />
PEEK filled glass design.<br />
Cantilever holder: this is what secures the probe chip; where the ‘shake’ piezo is housed. It snaps into the head<br />
via kinematic machine mount. The cantilever is held at an 11° angle to the surface.<br />
It consists of:<br />
-a Kel-F body (Figure 1.3A) or PEEK filled glass (tan colored; (Figure 1.3A)).<br />
-stainless steel tongue clamp to secure probe<br />
-quartz window for optical path where the laser bounces off the back of the cantilever & top view optics; pogo<br />
pins for shake piezo, applying bias to tip.<br />
Figure 1.4: MFP-3D base with XY scanner: A) <strong>St</strong>and alone base; B) Bio baseplate (not attached to<br />
inverted stage and without top view optics pillar).<br />
X,Y Scanner and Base: The flexure based 90 μm x 90 μm X,Y scanner sites on the base. The smaller holes in the<br />
scanner are where the 3 legs of the head go through to sit on the baseplate stage. The scanner can be manually<br />
moved relative to tip using the coarse translation micrometers (front right corner). Figure 1.4 shows a stand<br />
alone base, however, the MFP-3D can also be mounted onto a baseplate that sits on an inverted optical<br />
microscope frame.
Ryan’s MFP-3D Procedural Operation ‘Manualette’ Version 10 (v080501; Igor 6.04A); 1.3<br />
A<br />
B<br />
Figure 1.5: MFP-3D all digital controller: A) Original design; B) new ARC2 design<br />
(spring 2008).<br />
Controller: The digital controller contains a DSP and FPGA, and software controlled analogue ‘cross point<br />
switch’ for rerouting internal and external signals for custom experiments. The front panel of the controller is<br />
where: the power switch is; the key to turn the ‘laser’ on/ off; the ‘Hamster’ wheel is located to fine tune<br />
imaging/ control parameters; BNCs for advanced input/output signal access. The controller communicates with<br />
the PC via USB interface. There’s a lot more going on under the hood…
Ryan’s MFP-3D Procedural Operation ‘Manualette’ Version 10 (v080501; Igor 6.04A); 2.1<br />
Open the MFP-3D software; the launch icon is on desktop.<br />
▪ The software is fully loaded when Igor says it’s ready (lower left hand side of window). When Igor is busy, it<br />
doesn’t want to be interrupted and will ignore any subsequent requests until finished; while this is occurring,<br />
typically the ‘Abort’ button in the lower left of the MFP-3D software tray is present. The ‘Abort’ button can be<br />
clicked to abort a software request or calculation. This isn’t recommended during software boot up because it<br />
won’t load fully.<br />
▪ When the software is loaded, Igor will say ‘Ready’ instead of the ‘Abort’ button, and will look something like<br />
Figure 2.1, lower left.<br />
software version<br />
Open default image<br />
channels<br />
‘Setvar’ parameter windows<br />
S&D Meter<br />
‘Master’<br />
Panel<br />
Smart<br />
<strong>St</strong>art<br />
Master<br />
Channel<br />
Panel<br />
Command line<br />
Figure 2.1: Default MFP-3D software upon launching.<br />
History Window<br />
XOP version
Ryan’s MFP-3D Procedural Operation ‘Manualette’ Version 10 (v080501; Igor 6.04A); 2.2<br />
Other features of the MFP-3D software tray (see Figure 2.2)<br />
Igor Pro status- if Igor is ready to accept a<br />
software request from you, it will say ‘Ready’. If<br />
not, it’s thinking and the Abort Button is present<br />
with a rotating quartered circle.<br />
The Rescan button- push this when Igor gets<br />
confused- usually necessary if Igor freezes up, or<br />
when adding new components to the system<br />
(heaters, different cantilever holders which have<br />
identity resistors in them.<br />
Smart <strong>St</strong>art- this shows you what MFP-3D<br />
components are communicating with each other.<br />
Further more, individual information on each<br />
component can be accessed by expanding using<br />
the triangular button () to the right of each<br />
component icon<br />
1 2 3 4 5 6 <br />
Figure 2.2; The MFP-3D software tray:<br />
MFP-3D status- this will tell you if the instrument is ready, or if the controller or other hardware isn’t found,<br />
etc. If new hardware is plugged in, it will notify you as it reads the calibration files off the new hardware.<br />
Quick link to AR online support (AR engineers can control your MFP-3D over the web during online help<br />
sessions).<br />
CCD top view camera icon- click this to get camera screen to come up.<br />
7 MFP-3D XOP version<br />
NOTE: For more about having multiple version of the MFP-3D software on your machine, see Section 14.16, or<br />
go to http://www.asylumresearch.com/Support/FAQ3D.shtml#IgorCopy.<br />
Mode Master Panel-<br />
In versions after March of 2008, an additional panel during the MFP-3D software boot will appear with the<br />
Mode Master Panel (Figure 2.3)- this was created in efforts to make the software more user friendly for new our<br />
infrequent users. What’s great about the Mode Master is that it can be set up such that clicking on a technique<br />
reconfigures the panels to be parameter ready for the technique at hand. For example, clicking on the electrical<br />
then SKFM brings up the electrical tune panel and the NAP panel, along with the NAP channel panel.<br />
To use the Mode Master, just click on a function button- for example, say you want to imaging in Contact<br />
mode:<br />
Click ‘Topography’ button; this will bring up a panel with all the different topography acquisition modes.<br />
Click the ‘Contact Mode’ button; this will bring up all the parameters used for contact mode imaging (See<br />
Chapter 8).<br />
Mode master has undergone some improvements from earlier versions and it apparently more user friendly<br />
and remember spring constants and other calibration items that used to be reset when changing modes.
Ryan’s MFP-3D Procedural Operation ‘Manualette’ Version 10 (v080501; Igor 6.04A); 2.3<br />
Figure 2.3: MFP-3D Mode Master Panel simplifies parameter selection<br />
with preset or user defined parameters established prior. B) clicking on<br />
topography brings up a sub-panel allowing the user to select between<br />
different topography imaging modes. Each of these modes will<br />
reconfigure software parameters to best suit the experiment.
Ryan’s MFP-3D Procedural Operation ‘Manualette’ Version 10 (v0800501; Igor 6.03A); ©2008 3.1<br />
This section describes how to properly load a probe into the cantilever holder,<br />
and place the head onto the stage.<br />
Section Topic<br />
page<br />
3.1 Loading the Probe 3.1<br />
3.2 Placing head on scanner stage 3.3<br />
3.1: Loading the Probe:<br />
The MFP-3D cantilever holder accepts most brands of commercially available probes. The quartz window is<br />
resilient from tweezer scratches. It can be cleaned a variety of ways- see official MFP-3D manual. It can be found<br />
on the AR forum found under manuals and documentation:<br />
http://asylumforum.com/forum/showthread.php?t=372<br />
Load tip holder into loading pedestal apparatus (Figure 3.1A), which offers stability when loading tips. The<br />
cantilever holder has a kinematically machined ball bearing port that snaps into place using the lever on the<br />
apparatus and head port. If working in buffers or solvents that must be rinsed post experiment, the cantilever<br />
holder pedestal apparatus works great for rinsing the tip holder after imaging (i.e, so you don’t drop it into the<br />
rinsing collection container).<br />
Loosen tongue clamp screw with provide Phillips head screwdriver (it’s a right hand thread).<br />
A B C<br />
Optical window<br />
Probe<br />
D<br />
Image courtesy of Jeff Honeyman<br />
E<br />
Good Probe Position<br />
Bad Probe Position<br />
Figure 3.1: Proper probe loading: A) loading the cantilever holder into the cantilever holder stand. B)<br />
use tweezers to position cantilever in middle of polished quartz window. C) proper position of probe in<br />
quartz window. D) Proper position of probe in pocket; if too far back, probe slides on back ledge of<br />
pocket compromising deflection signal; E) Screw tongue clamp- no more than finger tight - with a<br />
Phillips (00x40) screwdriver.
Ryan’s MFP-3D Procedural Operation ‘Manualette’ Version 10 (v0800501; Igor 6.03A); ©2008 3.2<br />
Slide probe chip under tongue clamp. Position cantilevers so that they are centered (more or less) in the clear<br />
trapezoidal shaped quartz optical window (Figure 3.1B & C). The cantilever holder was designed to be resilient<br />
to scratching from tweezers, so don’t be paranoid. For best results, DO NOT push probe chip substrate all the<br />
way back in the pocket: it can cause the probe chip to lift off the floor of pocket, compromising the deflection<br />
signal (i.e., no signal). Figure 3.1D illustrates this schematically.<br />
Tighten the screw in the center of the stainless steel tongue assembly (NO MORE THAN finger tight!). This<br />
generally allows for suitable chip coupling to the tip holder. (Figure 3.1E)<br />
NOTE: DO NOT OVER TIGHTEN TONGUE CLAMP on cantilever holder- this can strip screw<br />
threads; or result in excessively bending the tongue, and cause some issues with obtaining<br />
suitable deflections between different Probe manufacturers or cantilever lines. If this does<br />
happen, the clamp can easily (yet gently & patiently) be bent back into place. (See Misc.<br />
Operations Section 14 to review this procedure.)<br />
Accommodating Thicker Probe Substrates:<br />
Often when switching between silicon probes to SiNx<br />
probes, the thickness difference offers some difficulty in<br />
gently sliding the probe chip under the tongue clamp near<br />
the hinge (not at end of tongue!- see Figure 3.2 )- this is because<br />
there is a thickness difference between the two types, and from<br />
manufacturer to manufacturer. If some resistance is felt, and the<br />
probe just won’t gently slide under the tongue clamp into the<br />
pocket, here’s what to do:<br />
GENTLY take tweezers or flat head screwdriver to GENTLY pry up<br />
on tongue near base (see tweezer placement in Figure 3.2.). Did I<br />
state GENTLY? The author’s experience is that it doesn’t even have to<br />
feel like the probe tongue clamp was moved at all. This is usually enough to allow new probe to slide under<br />
without resistance.<br />
As of spring 2009, there is no fix for the thinner Veeco probe substrates.<br />
Figure 3.2: GENTLY lifting tongue<br />
clamp to accommodate thicker probe<br />
chips.<br />
Install cantilever holder into MFP-3D head:<br />
Put cantilever holder into the MFP-3D head- the author finds it easiest to put the ball bearing on release<br />
lever side (red arrow, Figure 3.3 below) of the kinematic system first; then ease the holder in from the back.<br />
Make sure the cantilever holder is parallel to the top of the head; other wise it is not properly seated (see note<br />
below).<br />
Use extreme care when putting cantilever holder into the MFP-3D head. The ‘pogo’ pins used to<br />
get signals from the cantilever holder can be easily bent with excessive force (Figure 3.4 below).
Ryan’s MFP-3D Procedural Operation ‘Manualette’ Version 10 (v0800501; Igor 6.03A); ©2008 3.3<br />
Figure 3.4: Location of ‘pogo’ pins in<br />
head (red circles)<br />
Figure 3.3: Cantilever holder properly installed in MFP-3D head. The red arrow<br />
shows location of the button for the cantilever holder release lever.<br />
3.2: Placing Head on Scanner <strong>St</strong>age:<br />
A<br />
Once a probe is properly installed in the cantilever<br />
holder, the superluminescent diode (SLD) can be aligned<br />
on the stand next to the base (with kinematic machined<br />
leg divots) IF using the IR card,<br />
-ORover<br />
the sample IF using the CCD camera. To do the<br />
latter, the head must first be placed on the stage.<br />
A detailed description of aligning the SLD is described in<br />
Chapter 4.1A&B, for IR card and CCD camera,<br />
respectively.<br />
B<br />
Lift the head with two hands and place the back two<br />
legs in the kinematically machined divots on the MFP-3D<br />
baseplate (Figure 3.5A).<br />
Move hands so thumbs are under the front of head,<br />
and slowly lower head towards stage using back legs as<br />
pivot point; continually monitoring the tip – sample<br />
separation (Figure 3.5B) with your visual spectroscopy. If<br />
it looks as though the tip will crash, lift/ pivot head back<br />
Figure 3.5: Installing the head onto base plate over<br />
sample: A) use two hands to lift head, set back two legs<br />
onto base plate first; B) gently lower front leg down,<br />
constantly monitoring tip sample distance to avoid tip<br />
crash.
Ryan’s MFP-3D Procedural Operation ‘Manualette’ Version 10 (v0800501; Igor 6.03A); ©2008 3.4<br />
up and adjust legs down to increase tip-sample separation, and repeat process.<br />
▪ The top view CCD camera can also be monitored.<br />
▪ (if not choosing the SLD alignment via IR card route,) Once all three legs of the head are on the stage,<br />
align the SLD on back of cantilever, as described in Section 4.1B.<br />
When working in a fluid droplet or fluid dish, it’s more difficult to monitor this tip sample separationa<br />
safe approach is to have a great deal of distance (>200μm) between the two, and then use the CCD<br />
camera to monitor this approach. Figure 3.6 shows the meniscus created between tip and sample<br />
when plunging cantilever holder into fluid. See Section 6.2. for more on fluid imaging (AC<br />
mode). MAKE SURE NOT TO SUBMERGE CANTILEVER HOLDER IN FLUID!- See Figure 6.2.2B.<br />
A B C<br />
Fluid droplet<br />
meniscus<br />
Figure 3.6: Installing head over sample with fluid droplet: A) tip approaching droplet; B) Surface tension/ capillary<br />
forces connect fluid meniscus to cantilever holder; C) head is lowered until front leg is on stage. Be sure fluid meniscus<br />
stays around tip and sample to avoid scanner damage.
Ryan’s MFP-3D Procedural Operation ‘Manualette’ Version 10 (v080501; Igor 6.04A); 4.1<br />
This section describes multiple ways to align the ‘laser’ on the<br />
cantilever, and zero the Photodector prior to imaging. The<br />
‘laser’ is actually a super luminescent diode (SLD, emits at<br />
~860 nm), and will be referred to the SLD.<br />
Section Topic page<br />
4.1 SLD alignment 4.1<br />
4.1A via IR card 4.2<br />
4.1B via CCD camera 4.3<br />
4.2 Zeroing Photodector 4.6<br />
4.3 Troubleshooting 4.6<br />
4.1: SLD Alignment:<br />
There are two ways to initially (coarse) align the SLD on the cantilever: 1) use an IR card (described in Section<br />
4.1A); 2) use top view optics CCD camera*(described in Section 4.1B). Fine alignment involves using the LDX &<br />
LDY alignment thumbwheels to maximize the sum voltage in the S&D meter, and subsequently ‘zeroing’ the<br />
SLD spot on the photodiode detector (PD)- see Section 4.3.<br />
* for use top down view optics CCD camera only; there are MFP-3D heads out there with no top view optics<br />
Deflection (PD)<br />
adjustment<br />
Camera focus<br />
C<br />
B<br />
D<br />
E<br />
X-, Y- CCD<br />
camera<br />
translation for<br />
top view optics<br />
F<br />
A<br />
Engagement<br />
thumbwheel<br />
SLD<br />
adjustments<br />
Figure 4.1: AFM head with the various alignment thumbwheels labeled<br />
▪ The top of the MFP-3D head is conveniently labeled (Figure 4.1), including the orientation of the probe<br />
(with an LED being in the center of the triangular cantilever representation). The thumbwheel on the right<br />
moves the SLD along the length of the cantilever (LDX), while the one on the back of the head moves it across<br />
the cantilever (LDY). The head has arrows indicating which way the SLD will go as they are moved CCW. The<br />
left side of the head has a thumbwheel that adjusts the vertical deflection on the position sensitive<br />
photodiode (PD).
Ryan’s MFP-3D Procedural Operation ‘Manualette’ Version 10 (v080501; Igor 6.04A); 4.2<br />
Turn on the SLD by turning the key on the front of the controller 90º<br />
clockwise (CW; Figure 4.2). Some activity in the Sum Voltage value on<br />
the S&D meter will also occur.<br />
4.1A: SLD Alignment via IR card:<br />
(for use with heads without camera, or for the MFP purists):<br />
This is done on a stand that is kinematically machined for the legs, or a<br />
table top- i.e., not on top of the sample.<br />
Place the IR card under the tip holder. Figure 4.3 (below) attempts to<br />
depict the procession needed to align the SLD. If the SLD spot isn’t<br />
being blocked by anything, you can see it on the IR card. If you can’t<br />
see it, move the SLD spot (using the LDX thumbwheel on the right side<br />
of the head, ‘A’ in Figure 4.1) along the length of the cantilever until you do- Figure 4.4A shows the visible SLD<br />
spot on the IR card. If no spot is seen on the IR card, perhaps it may need charging for a few seconds under a<br />
fluorescent light.<br />
CAUTION: When adjusting any of the alignment thumbwheels, if<br />
you feel resistance turning them, DON’T FORCE IT- It’s probably<br />
at the end of its travel. If you over torque, it becomes very difficult<br />
to reverse its direction, OR the belt that is attached to the knobs<br />
to turn the pivot points on the optical assembly can get irreversibly<br />
screwed up, and it will have to be repaired at the factory. Use gentility<br />
when adjusting the LDX, LDY & PD knobs.<br />
Then follow this procedure:<br />
Move the SLD spot back onto the support chip via LDX thumbwheel (no<br />
spot visible- depicted in Figure 4.4B; or Action 1-Figure 4.3).<br />
Figure 4.2: laser power on face<br />
of controller<br />
Move SLD spot until you see it on the card (spot visible- like Figure 4.4A; or Action 2-Figure 4.3);<br />
▪If the SLD spot is outside the transparent quartz window, it won’t be visible on the IR card. This is indicated by<br />
the hatched area in Figure 4.3.<br />
Probe<br />
chip<br />
A<br />
B<br />
Figure 4.3: laser alignment pattern<br />
Figure 4.4: A) laser spot visible on IR card; B) laser spot not visible on IR<br />
card because it’s being blocked by probe substrate
Ryan’s MFP-3D Procedural Operation ‘Manualette’ Version 10 (v080501; Igor 6.04A); 4.3<br />
Now use the LDY thumbwheel on the back side of the head (‘B’ in Figure 4.1) to adjust the beam<br />
perpendicular to the length of the cantilever (Sweep 3, Figure 4.3) WHILE MONITORING THE S&D METER.<br />
There will be some activity (new value) in the ‘Sum’ Voltage on the S&D meter when the SLD crosses the<br />
cantilever.<br />
Maximize/ optimize the ‘Sum’ voltage signal using both LDX & LDY thumbwheels (Sweeps 4, Figure 4.3)<br />
Move the LDX thumbwheel out (CCW) along the cantilever until the ‘Sum’ voltage in the S&D meter<br />
decreases to a small value again- this means the SLD spot is off the end of the cantilever.<br />
Move the LDX thumbwheel (CW) so the ‘Sum’ voltage reappears again; stop at a maximum value. The goal<br />
is to place the SLD spot towards the end of the cantilever to maximize the optical lever sensitivity.<br />
Move the LDY thumbwheel slightly to maximize the ‘Sum’ voltage in the S&D meter.<br />
NOTE: for the most sensitivity in cantilever deflection, the SLD spot needs to be towards the end of<br />
the cantilever, as opposed to the base where it meets the probe chip. If the SLD spot is near the<br />
probe chip, the range of deflection won’t be as large, regardless of how large the Sum signal may be.<br />
See Figure 4.9 for visual example.<br />
▪At this point, SLD should be properly aligned.<br />
4.1B: SLD Alignment via top view CCD camera:<br />
This method is a great way to actually see where the SLD spot is relative to the cantilever. It is also (generally)<br />
necessary when working in fluid, especially with functionalized probes.<br />
▪ To actually see something with the CCD camera, the MFP-3D head needs to be over the sample. It’s a focus<br />
distance thing.<br />
BE SURE THERE IS ENOUGH ROOM BETWEEN SAMPLE AND TIP SUCH THAT IT DOESN’T CRASH AS THE<br />
HEAD IS PLACED OVER THE SAMPLE! If this does happen, the head won’t be damaged (it’s very robust), but<br />
the tip and sample will certainly be compromised.<br />
In the MFP-3D software, look for the CCD icon at the lower left tray of the MFP-3D software<br />
screen. If the fiber light is off, a black screen will come up in the software which is the video<br />
image.<br />
ccd icon<br />
Turn on the power to the fiber light; using the variable potentiometer knob, increase illumination until you<br />
can see the tip in the CCD window.<br />
FOR DUAL VIEW SYSTEMS ONLY: If the tip is<br />
not visible in the CCD image using a MFP-<br />
3D Dual View <strong>St</strong>and Alone system,<br />
perhaps the top view optics and illumination shutter<br />
are set for bottom view- go to the <strong>St</strong>and alone base<br />
and make sure both shutters are pulled out (See<br />
Figure 4.5). The author commonly makes this<br />
mistake.<br />
Figure 4.5: Top view optics on Dual View <strong>St</strong>and Alone base<br />
require illumination and camera shutters to be pulled out.
Ryan’s MFP-3D Procedural Operation ‘Manualette’ Version 10 (v080501; Igor 6.04A); 4.4<br />
The default CCD image in the software is for a composite (RCA) video cable jack (yellow plug;<br />
below left)- If you are using a MFP-3D Bio, the CCD uses a S-video (4 pin jack; below right).<br />
Click the ‘Source’ button at the top of the CCD software window (red circle), which will change from<br />
Composite to S-Video. These jacks can be seen in the MFP3D base, and at the PC.<br />
Figure 4.6: Click the ‘Source’ button to switch between composite/<br />
RCA video (stand alone bases), or S-Video (MFP-3D- Bio).<br />
Composite<br />
S video<br />
▪ To adjust the CCD image focus, use the thumbwheel in the optics housing on the back of the head (‘D’ in<br />
Figure 4.1): CCW move the focus towards the sample.<br />
▪ To adjust the location of the viewing field of the CCD camera, use the X and Y translation knobs on the back<br />
of the optics housing (‘E’ in Figure 4.1).<br />
▪ Aligning the SLD using the CCD camera uses an approach similar as with IR card, but you can see the SLD<br />
spot with relation to the cantilever.<br />
Using the LDX thumbwheel, move the SLD spot onto the back of the probe substrate- due to some<br />
diffraction thing I probably cannot explain (it is important that you see some elongation diffraction to the<br />
spot- this is the correct spot to use- see Figure 4.7A); If a spot without this elongation is seen (like the one in<br />
Figure 4.7B), it is the wrong spot and will give no ‘Sum’ voltage in the S&D meter even though there appears<br />
to be a spot on the end of the cantilever. A second example can be seen in Figure 4.10 at the end of this<br />
section.<br />
A<br />
B<br />
Figure 4.7: A) proper SLD spot with elongated appearance; B) SLD without elongation will<br />
give no appreciable Sum voltage. NOTE: spot on probe chip for demonstration only.<br />
• Certain focal planes can also give the appearance that the spot is not on the cantilever in the CCD image,<br />
when in fact it is because the Sum voltage in the S&D meter.
Ryan’s MFP-3D Procedural Operation ‘Manualette’ Version 10 (v080501; Igor 6.04A); 4.5<br />
If there is any question if the spot is aligned on the cantilever OR the probe substrate, there is a very<br />
easy way to tell- do a thermal tune! See Thermal Tuning (Section 5) for explicit instructions. If the SLD<br />
spot is on the Probe chip, there won’t be any resonant peak (with significant amplitude or Q) in the<br />
power spectrum.<br />
▪A second way to align the SLP spot using the CCD camera is to find the spot on the substrate- Scott<br />
Maclaren (MRL-UIUC) taught me this protocol.<br />
Turn the illumination down very low on the fiber light.<br />
Locate the SLD spot on the substrate- the author usually locates a diffracted spot that is along the same<br />
vector as the length of the cantilever. In Figure 4.8A, the actual SLD spot isn’t vary apparent (red circle), but<br />
the diffracted spot is in line with the cantilever vector. Please make exception to the author’s careless probe orientation<br />
in this example.<br />
Move LDX thumbwheel towards probe chip- the SLD spot is now reflecting off the cantilever (Figure 4.8B);<br />
there is a great deal of refracted light, presumably due to the low fiber light illumination level. Slight<br />
adjustment in LDY may also be needed to maximize ‘Sum’ voltage in S&D meter.<br />
▪ When increasing the fiber light illumination, the spot is more apparent, and the amount of refracted light in<br />
the CCD image decreases (Figure 4.8C).<br />
▪ Alternatively, you can sweep the SLD spot until it crosses the cantilever; then maximize ‘Sum’ voltage.<br />
A Diffracted B C<br />
spot<br />
Figure 4.8: Aligning SLD starting with spot on substrate via CCD camera: A) using low fiber light illumination,<br />
locate SLD spot on substrate; B) move LDX and LDY thumbwheels until SLD spot is on end of cantilever with<br />
maximized ‘Sum’ voltage: C) increased fiber light illumination reduces refracted light seen in CCD image.<br />
• Regardless of how the SLD spot is aligned on the back of the cantilever, what is desired is to have the spot<br />
towards the end of the cantilever to maximize the optical lever sensitivity (Figure 4.9A). When the spot is at<br />
the base of the cantilever (Figure 4.9B), the optical lever sensitivity decreases (i.e., InvOLS value increases- see<br />
Section 9.1, page 9.5).<br />
A<br />
B<br />
Figure 4.9: align SLD spot towards end of cantilever to maximize optical lever sensitivity;<br />
B) shows spot at base of cantilever, which yield low optical lever sensitivity.
Ryan’s MFP-3D Procedural Operation ‘Manualette’ Version 10 (v080501; Igor 6.04A); 4.6<br />
4.2: Zero Photodector (PD): Now look at the ‘Deflection’ voltage signal in the S&D meter-<br />
This meter window is set up rather conveniently: If you have red in the deflection meter, you need to go<br />
negative to adjust to ~0 V (towards blue). The top of the head is labeled to tell you what way to go (positive or<br />
negative; see Figure 4.1; label ‘C’).<br />
Use the PD thumbwheel (‘C’ in Figure 4.1) to do this: if the deflection value in the S&D meter is negative<br />
(blue), move thumbwheel CCW to get to ~0V; if the deflection signal is positive, move the PD thumbwheel CW<br />
to ~0V.<br />
If you are working in fluid, there will be some thermal gradient causing the deflection to drift- use<br />
the PD thumbwheel to adjust this back to ~0V before beginning your AFM application. Typically,<br />
the first 20 minutes in fluid show the most pronounced amount of Deflection drift due to system<br />
equilibration.<br />
4.3: TROUBLESHOOTING:<br />
No significant Deflection voltage, or very low Sum voltages: typically either the cantilever isn’t seated in<br />
the pocket well- perhaps some debris is acting as a fulcrum moving the orientation of the lever our of the<br />
proper plane;<br />
• Sometimes the probe is bad, or worse, there is no cantilever on the probe (verify in CCD camera).<br />
‘Digital Wrapping’ in the PD value: Say you are trying to zero the PD deflection from some ‘railed’ value in<br />
the deflection voltage in the S&D meter. No matter how much you turn the thumbwheel the way it’s<br />
supposed to go, the deflection doesn’t budge from that railed value (even if you go to the end of the travel<br />
and the thumbwheel starts to bind- AGAIN, DON’T FORCE IT!). What is likely occurring is something called<br />
‘digital wrapping’ of that deflection value.<br />
So here’s what to do-<br />
Reverse the thumbwheel direction such that the turn is towards the same sign as your displayed deflection<br />
in the S&D meter (i.e, lets say the deflection value is railed positive- turn PD thumbwheel towards the positive,<br />
instead of toward negative)- what you’ll find is at some point, the deflection sudden becomes railed negative;<br />
but the way it was displayed, it became wrapped to the positive. Then just keep thumbing the PD that way<br />
and it’ll easily be zeroed. This is hard to explain in text, but easy to fix practically.<br />
Reducing abuse on head cable:<br />
Be careful not to torque/twist the cable to head: always follow the<br />
same rotation path as you took head off with. The head cable should<br />
only experience 180º worth of rotation in its regular on stage, off stage<br />
cycling.<br />
Continual twisting of the head can:<br />
1) Break down the head cable over time (see Figure 4.10).<br />
2) Torque the cable such that mechanical noise is more easily coupled<br />
into the head b/c of the torque. This can also add thermal drift into<br />
your system.<br />
Figure 4.10: Excessive twisting of cable<br />
causes damage.
Ryan’s MFP-3D Procedural Operation ‘Manualette’ Version 10 (v080501; Igor 6.04A); 4.7<br />
A<br />
B<br />
Figure 4.11: Another example of the correct SLD spot in A), and the incorrect SLD spot in B). The difference in<br />
A) & B) is that the LDY thumbwheel was moved CW. In reality, the correct SLD spot in B) is just off the CCD<br />
camera field of view (it’d be below the image). NOTE: SLD spot displayed over probe chip to show entirety of<br />
diffraction pattern<br />
It is common that the system will experience some drift within the first 30 minutes or so- AR<br />
engineers think this may be mostly do to with the head "settling" into position in its kinematic<br />
mount. Internally acquired Drift vs. Temp graphs suggest the data from this period isn't very<br />
correlated with temperature, but more related to time, suggesting this settling.
Ryan’s MFP-3D Procedural Operation ‘Manualette’ Version 10 (v080501; Igor 6.04A); 5.1<br />
A Thermal tune is performed to determine the natural resonant frequency of the cantilever by monitoring the<br />
amplitude over a user defined frequency range. The MFP-3D uses the PD A/D converter to measure this,<br />
which can acquire frequencies up to 2.5 MHz.<br />
Thermal Tunes are mostly used for a few specific tasks:<br />
To determine the frequency of a cantilever for drive frequency selection for AC mode in air or fluid; OR<br />
higher resonance eigenmodes for DualAC imaging techniques.<br />
Is the second step in determining the spring constant (see Section 9 for the complete cantilever spring<br />
constant, k, determination protocol).<br />
Determining resonant frequency changes if the tip has picked up material (or has become broken).<br />
The Thermal tab is located in the Master Panel, seen in Figure 5.1.<br />
Figure 5.2: Power spectrum of typical AC 160 Si cantilever in air.<br />
Red arrow points to fundamental resonant frequency of cantilever.<br />
Figure 5.1: The Thermal tab.<br />
Figure 5.3: Pre thermal tune dialogue if PSD<br />
isn’t zeroed.<br />
Assuming a probe is properly loaded, SLD aligned and the PD zeroed, follow the below procedure to acquire a<br />
thermal tune of the cantilever-
Ryan’s MFP-3D Procedural Operation ‘Manualette’ Version 10 (v080501; Igor 6.04A); 5.2<br />
Click the ‘Do Thermal’ button; a power spectrum plot similar to the one in Figure 5.2 will appear,<br />
continuously averaging spectrums in real time. In this example, an Olympus AC 160 Si cantilever in air was<br />
used. The higher Q of the cantilever causes the sharp peak in air.<br />
▪ If the deflection isn’t zeroed, a dialogue like the one in Figure 5.3, will come up- don’t be alarmed: either click<br />
‘No’ and zero the PD, or if precision isn’t your top priority, click ‘Yes’ and continue. The reason to zero them is<br />
that PDs have more linear response in their center relative to their center. The author typically zeros the PD.<br />
▪ The user can limit the number samples acquired; generally a couple dozen is sufficient for most tasks unless<br />
the S/N ratio really matters in the application. Notice the baseline is mostly noise, but the one sharp line<br />
around 300kHz is the AC160’s resonant frequency (red arrow, Figure 5.2).<br />
Click ‘<strong>St</strong>op’ button to terminate the collection of power spectrums.<br />
The resolution of the acquisition can be changed in the resolution pull down menu of the Thermal<br />
tab. Larger numbers go faster (less resolution); while smaller values acquire slower, but give less noise.<br />
The way the data is plotted (i.e., linear vs. logarithmic) can also be changed in the ‘Graph Log’ pull<br />
down menu.<br />
The bandwidth of the Thermal tune can also be selected: the default parameter is 1MHz. To change<br />
this to a larger or smaller value, click the ‘Setup’ button in the Thermal tab, and activate the ‘Show’<br />
checkbox for the Frequency Range at the bottom of the panel. Use the Freq. Range pull-down to<br />
select other Thermal Power spectrum frequency ranges (Figure 5.4A). Since the Thermal plot is default<br />
to only 1MHz, increase the scale on the thermal plot by clicking on the X axis to bring up Igor’s ‘Modify<br />
Axis’ panel and manually increase the X axis to the desired range (Figure 5.4B).<br />
A<br />
B<br />
Figure 5.4: A) Selecting different<br />
frequency ranges for the power<br />
spectrum from the Freq. Range pull<br />
down menu; B) Use Igor Modify Axis<br />
Dialogue to manually increase<br />
frequency (X axis) range to display<br />
larger ranges, in this case, 2.5MHz.
Ryan’s MFP-3D Procedural Operation ‘Manualette’ Version 10 (v080501; Igor 6.04A); 5.3<br />
Thermal tune plots can be saved by -<br />
Clicking the ‘Save’ button at the top of the thermal plot. Saves as Igor graph (.pxp)<br />
From FileSave Graph Copy… in the Igor main menu. Saves as Igor graph (.pxp)<br />
Sent to a Layout as a graphic (see Section 14.13).<br />
Zoom into the area of the peak by right mouse clicking around the peak, then right or left click to see the<br />
menu shown in Figure 5.5A.<br />
Choose ‘Expand’; the result would look something like Figure 5.5B.<br />
A<br />
B<br />
C<br />
Figure 5.5: A) Full Spectrum thermal tune; B) Zoom of resonant peak; C) The ‘fit’ peak; Red arrows show ‘fit width’ cursors<br />
on power spectrum.<br />
Next, activate the Igor cursors (⊗,), by using Ctrl + i; the cursors come up in the bottom tray of the plot.<br />
Drag one of the cursors to the peak. The example in Figure 5.5B, cursor ⊗ was placed on the resonant peak<br />
– 79.192 kHz.<br />
Type the ‘X:’ value (~79 kHz is sufficient) in the Igor cursor tray into the ‘Zoom Center’ parameter of the<br />
Thermal Tab. Note the units in the tray are in Hz, while the units in the parameter box are in kHz.<br />
Click the ‘Show Fit’ checkbox ; a blue fit line should appear on plot<br />
Click the ‘Fit Guess’ button; a blue Fit function curve appears somewhere in the vicinity of the resonant<br />
peak. If it doesn’t, confirm that the ‘Zoom center’ setvar value is in a similar range as the resonant frequency<br />
peak.<br />
Click the ‘Try Fit’ button. The blue fit function curve should be fit to the resonant peak (Figure 5.5C);<br />
meanwhile the resonant frequency value and Q parameters in the Thermal Tab are updated.<br />
• Thermal tunes work very well for determining the resonant frequencies (and ultimately drive frequencies) of<br />
cantilevers in fluid. See Section 6.2.2: ‘AC mode imaging in-fluid’ for this protocol.
Ryan’s MFP-3D Procedural Operation ‘Manualette’ Version 10 (v080501; Igor 6.04A); 5.4<br />
The thermal tune is also a very convenient way to check whether the SLD spot is on the cantilever<br />
(when aligning SLD via IR card, sometimes a nice sum is given when the spot is on the probe<br />
substrate).<br />
▪ Figure 5.6 (right) shows and example of a thermal<br />
tune when the SLD was on the back of the probe chip,<br />
yet a reasonable Sum voltage was displayed in the<br />
S&D meter.<br />
Figure 5.6: Thermal tune of SLD spot on back of probe<br />
chip - no apparent cantilever resonant frequency.<br />
▪ Figure 5.7 shows two cases in which a thermal tune can tell you what has happened if the resonant<br />
frequency changes throughout an imaging experiment. If the tip breaks (lowering mass, increasing f o ; Figure<br />
5.7A), or if there is an increase in mass on the cantilever/ tip from adhered debris (lowering f o ; Figure 5.7B).<br />
A<br />
B<br />
Figure 5.7: SEM images of compromised tips: A) broken tip, will shift f o to higher value;<br />
B) debris on tip will add mass, shift f o to lower value.
Ryan’s MFP-3D Procedural Operation ‘Manualette’ Version 10 (v080501; Igor 6.03A); ©2008 6.1<br />
AC mode imaging is one of the most commonly used imaging modes in AFM. This section will discuss how to<br />
select a cantilever drive frequency, pre-engagement imaging parameters, tip engagement, and fine tuning<br />
the imaging parameters for artifact free images. See Section 7 for changing the appearance of the image<br />
windows and saving image files. Due to the different skills that need to be used during imaging in either air or<br />
fluid, this Section has been broken down into subsections:<br />
Section Topic page<br />
6.1 AC mode imaging in AIR 6.1<br />
6.1.1 Auto Tuning 6.2<br />
6.1.2 Tip engagement 6.3<br />
6.1.2A Hard Engagement 6.4<br />
6.1.2B Gentle Engagement 6.5<br />
6.1.3 Tuning Imaging Parameters 6.6<br />
6.1.4 Monitoring Phase in AC mode 6.8<br />
6.1.4A Repulsive Mode Imaging 6.11<br />
6.1.4B Attractive Mode Imaging 6.13<br />
6.1.5 DualAC 6.17<br />
6.2 AC mode imaging IN FLUID 6.21<br />
6.2.1 Preparing for In Fluid Imaging 6.21<br />
6.2.2 Aligning the SLD 6.23<br />
6.2.3 Determining Drive Frequency In Fluid 6.23<br />
6.2.4 Tip Engagement in fluid 6.26<br />
6.2.5 Tuning Imaging Parameters 6.27<br />
6.2.6 In Fluid Precautions 6.29<br />
6.1: AC Mode Imaging in Air:<br />
The Main Tab of the Master Panel is where most of the parameters for<br />
imaging are found (Figure 6.1, right). The important parameters to tune<br />
will be Set Point voltage, Integral Gain, Drive Amplitude, Scan Rate<br />
(highlighted in red, Figure 6.1.1), and Scan Angle.<br />
From Main tab in the Master Panel, confirm that ‘AC mode’ is selected<br />
from the imaging mode pull-down menu (Figure 6.1.1). AC mode is the<br />
default imaging mode.<br />
Figure 6.1.1: Main Tab for imaging<br />
parameters<br />
▪ The ‘Hamster’ wheel (on the front of the controller, Figure 1.5) can control/ precisely fine tune parameters<br />
activated by the radio buttons. Radio buttons can be seen in Figure 6.1.1 as the circular features to the riht of<br />
certain parameter setvar windows (i.e., Scan Size, X&Y Offsets, Set Point, Gain, Drive Amplitude, Drive Freq.);<br />
specifically, the Set Point voltage radio button is activated, indicated by a green center dot.<br />
The first thing that needs to be done in AC mode imaging is to select the tip’s oscillatory drive frequency<br />
during imaging- assuming a cantilever is loaded & the SLD properly aligned, follow the below procedure to<br />
obtain AC mode images in AIR.<br />
Adjust the Deflection voltage (PD thumbwheel on the head; Figure 4.1) to ~ 0V (no color in deflection<br />
voltage S&D meter) for AC mode.
Ryan’s MFP-3D Procedural Operation ‘Manualette’ Version 10 (v080501; Igor 6.03A); ©2008 6.2<br />
6.1.1: AUTO TUNING:<br />
Open the Tune tab of the Master Panel (Figure 6.1.2).<br />
Choose a Target Amplitude of 1.0V. This means what it takes to drive<br />
the oscillate the cantilever so there is 1.0V worth of sine wave on the PSD.<br />
NOTE- For sharp tips (i.e., spikes or other expensive probes),<br />
1.0V worth of free air amplitude may be too much because the<br />
tip will be hitting the surface with more force then it might<br />
prefer- INSTEAD, choose a Target Amplitude of 300 mV or so.<br />
Proceed with the following directions, but adjust the set point<br />
(amplitude) voltage ratio accordingly.<br />
Change the ‘Target Percent’ to -5.0 %; however, depending on your<br />
application, you can assign it to any other user defined value within<br />
reason. The description below was written with -5% in mind. The minus<br />
sign indicates that the drive frequency will be on the left side of the<br />
resonant peak, which helps ensure the tip will remain in repulsive mode<br />
when engaged (see Section 6.1.4, 6.1.4A for further description of<br />
repulsive mode).<br />
The default Auto Tune ‘High’ and ‘Low’ values are ~50 kHz to 400 kHz,<br />
respectively, accommodating most (fundamental) drive frequencies for<br />
common commercially available AC mode cantilevers (in air).<br />
Click the ‘Auto Tune’ button; the frequency sweep commences.<br />
Figure 6.1.2: Tune Tab.<br />
▪ An Auto Tune plot similar to the one(s) in Figure 6.1.3 appears- initially one appears momentarily that is<br />
similar to Figure 6.1.3A; then updates to one similar to Figure 6.1.3B. The software automatically picks a Drive<br />
Frequency at a Target Percent of -5% (left side) of peak maximum at the (minimum) Drive Amplitude needed<br />
to make a 1.0 V amplitude, displayed in the S&D meter. The left side of the peak will ensure that the tip<br />
experiences net repulsive forces with the sample as it interacts with the surface.<br />
A<br />
B<br />
Figure 6.1.3: Auto tune of an Olympus AC160 Si (f~300kHz; k= 40N/m) cantilever in air: A) Early stages of<br />
Auto Tune; B) final result of Auto Tune.
Ryan’s MFP-3D Procedural Operation ‘Manualette’ Version 10 (v080501; Igor 6.03A); ©2008 6.3<br />
▪ The ‘Target Amplitude’ & ‘Target Percent’ setvars can be defined by the user, depending on the application<br />
(i.e., repulsive or attractive mode imaging, see Section 6.1.4). The Drive Frequency value will automatically be<br />
updated in the Tune and Main tabs of the Master Panel, and the Q (quality factor) of the cantilever is<br />
determined, displayed at the top of the Cantilever Tune plot in and the Tune tab.<br />
Tune plots can be saved by -<br />
Clicking the ‘Save’ button at the top of the thermal plot. Saves as Igor graph (.pxp)<br />
From FileSave Graph Copy… in the Igor main menu. Saves as Igor graph (.pxp)<br />
Sent to a Layout as a graphic (see Section 14.13).<br />
If using high aspect-ratio tips, there is a chance the Q (Quality factor) of the cantilever will be so high<br />
that the drive amplitude will be very low, and an error message comes up during the Auto Tune that<br />
says it’s having difficulty completing the Auto Tune. There are a few different things you can do to get<br />
around this:<br />
Manually increase the Drive Amplitude in the Tune tab, click the ‘One Tune’ or ‘Auto Tune’ button and it<br />
should work. Also click ‘Center Phase’ if using ‘One Tune’.<br />
Use Negative Q gain: a description of this is seen in section 6.1.4B.<br />
The coupling to the tip may not be sufficient most likely due to the probe chip being seated improperly in<br />
the pocket under the tongue clamp.<br />
▪ The teal colored curve is the Phase angle of the cantilever, which is set to 90 º at the resonant frequency<br />
value. Notice the Amp, Freq and Q values at the top of the panel are the values calculated for the largest peak<br />
within the Sweep Width (in Figure 6.1.3B’s case, 5 kHz, defined in the Tune tab), and are updated in the Tune<br />
tab of the Master Panel. Also notice the black vertical line represents the Target Percent amplitude (in this<br />
case: -5% of the resonant frequency, at 1.0V free air amplitude voltage).<br />
No idea what the resonant frequency is of your cantilever is?<br />
NO problem! (although not normally necessary, unless doing some higher eigenmode<br />
application)- Perform a Thermal Tune first to (roughly) determine the resonant frequency of the<br />
cantilever, as described in the Section 5. In brief: Perform a Thermal Tune; Bring up the Igor<br />
cursors (⊗,) with Crtl + i; Select the frequency of the fundamental peak; Read value from<br />
Igor cursor tray, confirm this frequency value falls within Auto Tune ‘High’ and ‘Low’ values in Tune tab; <br />
Click ‘Auto Tune’ button, as described above.<br />
▪ At this point, the S&D meter has a ‘free air’<br />
amplitude of 1.0 V (~ +/- 0.02 V), and the Phase value<br />
in S&D meter gives the ‘free air’ value of the phasethis<br />
latter value will be important when tuning the<br />
parameters to avoid mode hopping artifacts. A post<br />
auto tune example of what the S&D meter looks like<br />
is shown in Figure 6.1.4. If the ‘Engage’ button hasn’t<br />
been activated since starting the software, there<br />
usually isn’t any Z voltage color meter present,<br />
although it may say 70V (Figure 6.1.4- don’t be<br />
alarmed by this).<br />
Figure 6.1.4: S&D meter after an Auto Tune; before tip<br />
engagement
Ryan’s MFP-3D Procedural Operation ‘Manualette’ Version 10 (v080501; Igor 6.03A); ©2008 6.4<br />
6.1.2: TIP ENGAGEMENT:<br />
Once a drive frequency has been selected, the next step is to select the pre-engagement imaging parameters<br />
(mainly the Set Point voltage ratio to Free Air amplitude voltage) that the feedback loop will maintain during<br />
imaging. There are two approaches to this- the ‘Hard’ engage; or the ‘Soft’ or gentle engage. The latter is the<br />
preferred methods among the Asylum inmates.<br />
▪ When doing a Hard engage, pick some percentage (like 20%) of the ‘free air’ amplitude voltage (i.e., the preengagement<br />
amplitude value found in the S&D meter) that will engage the tip on surface. Although it is quick<br />
and easy, there are some disadvantages to the ‘Hard’ engage, like truncating the tip to some degree as it<br />
snaps into contact with the surface during engagement.<br />
▪ When doing a Soft engage, a very small percentage of the free air amplitude is used as the Set<br />
Point voltage (like 5%), falsely engaging the tip (on the water and compressed air layer between tip<br />
and sample); the Set Point voltage is then finally lowered using the setvars or Hamster wheel to<br />
some smaller percentage to induce a ‘Hard’ engage.<br />
THE ADVANTAGE OF THE SOFT ENGAGE is the tip engages at the absolute lowest Set Point FORCE,<br />
preserving the tip’s apex. Both will be discussed below-<br />
BUT FIRST, here’s something to give an idea about choosing Set Point Voltages-<br />
▪ A qualitative relationship between Free Air Amplitude voltage, Set Point Amplitude voltage and relative<br />
force applied by the tip amplitude vs. tip-sample distance in AC mode is depicted in Figure 6.1.5 below.<br />
The graph shows that as the Set Point voltage is decreased (at constant Drive Amplitude), the tip applies more<br />
force to the sample. The Y axis can be thought of a Set Point voltage percentage of the free air amplitude,<br />
where 0% would be the ‘free air’ (cantilever not dampened) amplitude voltage, and 100% would be 0V.<br />
The two different approaches to engaging the tip are described below-<br />
Figure 6.1.5: A qualitative conceptual amplitude voltage vs. tip-sample distance for AC Mode imaging. Lower set point values<br />
result in higher tip-sample force; higher set point values result in lower tip-sample forces.<br />
NOTE: This plot is not to scale, nor is actual data.
Ryan’s MFP-3D Procedural Operation ‘Manualette’ Version 10 (v080501; Igor 6.03A); ©2008 6.5<br />
6.1.2A: Hard Engage:<br />
A good Set Point voltage to use is ~20% of the free air; For example, if the free air amplitude is 1.0V, 20% of<br />
that is 800mV (coincidentally, that is the default Set Point used). With larger Set Point percentages, you’ll<br />
notice more of a ‘Snap’ to contact upon engagement with the Z piezo voltage in the S&D meter, which is<br />
likely to truncate the tip’s apex (to some degree), ultimately compromising the lateral resolution of the<br />
imaging.<br />
Choose an Integral gain of 8 to 10. This allows the feedback loop to be plenty responsive enough as the tip<br />
engages with the surface.<br />
The Drive amplitude was chosen by the software in the Auto Tune step. Different cantilevers will give<br />
different voltage values to achieve this Target amplitude during the Auto Tune.<br />
Choose a scan rate of ~ 1Hz. If it’s a soft / delicate, or very rough sample, choosing a slower scan rate is a<br />
good idea.<br />
Click the ‘Engage’ Button on the S&D meter; you’ll<br />
notice the Z piezo voltage will increase to 150V,<br />
meaning it’s fully extended anticipating the Set Point<br />
voltage to be reached (activating feedback loop).<br />
Fully extended<br />
Wheel the thumbwheel on the front of the MFP-3D head counterclockwise. As the tip nears the surface,<br />
the Amplitude voltage value on the S&D meter will decrease until it reaches the same voltage as the userdefined<br />
Set Point. At this point, there is a concomitant chime sound (if speaker volume up), and the Z piezo<br />
voltage will go from 150 V to some lesser value (less red on the S&D meter). As the thumbwheel is further<br />
turned CCW, the Z piezo voltage will decrease (i.e., piezo is retracting) because the feedback loop is<br />
maintaining the user defined Set Point voltage relative to Piezo position in its range. Adjust the Z piezo to ~<br />
70V such that the piezo is in the middle of its travel.<br />
▪If the sample is reflective, the shadow of the cantilever can be seen in the top view CCD camera image as it<br />
approaches the surface. See Section14.5 for an example of this.<br />
▪ If you have a surface with deep holes on a plateau, adjust the Z piezo voltage such that it is more retracted<br />
upon engagement, allowing the tip to have the range to plunge into the holes during scanning (presuming<br />
the tip apex is small enough). The opposite approach can be used for surfaces with very large features.<br />
▪ The Z voltage value is the way to qualitatively monitor how far the piezo is retracted or extended in its<br />
overall travel range (e.g. 70V is in the middle of its range).<br />
▪ At this point, the tip is just sitting on the surface, with the feedback loop maintaining the user defined Set<br />
Point voltage/amplitude/force.<br />
▪ To begin imaging: See Subsection 6.1.3 for how to fine tune the imaging parameters (Set Point, Drive<br />
Amplitude, Scan Rate, & Integral Gain) while monitoring the images and scan (re)traces to obtain best<br />
possible, non-artifact laden image.
Ryan’s MFP-3D Procedural Operation ‘Manualette’ Version 10 (v080501; Igor 6.03A); ©2008 6.6<br />
6.1.2B: SOFT/ Gentle Engagement: If<br />
you want to engage at the very lowest Set Point<br />
force possible (because you are using a<br />
modified/ functionalized tip; or an expensive,<br />
super-sharp tip; OR just want the best XY<br />
resolution achievable with a given tip) the MFP-<br />
3D is perfect for it. <strong>St</strong>art with a false<br />
engagement, then lower the Set Point voltage<br />
to truly engage on the surface.<br />
Here’s how to do it-<br />
A<br />
B<br />
Figure 6.1.6: A) Activating radio label in Main tab; B) using<br />
Hamster wheel.<br />
Perform an Auto Tune (Section 6.1.1).<br />
Set the Set Point voltage for about 5% of the free air amplitude voltage (i.e., for a 1.0 V free air amplitude,<br />
use a Set Point voltage of 950 mV; Figure 6.1.6A).<br />
Click ‘Engage’ button, as you normally would. Slowly turn the front thumbwheel CCW while monitoring the<br />
amplitude voltage (S&D meter), waiting for it to equal the Set Point voltage, at which point the feedback loop<br />
is engaged.<br />
▪ Now the feedback loop is activated, However, this engagement is a false engagement- the tip is engaging<br />
on the (inherent) water layer and compressed air between the tip and sample.<br />
Adjust the Z piezo voltage to ~30 to 50 V (halfway blue). You’ll notice the Z piezo voltage seems to<br />
float/drift as you move the thumbwheel- that’s because it’s falsely engaged!<br />
With the radio label for the Set Point voltage activated (use mouse cursor in Figure 6.1.6A, or use toggle<br />
switch on front of controller), use the ‘Hamster’ wheel on front of controller to increase the force (i.e., decrease<br />
Set Point voltage value- Figure 6.1.6B); the Z piezo voltage will move to some more positive voltage value<br />
(more red). At some point, you will see a ‘hard’ engagement in the Z piezo; continuing to decrease the Set<br />
Point value, you’ll notice the Z piezo will no longer move to some more positive value; additionally, there<br />
usually is some concomitant phase decrease.<br />
▪ At this point, the tip is ‘hard’ engaged on the surface, It has been engaged at the lowest possible Set Point<br />
force possible, therefore preserving the tip shape. It is stationary on the surface, waiting to be told to scan.<br />
The stiffer the cantilever, the harder it is to do a gentle engage. When this occurs, you can engage in attractive<br />
mode with a low amplitude, then switch it back to repulsive mode once the surface is found. See section<br />
6.1.4B for attractive mode description and parameter setup.<br />
Is the acoustic hood hatch still open?- Probably. Follow this to<br />
preserve the tip’s apex while shutting the door:<br />
Use the Hamster to increase the Set Point voltage to pop the tip off the<br />
surface (apparent in the Z voltage value(S&D meter);<br />
Close the hood door;<br />
Decrease the Set Point voltage with the Hamster again to hard engage;<br />
Proceed scanning. Publish Data/ acknowledge AR in experimental.
Ryan’s MFP-3D Procedural Operation ‘Manualette’ Version 10 (v080501; Igor 6.03A); ©2008 6.7<br />
6.1.3: TUNING IMAGE PARAMETERS:<br />
Once the tip is engaged on the surface, imaging can commence-<br />
Click the ‘Do Scan’ button, or ‘Frame Up’ or ‘Frame Down’ button on the Main tab of the Master panel. This<br />
will move the tip to the corner of the scan area, and begin scanning. There will be an initial time out while Igor<br />
is busy executing the command. (Notice that the parameter increase/decrease arrows are not present while<br />
Igor is busy executing a parameter change).<br />
▪ Once scanning commences, the tip’s tracking of the surface tip is generally very poor. This can be seen in the<br />
individual Trace and Retrace fast scan lines below each of the image channels, sometimes called<br />
‘parachuting’- where one side of the feature has very poor tracking; notice the opposite trace has the<br />
parachuting occurring on opposite side. Figure 6.1.7 shows this poor tracking of a calibration grid, and what is<br />
adjusted to improve the tracking.<br />
▪ Typically, three parameters should be adjusted first, in some combination depending on preference:<br />
▪ The Set Point voltage generally must be adjusted, especially after doing a soft engage (because of the low<br />
set point force being maintained by the feedback loop). Decreasing the Set Point voltage value increases the<br />
force applied to the sample (Figure 6.1.5). Higher Set Point voltages (lower force), will help preserve the tip<br />
apex, but may not allow proper tracking of the surface.<br />
Adjusting the Set Point Voltage to more than 50% of the free air amplitude voltage doesn’t really<br />
help apply more force. Beyond that, the cantilever isn’t really acting far from a simple harmonic<br />
oscillator anymore.<br />
▪ The Drive Amplitude can also be adjusted to increase the amount of Drive Amplitude applied to the shake<br />
piezo (and hence, cantilever); advantages of increasing this can be maintaining the tip in repulsive or<br />
attractive mode (See section 6.1.4), or when imaging sticky samples- the larger amplitudes help the tip escape<br />
the forces of the sample.<br />
Use the setvar arrows (to the right of a parameter setvar window), or the<br />
‘Hamster’ wheel with activated radio button (red circle, right), to fine tune<br />
any of these tuning<br />
?<br />
Want to know the actual amplitude distance (peak to peak on the PSD) that the<br />
cantilever is oscillating?<br />
the InvOLS of the cantilever must be known (see Chapter 9- Spring Constant<br />
Determination ). For example, say at a single instance, the amplitude reading the<br />
Sum & Deflection meter is 560 mV, and the cantilever with an InvOLS of<br />
56.43nm/V; then the peak to peak distance conversion is:<br />
Actual Cantilever Amplitude (peak to peak)= (0.560V)(56.43 nm/V)= 31.6 nm.<br />
▪ Some AR applications scientists adjust Drive Amplitude first- it’s a personal preference. The trade off by<br />
increasing the Drive Amplitude is beating the tip apex harder against the surface causing oscillations in the<br />
image (especially at feature edges); The tradeoff of lowering the Set Point voltage is applying more force to<br />
the sample (refer to Figure 6.1.5).
Ryan’s MFP-3D Procedural Operation ‘Manualette’ Version 10 (v080501; Igor 6.03A); ©2008 6.8<br />
▪ The Integral Gain should be adjusted such that the surface is tracking well; things to avoid are decreasing it<br />
to a value that doesn’t allow the feedback to track the surface well, OR too high that oscillations are apparent<br />
in the image and trace/retrace scan lines below the images. When adjusting the Integral gain, monitor the<br />
amount of noise in the Amplitude Image- feedback oscillations are easily seen in the image since because it’s<br />
an image of the feedback loop error.<br />
▪ One of the best approaches to adjusting the Integral gain is to increase it until there is a ‘ringing’ seen in the<br />
(re)Traces lines below the height image. Then decrease it until this ringing goes away.<br />
• Some people adjust the Integral gain first before adjusting drive amplitude or Set Point Voltage.<br />
Adjusting the ‘Proportional’ gain doesn’t generally improve the imaging- this is because the<br />
frequency range of the scanner is below the range where the proportional gain contributes. It’s best<br />
to keep proportional gain at zero. The exception to this rule is when very large sharp topography<br />
features are present where the feedback loop needs to react very quickly to the surface.<br />
Monitor how the tip’s tracking improves by looking at how well the trace and retrace line scans compare to<br />
each other. Note that they do not have to overlap exactly (because they are slightly offset in the software<br />
display), but they should have similar shapes/slopes per given surface feature.<br />
The following imaging parameters can be used to further improve tuning parameters-<br />
▪ The Scan Rate is a parameter you can adjust to also improve image quality. Slowing the Scan Rate down can<br />
help the feedback keep up with the image features. The Scan Rate cannot be updated on the fly (during<br />
imaging) like the aforementioned imaging parameters. You must click ‘Frame Up’ or ‘Frame Down’ buttons<br />
to initiate the newly entered scan rate. Keep in mind that too slow a scan rate can introduce image artifacts<br />
due to drift (if system isn’t higher equilibrated, which is typically unlikely unless a day of equilibration has<br />
occurred in a very stable room).<br />
▪ The Scan Angle is something that can be also be adjusted. Sometimes changing the scan angle can reduce<br />
the havoc imparted on a cantilever; or changing the scan angle slightly to scan along or orthogonal to a high<br />
aspect ration surface feature. This parameter can be changed on the fly.<br />
The Delay Update checkbox allows the user to change the<br />
parameters during a scan, which will take effect at the end of that scan.<br />
During the period before update, the parameters changed will be<br />
highlighted in a light blue color. Notice that setvar without radio labels,<br />
these highlights also occur because these values only take effect when<br />
the frame is finished (e.g. scan rate).<br />
•It’s also great for changing the number of scan lines and points on the fly.<br />
-Without the Delay Update checkbox activated, the tip has to be withdrawn to change either the Scan<br />
Lines or Scan Points setvar values. The author is superstitious enough, and has had experiences where the tip<br />
is somehow changed during this withdraw step.<br />
-However, with the Delay Update checkbox activated, these parameters can be changed, then click the<br />
‘Frame Up’ or ‘Frame Down’ buttons to activate this new change- Notice the tip stays on the surface (S&D<br />
meter- Z piezo voltage). This makes scanning the surface at a lower value of scan points and lines to look for<br />
something more efficient (quicker), then increase for higher resolution imaging.
Ryan’s MFP-3D Procedural Operation ‘Manualette’ Version 10 (v080501; Igor 6.03A); ©2008 6.9<br />
▪ Figure 6.1.7 shows an example of a typical imaging tune progression of a calibration grid (5μm x 5μm x<br />
200nm depressed features with 10μm pitch).<br />
Panel A) The image shows the tip scanning at the Set Point voltage needed for the ‘Hard’ engage after<br />
performing a Soft engage- notice the very poor tracking in the trace and retrace; and poor image quality.<br />
Panel B) The Set Point voltage was slightly lowered to 890mV (while maintaining Integral gain=10 & Drive<br />
Amp= 30.9 mV) - notice the tracking improves, yet there are great oscillations due to the Integral gain was too<br />
high;<br />
Panel C) The slow scan was ‘disabled’ so the parameters could be tuned along the same scan line (this<br />
feature is in the Main tab of the Master Panel)- it’s an easier comparison since you expect the features to be<br />
the same from scan line to scan line; the drive amplitude was increased and the Integral gain was decreased,<br />
most noticeable in the oscillations in the image. At the point where this screen shot was obtained, the<br />
imaging is pretty close to very good.<br />
Panel D) Shows the parameters at the slow scan line (red bar at left side of image).<br />
A<br />
‘parachuting<br />
C<br />
A<br />
D<br />
A<br />
B<br />
A<br />
Figure 6.1.7: Imaging parameter tuning progression on a calibration grid:<br />
A) at initial ‘Soft’ engage Set Point; B) lowering Set Point voltage; C)<br />
Disabling slow scan to tune parameters on grid features: increase Drive<br />
amplitude, lower Integral Gain, further lower Set Point voltage; D)<br />
parameters used in C). The short red line on image left indicates what slow<br />
scan line the tip is at.<br />
▪ Another common imaging artifact occurs when going over asperities with an insufficient amount of Set Point<br />
force because there isn’t sufficient dampening of the cantilever. This can be easily tuned up with an increased<br />
Set Point force (i.e., lower set point voltage, Figure 6.1.8). Notice the asperities and upper large feature in A)<br />
have a tailing (parachuting) on one side due to a low set point force. This is because the feedback loop isn’t<br />
tuned well enough to track those features efficiently. In B), the set point force was increased to improve<br />
tracking.
Ryan’s MFP-3D Procedural Operation ‘Manualette’ Version 10 (v080501; Igor 6.03A); ©2008 6.10<br />
A<br />
B<br />
Set Point 765 mV<br />
Set Point 580 mV<br />
Figure 6.1.8: Increasing Set Point force (i.e., lower set point voltage) to improve tracking over large surface<br />
asperities: A) before adjustment- ‘Gentle’ engage Set Point force (i.e., lowest set point force to engage); B) increased<br />
Set Point force increases cantilever dampening to reduce poor tracking<br />
Another image parameter tuning approach is to determine the integral gain before adjusting Set<br />
Point voltage or Drive amplitude voltage. Advantages of this are using low Set Point forces and or<br />
lower drive amplitudes (AC mode), further preserving tip and sample. Nicholas Geisse, AR Bio<br />
apps scientist taught me this- he does this for imaging cells using contact mode in fluid.<br />
Here’s another useful image tuning habit-<br />
With the slow scan disabled checkbox enabled (so the tip scans the same lines, i.e. same features for<br />
better comparison (Figure 6.1.7C)), increase the integral gain until oscillations are seen in the fast scan Trace/<br />
Retrace lines below the height (or Z sensor) channel;<br />
Then back it off until they disappear.<br />
At this point, adjust Set Point voltage (and / or Drive amplitude) until good tracking occurs.<br />
Scan rate and angle can also be adjusted to further improve image quality.<br />
Filter Panel:<br />
In some instances, there is need to adjust the low pass (LP) filters on the<br />
ADCs to quell some image noise.<br />
Go to Programming Make Filter Panel; the Filter Panel (right) appears.<br />
▪ Depending on whether imaging in contact mode or AC mode, the Fast<br />
and R LP setvars can be adjusted- there is a LP filter one would want to<br />
adjust initially. This LP filter on the PSD is called the ‘Fast ADC’ (because its<br />
5MHz, 16 bit); It also has a 1 to 10x gain on it- this is the ‘Input Gain’ setvar<br />
in the Main tab of the Master Panel that adjust the amount of bits used in<br />
the S&D meter (see Section XX). Anyway, this LP filter goes into either the<br />
FPGA, or DSP depending what imaging mode is activated.<br />
For Contact mode-<br />
Fast applies this LP filter to the FPGA in the controller. The author suggests slowly stepping this from default<br />
1.5 kHz in 50 or 100 Hz increments.<br />
For AC mode-
Ryan’s MFP-3D Procedural Operation ‘Manualette’ Version 10 (v080501; Igor 6.03A); ©2008 6.11<br />
R applies the LP filter to the Amplitude signal (i.e., Rcosθ) that goes into the DSP. As it is decreases, you can<br />
notice the sharpness of the features to decrease (i.e., get smoother). If too high, the features seem jittery or<br />
noisy- step down in 100 Hz increments until satisfied the spurious noise is getting clipped appropriately.<br />
Z, X & Y are the LP filters on the LVDT sensors LPs- located on the inputs. The author would only change X,Y or<br />
Z to improve imaging in special cases, which escapes the author at the time of writing this manualette.<br />
A, B are auxiliary LP filters; these LPs are located on the inputs<br />
R1 is for second amplitude techniques such as the Bimodal stuff (Dual AC- see Section 6.1.5); also located on<br />
the DSP.<br />
Sample Rate is a result of the scan rate and pixel resolution.
Ryan’s MFP-3D Procedural Operation ‘Manualette’ Version 10 (v080501; Igor 6.03A); ©2008 6.12<br />
6.1.4: MONITORING PHASE in AC MODE:<br />
This section explains the basic approach to preventing a common image artifact known ‘mode hopping’ (i.e.,<br />
when the phase switches between intermittent contact (net repulsive forces) and non-contact modes (net<br />
attractive forces)), See Figure 6.1.9 for examples of artifacts). The MFP-3D software allows to better control<br />
whether the tip is in a net attractive or repulsive force regime (with respect to the surface) by monitoring the<br />
phase signal of the oscillating cantilever during imaging. The Phase is always on.<br />
Mode hopping occurs when the Phase flips between greater and less than the free air Phase value (θ).<br />
This can be easily seen as off-scale z data in the Phase channel (Figure 6.1.9). This concept works well in air,<br />
but doesn’t no seem to hold true in fluid when driving the cantilever with the shake piezo due to the<br />
complication of the resonant cavity peak created between tip and sample from the oscillating cantilever<br />
holder.<br />
A<br />
µm<br />
60<br />
50<br />
40<br />
30<br />
20<br />
160<br />
140<br />
120<br />
100<br />
80<br />
60<br />
40<br />
20<br />
B<br />
Deg<br />
µm<br />
1.0<br />
0.8<br />
0.6<br />
0.4<br />
0.2<br />
160<br />
140<br />
120<br />
100<br />
80<br />
60<br />
40<br />
Deg<br />
C<br />
nm<br />
10<br />
800<br />
600<br />
400<br />
20<br />
30<br />
40<br />
µm<br />
50<br />
60<br />
70<br />
80<br />
75<br />
70<br />
65<br />
60<br />
Deg<br />
D<br />
µm<br />
0.0<br />
0.0<br />
4<br />
3<br />
2<br />
0.2<br />
0.4 0.6<br />
µm<br />
0.8<br />
1.0<br />
150<br />
140<br />
130<br />
120<br />
Deg<br />
200<br />
55<br />
1<br />
110<br />
100<br />
0<br />
0.0 0.2 0.4<br />
0<br />
0.6 0.8 1.0 1.2<br />
µm<br />
0 1 2 3 4<br />
µm<br />
Figure 6.1.9: Examples of mode hopping in the Phase Channel: A) edge effects (calibration grid); B) streaking (polymer<br />
film); C) polymer particle; D) bacterial film.
Ryan’s MFP-3D Procedural Operation ‘Manualette’ Version 10 (v080501; Igor 6.03A); ©2008 6.13<br />
IN THEORY for a simple harmonic oscillator (SHO):<br />
▪ The sine of the phase (at constant amplitude) is the tip-sample dissipation. But sine is symmetric: sin(80°) =<br />
sin(100°). Thus, there are always two phase angles consistent with a given dissipation. So the second<br />
important part is whether the phase is above or below 90° (driving cantilever at its resonance frequency)-<br />
which one wouldn’t do during normal AC mode imaging- usually done off resonance- see below.<br />
The TAKE HOME MESSAGE for SHO THEORY<br />
applied to cantilevers is qualitatively depicted in<br />
Figure 6.1.10: As the tip interacts with the<br />
surface, a shift in the cantilever’s resonant<br />
frequency also results in a phase shift of the AC<br />
signal (notice drive frequency is at resonance; i.e.,<br />
0% Target Percent in Tune tab):<br />
-A frequency decrease (i.e., lead) shifts the phase<br />
above 90º, putting it in ATTRACTIVE MODE (low<br />
amplitude mode);<br />
-A frequency increase (i.e., lag) shifts the phase<br />
below 90º, putting it in REPULSIVE MODE (high<br />
amplitude mode).<br />
The colors represent what color the phase value<br />
regime will be in the S & D meter (driving at<br />
resonance).<br />
Figure 6.1.10: A shift in resonant frequency, f o , (at constant<br />
amplitude) as the tip interacts with surface results in phase shift<br />
of the AC signal: Decrease in f o results in phase increase<br />
(attractive mode); while increase in f o results in phase decrease<br />
(Repulsive mode).<br />
Notice from the amplitude plot above that if you choose a negative Target Percent amplitude is<br />
chosen during an Auto Tune (Section 6.1.1), it helps keep the tip in repulsive mode during AC<br />
mode imaging (black vertical line crosses blue dotted line; see Section 6.1.4A). Likewise, positive<br />
Target percent amplitudes help the tip stay in attractive mode (black vertical line crosses red<br />
dotted line; see Section 6.1.4B).<br />
In reality (empirically), use the ‘free air’ Phase value as the demarcation value between<br />
attractive and repulsive modes instead of an absolute value of 90º. This is commonly the case<br />
when using a non-zero Target Amplitude Percent during auto tunes (see Auto Tune, Section 6.1.1).<br />
Sections 6.1.4A & B describe how to image in Attractive or Repulsive modes. <br />
▪ When AC mode imaging in AIR on the MFP-3D, you can monitor if the tip is experiencing net attractive or<br />
net repulsive forces with the surface via the phase value in the S & D meter. To display the real time Phase<br />
signal, go into ‘setup’ window in the S&D meter, use the pull-down menu next to Phase and select ‘On’ rather<br />
than the default ‘Auto’. See Section 7.7C for further description.<br />
For more on this topic, see the following references (but there are more):<br />
-J.P. Cleveland, B. Anczykowski, A.E. Schmid, V.B. Elings, Appl. Phys. Lett., 1998 72(20) , p2613.<br />
-J. Tamayo, R. Garcia, Appl. Phys. Lett., 1998 73(20), p2926.<br />
-A. San Paulo, R. Garcia, Biophys. Journ., 2000 78, p1559.<br />
-R. Garcia, R. Perez, Surface Science Reports, 2002 47 p197-301.
Ryan’s MFP-3D Procedural Operation ‘Manualette’ Version 10 (v080501; Igor 6.03A); ©2008 6.14<br />
▪Table 6.1.4 was prepared to help you adjust imaging / experimental parameters to (help) stay in repulsive or<br />
attractive mode, and to eliminate mode hopping.<br />
TABLE 6.1.4<br />
Repulsive mode<br />
Attractive mode<br />
< ‘free air’ phase > ‘free air’ phase<br />
Low Q<br />
High Q<br />
Use Higher free air amplitude Use Lower free air amplitude<br />
(Increase A fa )<br />
(Reduce A fa)<br />
Decrease A sp / A fa<br />
Increase A sp / A fa<br />
Smaller tip radius<br />
Larger tip radius<br />
Set f < f o (left side of Resonance) Set f > f o (right side of Resonance)<br />
where A fa is the free air amplitude (in volts);<br />
and A sp is the Set Point (in volts); f is drive frequency; f o is resonant<br />
frequency of cantilever; Q is the cantilever quality factor.<br />
NOTE: This attractive/ repulsive Phase stuff gets more complicated in fluid- this author notes that<br />
this behavior is being studied internally with magnetically actuated cantilevers (iDrive).<br />
6.1.4A: REPULSIVE MODE IMAGING: Hints to get a good repulsive mode image-<br />
Imaging in repulsive mode can accentuate the phase contrast-<br />
Following the steps before should achieve a nice repulsive image to be obtained- there are some samples in<br />
which mode hopping (to some degree) seem unavoidable.<br />
Perform an Auto Tune (Tune tab; as described in Section 6.1.1,) with a -5% target amplitude, and 1.0V Free<br />
Air amplitude. This will set the Free Air amplitude at 1.0V, with the minimum amount of Drive amplitude<br />
voltage to obtain this- this value should be in the range of tens to hundreds of mV, depending on the<br />
cantilever (and how well the probe is coupled to the shake piezo).<br />
Before engaging the tip, take notice of the ‘free air’ phase value- this is the value you will want to be below<br />
to keep the tip in repulsive mode.<br />
Engage tip (it’s best to do a ‘Soft’ engage to preserve the tip apex); At the point of the hard engagement,<br />
the Phase should decrease a few degrees (although this can be sample dependent). If it doesn’t, increase the<br />
Drive amplitude voltage slightly, and/ or decrease the set point voltage slightly (NOTE: Smaller free air<br />
amplitudes can also be used). If the Phase is already ‘hopping’, try increasing the Drive Amplitude voltage<br />
such that the Phase seems to stay stable. This will be apparent in the S&D meter.<br />
If the Phase isn’t staying below the initial free air Phase value upon contact, or flipping all over the<br />
Phase scale (i.e., mode hopping because sample –tip forces are acting crazy), try increasing the<br />
Drive Amplitude. To preserve the tip’s apex (a sharp tip helps keep the tip in repulsive mode), the<br />
author has found this can be done by:<br />
Withdrawing the tip.<br />
Increasing the drive amplitude (by 1.5x or 2x, for starters).<br />
Adjust (decrease) the ‘Input Gain’ on the Main tab of the master panel (see Figure 6.6.11).<br />
Re-engage tip to evaluate if the Drive Amplitude increase was sufficient (i.e., is it still flipping between<br />
attractive and repulsive?). If not, repeat with larger Drive amplitude; or make target percent more negative.
Ryan’s MFP-3D Procedural Operation ‘Manualette’ Version 10 (v080501; Igor 6.03A); ©2008 6.15<br />
A note on item 3 mentioned in the above Note-<br />
▪ By decreasing the Gain value (in dB), the dynamic<br />
range is increased (in volts), while the bits/V is<br />
decreased. Figure 6.1.11 shows an example of thisdecreasing<br />
the input gain, causes the scale of the<br />
amplitude range to become larger (B).<br />
▪ Once the tip is scanning, increasing the Drive<br />
Amplitude voltage, (and/or decreasing the Set point<br />
voltage) can lower the Phase angle value, further<br />
pushing into the repulsive regime, which can help<br />
ensure to prevent unexpected mode hopping.<br />
A<br />
B<br />
Figure 6.1.11: decreasing the ‘Input Gain’ to increase<br />
the dynamic range.<br />
Adding Q gain on the drive can help stabilize repulsive mode imaging; This process is also described in the<br />
attractive mode protocol below, but will be described here as well.<br />
Auto Tune to 5% to 10% on the left side of the peak<br />
Increase the Q gain by only a couple hundredths place per manual tune<br />
Click the ‘One Tune’ button which sweeps once the frequency range once, and displays the updated plotnotice<br />
the Q increases, the resonant peak look sharper.<br />
Click the ‘Center Phase’ to center the phase signal with the resonant frequency value.<br />
Repeat process until top of curve starts to looking round and/ or ringing on right side of resonant peak, or<br />
Phase signal is displayed.<br />
• Notice with additional Q gain, the amplitude response will go up. Keep this in mind if you have need to<br />
attenuate the drive amplitude to get back to a desired few air amplitude before engagement.<br />
• Figure 6.1.12 shows this process with an AC 240 (2kHz Si lever) with some common visuals to look for,<br />
although ever lever shows different degrees of response relative to amount of Q gain. Panel A) shows a post<br />
auto tune- no Q gain is added. Panel B shows the response after a few Q gain increases/ phase centering<br />
executions- notice the top of the peak is starting to look more round than sharp; this means the ringing is<br />
about to start. … As in Panel C). A this point, decrease the Q gain until the ringing goes away. Panel D) is<br />
shown as a Q gain and Phase freakout.<br />
•At any point, clicking the ‘Auto Tune’ button will reset the Q gain to zero.
Ryan’s MFP-3D Procedural Operation ‘Manualette’ Version 10 (v080501; Igor 6.03A); ©2008 6.16<br />
A<br />
B<br />
C<br />
D<br />
Figure 6.1.12: Q gain and repulsive imaging: A) post auto tune- no Q gain; B)almost ringing; C) ringing; D)<br />
freakout.<br />
If all else fails, the tip could be too blunt (recall larger surface areas promote attractive mode- see Table 6.1.4)-<br />
CHANGE THE TIP; or the sample could possess charge that needs to be quelled/ dissipated using a ‘<strong>St</strong>atic<br />
Master’ (see Figure 6.1.12).<br />
TROUBLESHOOTING-<br />
If you are still having trouble with mode hopping, it could be due to the sample - here are a couple things that<br />
may be contributing to it-<br />
1) If you are experiencing difficulty keeping the tip in repulsive mode, perhaps the tip is too dull (see Table<br />
6.1). If you are re-using the tip, this is a strong likely hood.<br />
2) Surface charges- use the <strong>St</strong>atic Master device to dissipate the charge. Place the <strong>St</strong>atic Master in the vicinity<br />
of the sample (see Figure 6.1.13). Sometimes the glass slide the sample is glued to is the culprit of the excess<br />
charge- in these cases, mounting the sample on a magnetic puck and placing it on a metal sample holder can<br />
help quell this charge.<br />
<strong>St</strong>atic master<br />
Figure 6.1.13: Placing static master near sample to dissipate charge.
Ryan’s MFP-3D Procedural Operation ‘Manualette’ Version 10 (v080501; Igor 6.03A); ©2008 6.17<br />
3) the Q gain needs to be increased slightly- See above and Ssection 6.1.4B for a description of increasing the<br />
Q gain and performing subsequent Manual tunes to confirm no ringing is occurring (i.e., Figure 6.1. 154).<br />
4) The tip could be sticking to the sample- Keith Jones (AR apps scientist) has found that a Pt coated Si<br />
cantilever can sometimes work well with ‘sticky’ samples. We use Electrilevers (Olympus AC 240s coated with<br />
Pt), but if you have access to a sputterer, perhaps you can make your own. Try 3 nm of an adhesion layer such<br />
as Ir, Cr, Ti; and 5 to 10 nm of Pt.<br />
6.1.4B: ATTRACTIVE MODE IMAGING: Hints to get a good attractive mode image-<br />
Imaging in attractive mode is great for soft samples that<br />
shouldn’t be perturbed as much in repulsive mode, however<br />
can sometimes be tricky when you actually want it to occurhere<br />
are some simple steps to help keep the tip in attractive<br />
mode:<br />
In the Tune tab of the Main panel-<br />
Set the Target Amplitude to 1V; this will have to be<br />
adjusted (decreased) later, but for the initial Auto tune, it will<br />
give the cantilever enough amplitude to have a successful<br />
Auto tune.<br />
A<br />
B<br />
Set the Target Percent to +10 to +20%; this will set the<br />
Drive frequency on the right side of the cantilever’s resonant<br />
peak- a position more likely to keep the tip in attractive<br />
mode while imaging.<br />
Click the ‘Auto Tune’ button. This will sweep the piezo<br />
frequency and find the Drive Frequency based on the setvar<br />
parameters just entered. A plot similar to Figure 6.1.154A<br />
should be seen.<br />
C<br />
▪ This will give a good starting point for the next step-<br />
Slightly increase the Q gain from 0.00 to 0.01.<br />
Click the ‘One Tune’ button. Notice the FWHM value of<br />
the new resonant peak will decrease. These values are also<br />
calculated and displayed in the Auto Tune plot (Figure 6.1.3).<br />
Repeat this process until the resonant peak & Phase start<br />
to show ringing (Figure 6.1.154B).<br />
Figure 6.1.14: Attractive mode drive frequency<br />
and amplitude selection with an Olympus AC 240<br />
Si cantilever. A) after auto tune; B) increase Q<br />
Gain until Phase and Drive has ringing; C)<br />
Decrease Q gain until ringing disappears<br />
Now decrease the Q gain until this ringing ceases in the Drive or Phase plots (Figure 6.1.14C).<br />
Lastly, click the ‘Center Phase’ button to center the inflection point of the phase signal with the resonant<br />
peak of the cantilever.
Ryan’s MFP-3D Procedural Operation ‘Manualette’ Version 10 (v080501; Igor 6.03A); ©2008 6.18<br />
NOTICE THE FREE AIR AMPLITUDE IS MUCH LARGER NOW (look at the S&D meter)<br />
▪ Since attractive mode imaging works best with smaller free air amplitudes, this amplitude must now be<br />
decreased-<br />
Decrease the free air amplitude (manually) to less than 0.5 V - the author usually goes to ~0.3V.<br />
Choose a Set Point voltage that is about 95% of this new free air amplitude, such that you perform a ‘gentle’<br />
/ soft engage- this is important since you are attempting to image in attractive (non-contact) mode.<br />
Click the ‘Engage’ button; engage tip by wheeling thumbwheel down (CCW), as described in Section 6.1.2.<br />
▪ Watch the free air amplitude during the hard engagement- if it flips to repulsive mode (i.e., Phase value less<br />
than free air phase value), increase drive amplitude, increase Q gain slightly, or decrease free air amplitude.<br />
Once scanning, decreasing the Set Point voltage, and/or increasing the Drive amplitude will (should)<br />
increase the Phase value, further pushing the tip – sample interaction into the attractive regime.<br />
• Figure 6.1.15 shows an example of AC mode imaging lambda DNA on mica with attractive and repulsive<br />
mode imaging (obtained consecutively), performed with the same tip and sample region. In A), the target<br />
percent was +20%, a ‘free air’ amplitude of ~350 mV, and a Q gain of 0.013. Notice high contrast in attractive<br />
mode image. In B), the target percent was -5%, a free air of 1.0 V, and Q gain of 0.00V. Notice the same area of<br />
the DNA give ~ 1nm of height in the attractive mode, and ~ 0.5 nm in repulsive mode.<br />
1.0<br />
0.8<br />
A<br />
ATTRACTIVE<br />
1.0<br />
1.0<br />
0.8<br />
B<br />
REPULSIVE<br />
1.0<br />
0.6<br />
0.5<br />
0.6<br />
0.5<br />
0.4<br />
0.0<br />
-0.5<br />
nm<br />
µm<br />
0.4<br />
0.0<br />
-0.5<br />
nm<br />
0.2<br />
-1.0<br />
0.2<br />
-1.0<br />
0.0<br />
0.0<br />
600pm<br />
400<br />
Height<br />
200<br />
0<br />
0.2<br />
0.4 0.6<br />
µm<br />
0.8<br />
1.0<br />
0.0<br />
Height<br />
400pm<br />
300<br />
200<br />
100<br />
0<br />
0.0<br />
0.2<br />
0.4 0.6<br />
µm<br />
0.8<br />
1.0<br />
-200<br />
-100<br />
-400<br />
-200<br />
0<br />
100<br />
200<br />
300<br />
nm<br />
400<br />
500<br />
600<br />
Figure 6.1.15: Consecutive AC mode Images of DNA in air with same tip and scan area: A) Attractive mode, and B)<br />
Repulsive mode.<br />
0<br />
100<br />
200<br />
nm<br />
300<br />
400
Ryan’s MFP-3D Procedural Operation ‘Manualette’ Version 10 (v080501; Igor 6.03A); ©2008 6.19<br />
6.1.5: DualAC Imaging:<br />
DualAC is a relatively new AC imaging mode offered on the MFP-3D. The concept is simultaneously driving<br />
the cantilever at two of its flexural resonances, giving an AC waveform similar to the one depicted in Figure<br />
6.1.5.1A. The technique requires two independent lock-in amplifiers to accomplish this, which the MFP-3D<br />
controller has internally. The fundamental cantilever resonance frequency (i.e., the first eigenmode) is<br />
typically locked-in for the feedback loop, which ultimately constrains the movement of the cantilever at this<br />
mode. What’s interesting is that the second eigenmode is not constrained by the feedback loop, quite often<br />
offering increased image contrasts in the second amplitude and/ or second phase channels. Since this is<br />
based on the flexural resonant frequencies of a cantilever, these higher eigenmodes are not integers (as with<br />
harmonics), but rather follow the relationship:<br />
Cfirst = 1; Csecond = 6.1; Cthird = 17.5<br />
Thus, cantilever selection for this technique is limited to the bandwidth of the system (i.e., the second or third<br />
eigenmode of stiffer cantilevers is often at too high a frequency to be driven by the MFP-3D- maximum is<br />
2.5MHz).<br />
A<br />
B<br />
C f<br />
Figure 6.1.5.1: A) resulting Dual AC waveform; B)<br />
higher mode behavior of cantilevers, where C f is the<br />
fundamental resonant frequency, C 1st is the first<br />
eigen mode and C 2nd is the second eigen mode.<br />
C 1st<br />
C 2nd<br />
• If the resonant frequencies of the cantilever are not known, just do a thermal tune. In some instances, the<br />
range of the thermal tune will have to be increased, and the thermal plot’s Frequency axis manually increased<br />
(see Section 5)<br />
For more reading on higher harmonic imaging, see the following references:<br />
J.P. Cleveland et al., Applied Physics Letters 72, 2613 (1998)<br />
A. San Paulo, R. Garcia, Biophys. Journ., 78, 1559 (2000)<br />
R. Proksch, Applied Physics Letters 89, 113121 (2006).<br />
T. Rodriguez, and R. Garcia, Appl. Phys. Lett. 84 (3), 449 (2004).<br />
Keep in mind that not all samples will show good contrast in the second mode- likewise, some<br />
samples show good contrast between the first and second amplitudes, while showing little<br />
difference between the first and second Phase; or vice versa. Heterogeneous samples seem to show<br />
good contrast with this technique.
Ryan’s MFP-3D Procedural Operation ‘Manualette’ Version 10 (v080501; Igor 6.03A); ©2008 6.20<br />
•The same attractive / repulsive imaging mode rules seem to apply to the second mode as does the first. The<br />
author suggests using the protocols described in Section 6.1.4 to avoid mode hoping in the second mode.<br />
• For this protocol, the author has found that some water based latex paint gives excellent contrast in the<br />
Amplitude & Phase images, and can easily be made by most people wanting to practice/ learn how to do this<br />
technique. The sample is a small amount of Sherwin-Williams ProMar200 water based latex on a glass slide (as<br />
a former professional carpenter, the author’s of the opinion that Sherwin Williams is one of the best paintson<br />
the market). Water based paints are heterogeneous because of the small emulsion polymer particles and<br />
other fillers used as the ingredient that gives the paint its opaque character.<br />
For in-air DualAC imaging-<br />
To get started, determine the fundamental resonant frequency of the cantilever (if not known) by<br />
performing a thermal tune (see Section 5); to determine the second eigenmode, roughly multiple by 6.1- this<br />
will be important for entering high and low tune values for the DualAC Auto Tune.<br />
An example of a thermal tune of an Olympus AC 240 silicon cantilever (f~70kHz; k~2N/m) is shown in Figure<br />
6.1.5.2. Notice the second ‘eigenmode’ is roughly 6 times the fundamental frequency (inset).<br />
Figure 6.1.5.2: Thermal tune showing fundamental and second eigen mode peaks<br />
Confirm that Height, Phase1, Amplitude1, Phase 2 and<br />
Amplitude2 are the activated image channel tabs in the<br />
Master Channel Panel (see Section 7).<br />
Go to the Tune tab of the Master Panel.<br />
Click on the DualAC Mode check box in the ‘Other Things’ portion of the panel; this will expand the panel<br />
to include the second mode parameters (Figure 6.1.5.3).<br />
Confirm that the Auto Tune ‘High’ and ‘Low’ setvar values are in the range of the cantilever being used.
Ryan’s MFP-3D Procedural Operation ‘Manualette’ Version 10 (v080501; Igor 6.03A); ©2008 6.21<br />
Choose a Target Percent and Target Amplitude for the fundamental resonant peak (i.e., first eigen mode)-<br />
The author usually goes with 1V and -5% to be in repulsive mode (see Section 6.1.4).<br />
Click on ‘Auto Tune’ in the first column (left) which is for the the fundamental frequency of the cantilever.<br />
This will tune the cantilever is it normally does in standard AC imaging (see Section 6.1.1).<br />
For second mode tuning-<br />
Confirm that the ‘Auto Tune High’ and ‘Low’ setvar values will<br />
be sufficient to include the desired second mode frequency.<br />
Choose a Target percent and Target Amplitude for the second<br />
mode- The author usually goes with the default 100mV and -5%<br />
to be in repulsive mode.<br />
Click the ‘Auto Tune’ Button; after a moment, the software<br />
should choose a frequency.<br />
• Notice the Frequency Ratio setvar value is updated to the<br />
multiplier value of the fundamental peak.<br />
NOTE: If the Auto Tune for the second mode doesn’t happen to be<br />
successful, in certain instances the coupling of the probe chip to<br />
the cantilever holder may be too good, causing the Drive<br />
Amplitude to be too small to achieve the defined Target<br />
Amplitude- when this happens, increase the target amplitude and<br />
step it down later once imaging commences.<br />
Perform a ‘gentle engage’ as described in Section 6.1.2. once the<br />
tip is hard engaged on the surface, adjust the Drive amplitude<br />
appropriately to keep it in the imaging mode desired (i.e.,<br />
repulsive or attractive).<br />
Figure 6.1.5.3: Expanded Tune tab for Dual<br />
AC.<br />
<strong>St</strong>art imaging. Notice that the Main tab of the Master Panel now has an expanded panel offering Drive<br />
Amplitude and Drive Frequency setvars with radio button for image tuning.<br />
Save the data if you want.
Ryan’s MFP-3D Procedural Operation ‘Manualette’ Version 10 (v080501; Igor 6.03A); ©2008 6.22<br />
•DualAC allows mixed modes to be done (i.e., repulsive- repulsive; repulsive- attractive; attractive- repulsive;<br />
attractive- attractive). Since this is a new area of AFM, there is a lot that is still left to be learned.<br />
Height Amplitude1 Amplitude2<br />
Phase1<br />
Phase2<br />
Figure 6.1.5.4: DualAC images of<br />
water based paint in air. Notice the<br />
contrast between Amplitude 1 & 2;<br />
Phase 1 & 2.<br />
•Figure 6.1.5.4 shows an example of a Dual AC mode image of some dried water based latex paint, imaged in<br />
air with a Nanoworld NCL-50 silicon lever (f~190kHz; k~48N/m). The author was able to keep both modes in<br />
repulsive modes.<br />
DualAC in-fluid – thus far, DualAC in-fluid while driving the cantilever acoustically (i.e., with the shake<br />
piezo) hasn’t been all that successful. The main reason is likely because in fluid, the entire cantilever holder is<br />
ultimately driving the fluid between the tip and sample, creating a resonant cavity.<br />
Recently, Asylum Research scientists have discovered that DualAC has been successful using the<br />
magnetically actuated iDrive- with this module, just the cantilever is actuated, eliminating all the<br />
other crazy waves that normally occur in solution when driving via acoustic mode.<br />
Second mode spring constants can also be determined using the thermal method- the author suggests<br />
using amplitude InvOLS.
Ryan’s MFP-3D Procedural Operation ‘Manualette’ Version 10 (v080501; Igor 6.03A); ©2008 6.23<br />
6.2: AC mode IN FLUID:<br />
The MFP-3D was designed to operate in-fluid very well, and with great ease for the user. The procedure for<br />
tuning the cantilever is almost as easy as in air, but differs slightly….<br />
FIRST- It’s a good idea to have an extra layer of protection between the sample slide and the<br />
scanner. See section 6.2.6 for simple, cost effective precautions to prevent scanner damage<br />
due to fluid spill.<br />
6.2.1: Preparing for IN FLUID Imaging:<br />
Load an appropriate cantilever for your application into the<br />
cantilever holder. Typically, Silicon Nitride cantilevers are used<br />
for in-fluid imaging because they are more compliant/ flexible<br />
and can tolerate the buoyancy of the fluid dynamics a little<br />
better. Silicon cantilevers tend to chatter too much in fluid, but<br />
they are fine for force work.<br />
With the head on its back, gently wet the cantilever with<br />
some of the imaging fluid – this is done to help support the<br />
cantilever at the fluid/ air interface as it is plunged into the fluid<br />
around the sample. Figure 6.2.1 shows a few 10s of μLs is all that<br />
is needed- gently dispense fluid at the side of probe chip such<br />
that the fluid goes (‘snakes’) between the cantilever and the<br />
quartz window to ensure proper support.<br />
Using two hands, rotate the head, and place on sample<br />
stage. Make sure the legs are adjusted so the tip doesn’t crash<br />
into the surface! Figure 3.5 shows an example of this.<br />
Figure 6.2.1: Wetting the cantilever<br />
Photo courtesy of Dr. Irene Revenko<br />
DO NOT SUBMERGE CANTILEVER HOLDER BEYOND KEL-F/ PEEK BODY. If this does occur,<br />
fluid can wick into the circuit board of the cantilever holder and cause deleterious effects.<br />
A<br />
B<br />
fluid<br />
Figure 6.2.2: Do not submerge cantilever holder beyond polymer body: A) fluid level / meniscus should not go beyond<br />
edge of cantilever holder; B) is the fluid level surpasses the edge of the Kel-F polymer body, the fluid can wick its way into<br />
the printed circuit board in the holder and short out voltage lines, and compromise pogo pins and other components.
Ryan’s MFP-3D Procedural Operation ‘Manualette’ Version 10 (v080501; Igor 6.03A); ©2008 6.24<br />
Open CCD camera; turn on fiber light illumination so you can see the cantilever(s). (see Section 4.1B).<br />
▪ Sometimes the cantilevers are very floppy such that they bend back on the probe chip upon meeting the<br />
fluid interface; OR an air bubble (see Figure 6.2.3) will get trapped somewhere by the cantilever, which will<br />
eventually compromise the deflection signal because the bubble may migrate- it’s best to nip it in the bud<br />
before imaging.<br />
There are two ways to alleviate the occurrence of<br />
bubbles:<br />
Gently lift the front of the head up, pivoting on back<br />
legs, such that the cantilever holder comes out of the<br />
fluid; then plunge it back into the fluid(Figure 6.2.2).<br />
Sometimes this process must be repeated. Figure 6.2.4<br />
shows an example of a bent cantilever as seen in the<br />
CCD camera image.<br />
If the bubble isn’t removed after trying step 1<br />
multiple times, lift the head up off the stage, place on its<br />
side and dispense/ flow some imaging fluid to remove<br />
the bubble with shear force of the fluid under gravity; rewet<br />
the tip and place back on stage. Try again.<br />
Figure 6.2.2: Lift head in and out of the fluid on sample<br />
to remove air bubbles.<br />
▪ Figure 6.2.3 & 6.2.4A,B show examples of monitoring the removal of an air bubble trapped between the legs<br />
of the legs of a triangular cantilever (A), and after removing the bubble as (B) described in Figure 6.2.2.<br />
A<br />
B<br />
Bubble<br />
Figure 6.2.3: Using the CCD camera to determine the presence of and air bubble trapped near the<br />
cantilever in fluid. A) BEFORE: trapped air bubble (in red circle); B) AFTER: no more air bubble.
Ryan’s MFP-3D Procedural Operation ‘Manualette’ Version 10 (v080501; Igor 6.03A); ©2008 6.25<br />
A B BUBBLE C D<br />
Figure 6.2.4: Floppy/ soft Si 3 N x cantilevers can be bent by surface tension of fluid as seen in CCD camera<br />
images. A) cantilevers appear bright when bent/deflected improperly; B) CCD zoom of cantilever in red boxnotice<br />
small bubble at base, and deflection of cantilever; C) properly oriented cantilever; D) CCD zoom of<br />
cantilever in green box. The cantilever in above images is an Olympus Biolever (30 µm x 60 µm; k ~0.03<br />
N/m).<br />
▪ A properly oriented cantilever should look like a silhouette of the cantilever in the CCD camera image<br />
(similar to Figures 6.2.3B & 6.2.4C,D). If it appears brighter than that, there is probably something wrong<br />
(seated in pocket improperly, deflected, broken, etc.).<br />
6.2.2: Aligning the SLD:<br />
Once the head is on the stage, the best way to align the SLD spot on the cantilever when imaging in fluid is to<br />
use the top view optics CCD camera. Refer to Section 4.3 for this procedure.<br />
That being said, if the SLD spot can be aligned on the cantilever ‘dry’ (i.e., it isn’t functionalized with some<br />
protein or chemistry that must stay wet), you can initially align it with the IR card in air; then plunge the tip<br />
into fluid (remember to wet the tip, Figure 6.2.1). After that, just adjust the LDX back towards the cantilever<br />
probe chip via monitoring the Sum Voltage in the S&D meter. The fluid’s index of refraction (i.e., aqueous)<br />
causes the SLD spot to move off the cantilever once in-fluid. Generally, there is very little noticeable LDY shift<br />
when plunging the tip into fluid.<br />
6.2.3: Determining Drive Frequency in Fluid<br />
There are two ways to select a proper drive frequency-the first is the AR instructed (proper) way to do select it,<br />
and how to engage the tip; the second description is the hack way to do it, blindly developed by the author<br />
some years ago (this should be reserved for moderately desperate situations).<br />
• Traditionally, determining the drive frequency from a standard drive frequency sweep is difficult because<br />
the shake piezo oscillates the entire cantilever holder- this in turn sloshes the fluid between the probe and<br />
sample, termed a resonant cavity, and presents a ‘forest of peaks’ in the drive frequency sweep, often<br />
distinguishing the fundamental resonant peak from a resonant cavity peak very difficult. Picking the wrong<br />
peak can compromise the tip apex.<br />
1) AR has worked a very nice protocol into their software in which the Thermal power spectrum can be<br />
overlaid over the Drive Frequency sweep, which allows a precise drive frequency to be determined (see Figure<br />
6.2.5) because the cantilever’s natural resonant frequency is known, relative to the peaks from the resonant<br />
cavity.<br />
Determine a range to do the frequency sweep from the thermal power spectrum; (i.e., perform a thermal<br />
tune (see Section 5 )); a window of 5 to 10kHz is a good place to start.
Ryan’s MFP-3D Procedural Operation ‘Manualette’ Version 10 (v080501; Igor 6.03A); ©2008 6.26<br />
In the Tune Tab, click the ‘Append Thermal’ checkbox.<br />
Using the Igor (Crtl+i) cursors; enter fundamental cantilever frequency in the Drive Frequency parameter<br />
window in Tune Tab.<br />
Click the ‘One Tune’ button (with the proper frequency range selected); After the sweep, you’ll see a<br />
frequency plot (black trace) over top the thermal power spectrum (red scatter points) as seen in Figure 6.2.5A.<br />
▪ If the signal is weak, or very noisy, you can increase the Drive Amplitude, and Click ‘One Tune’ again. This<br />
can give you something like Figure 6.2.5B- it cleans up the noise, or increases peak amplitudes- sometimes<br />
this is good to do to distinguish the proper resonant frequency of the cantilever from the resonant cavity<br />
peaks associated with driving the cantilever in the fluid.<br />
Using the cross cursor, right mouse click at the most pronounced peak that corresponds to the center or<br />
just left side to maximum of the resonant peak on the thermal tune scatter plot (red). A dialogue comes up<br />
(after you right click); choose ‘Set Drive Frequency As’; this updates the drive frequency (Figure 6.2.5C).<br />
A plot like the one in Figure 6.2.5D will result.<br />
Click the ‘Center Phase’ button once a drive frequency has been determined. This will center the phase at<br />
90º, which can be seen in the S & D meter. This allows you to monitor whether the tip is in the attractive or<br />
repulsive regime, however, this doesn’t hold very true in-fluid (using shake piezo drive) as it does in air (recall<br />
Section 6.1.4 ).<br />
Select imaging parameters (i.e., set point to free air voltage ratios) similar to the description in Section 6.1.2<br />
and you’ll be ready to Engage. Recall, choose a Set Point voltage that is lower than the free air amplitude<br />
voltage (i.e., some voltage percentage); for gentle engage, assign the Set Point ~ 95 % of the ‘free air’<br />
amplitude voltage.<br />
Proceed to Section 6.2.4 for tip engagement in fluid.
Ryan’s MFP-3D Procedural Operation ‘Manualette’ Version 10 (v080501; Igor 6.03A); ©2008 6.27<br />
A<br />
B<br />
C<br />
D<br />
Figure 6.2.5: Performing a ‘One Tune’ to select Drive Frequency in AC mode: A) ‘One Tune’ Drive<br />
Frequency spectrum (black) with ‘Append Thermal’ spectrum (red scatter plot); B) Drive amplitude<br />
increased to increase S/N: C) Setting Drive Frequency with right mouse click on curve of interest; D)<br />
resulting ‘One Tune’ with cursor (black vertical line) at user defined Drive Frequency.<br />
2) The HACK way-<br />
Alternatively, you can follow this procedure if you have difficulty getting a decent image from the above<br />
protocol. Although the author used to follow this procedure before the above procedure was learned and<br />
practiced, it certainly isn’t a refined way to go about it; that being said, it can be effective.<br />
From the Thermal (power spectrum) plot, place an Igor cursor on the left side of the first or second peak,<br />
about 5 to 10% of the maximum amplitude. The areas indicated by the red arrow (Figure 6.2.6A) are where<br />
you can manually pick the drive frequencies by entering the ‘X’ cursor value in the drive frequency window of<br />
the Tune tab. Alternatively, the author has had some imaging success by driving near the first Eigen mode<br />
(blue arrow, Figure 6.2.6A).<br />
▪ To aid this process, you can Zoom in on the first fundamental resonance peak (Figure 6.2.6B).<br />
Place the Igor cursors some where on the left side of the resonant peak, enter that frequency value into the<br />
Drive Frequency setvar parameter window in the Tune Tab.
Ryan’s MFP-3D Procedural Operation ‘Manualette’ Version 10 (v080501; Igor 6.03A); ©2008 6.28<br />
A B C<br />
Figure 6.2.6: Thermal tune freq vs. amplitude plot IN FLUID. Peaks become broader due to lower ‘Q’ value, and resonant peaks<br />
shift to lower frequency (generally 1/2 to 1/3 the in air resonant frequency.<br />
Pick a Drive amplitude – the author’s experience is that it must be several hundred mV’s before the tip<br />
won’t think its false engaged. This sometime can be a trial and error process, increasing the Drive Amplitude<br />
or lowering the Set Point voltage until the Piezo extends fully when clicking the ‘Engage’ button.<br />
Engage as you normally would in the ‘hard’ engage technique (Section 6.1.2). Notice the amplitude will<br />
increase as the tip approaches the surface, up to a certain point, then decreases drastically when the tip is very<br />
close to surface- increasing the likelihood of truncating the tip (to avoid this, see Section 6.2.4 ).<br />
6.2.4: TIP ENGAGEMENT IN FLUID: Here is the way to do a soft/ gentle engage in fluid-<br />
SPECIFICALLY WITH PROTOCOL 1 for DETERMINING DRIVE FREQUENCY<br />
Click ‘Engage’ on the S&D meter.<br />
Take notice of the ‘free air’ amplitude value.<br />
Manually thumb the approach wheel until the feedback servo is activated (as described above in Section<br />
6.1.2).<br />
Depending on the cantilever being used, sometimes using this ‘gentle’ engage approach (i.e. 95%<br />
Set Point trick) doesn’t work because the piezo retracts fully upon clicking the ‘Engage’ button. In<br />
this case, decrease the Set Point voltage until the Piezo extends fully awaiting the amplitude<br />
dampening needed to achieve the Set Point. Then continue with the below protocol-<br />
▪ As you thumbwheel down, you will notice that the Amplitude value in the S&D Meter increasing. This is<br />
(believed to occur) because of the liquid being compressed between the tip and sample from the oscillating<br />
shake piezo in the cantilever holder, effectively imparting a larger ‘Free Air’ amplitude onto the cantilever as it<br />
approaches the surface.
Ryan’s MFP-3D Procedural Operation ‘Manualette’ Version 10 (v080501; Igor 6.03A); ©2008 6.29<br />
Use the ‘Hamster’ wheel to occasionally decrease the amplitude to pre-approach free air amplitude voltage<br />
value to maintain the proper Set Point (i.e., ~95% of the ‘free air’ amplitude). If not, the Drive Amplitude will<br />
keep increasing (because the efficiency of the resonant cavity keeps increasing), until it gets very near the<br />
surface, then it will snap to contact (‘hard’ engage), likely damaging the tip or sample.<br />
▪ If you use the ‘Hamster’ to continually adjust the Drive Amplitude a maintain the initial ‘free air’ amplitude<br />
voltage , you’ll notice as the tip gets very close to the surface, the Amplitude will decrease, and will engage at<br />
the Set Point value you defined. (just as it does when soft engaging in air).<br />
Slowly decrease the Set Point voltage with the ‘Hamster’ Wheel such that the tip ‘hard’ engages on the<br />
surface (see Section 6.1.2B ).<br />
Move piezo into middle of Z range (~70 V).<br />
<strong>St</strong>art scanning.<br />
Tune parameters as described in Sections 6.1.3 & 6.2.5. With some samples, do not surprised if you cannot<br />
get the tip to track the surface as well as it does in fluid.<br />
6.2.5: Tuning Imaging Parameters IN FLUID:<br />
Tuning and arranging the proper imaging parameters in fluid can be a little trickier than it typically takes in<br />
air. The author suggests exercising patience, especially when imaging soft biological samples because this<br />
should be done at low scan rates (< 0.5Hz), increasing acquisition times.<br />
NOTE: Depending on the sample, obtaining really good tracking is usually NOT a frequent occurrence when<br />
imaging in-fluid. When you get something that looks real, go with it-<br />
▪ It is also possible to image at very low Drive Amplitude and Set Point voltages- although usually after<br />
engagement because sometimes engagement cannot occur with these parameters ratios. The trick to this is<br />
once the tip is engaged and imaging, slowly step down the Set Point and Drive Amplitudes iteratively. It can<br />
take a little while, but the results can be very good- lower tip oscillations mean less sample perturbation<br />
(especially with cells and other bags of water).<br />
Additionally, aside from adjusting normal tuning imaging parameters, the Drive Frequency can be adjusted<br />
with the ‘Hamster’ wheel until the ‘sweet spot’ is found. Figure 6.2.7 shows the results of changing the Drive<br />
Frequency on the fly to find the ‘sweet spot’. During parameter tuning, monitor the image quality in the<br />
height and phase images, as well as the scan traces below the height image. The Phase image can be<br />
monitored for noise as seen in the left image. A slight adjustment reduces this noise for better image quality.<br />
The image is of a patterned protein (lighter color), and poly ethylene glycol terminated thiolate (dark region).
Ryan’s MFP-3D Procedural Operation ‘Manualette’ Version 10 (v080501; Igor 6.03A); ©2008 6.30<br />
12<br />
12<br />
10<br />
10<br />
8<br />
8<br />
6<br />
6<br />
4<br />
4<br />
2<br />
2<br />
0<br />
0<br />
0 2 4 6 8 10 12<br />
0 2 4 6 8 10 12<br />
µm<br />
µm<br />
11.026 kHz 10.578 kHz<br />
Figure 6.2.7: Monitoring the Phase image while changing the Drive Frequency on the fly.<br />
Post Fluid imaging:<br />
The author typically sets the head on its side<br />
immediately after imaging to allow the excess<br />
fluid to drip off the cantilever holder. It’s based<br />
out of habit from the post-doc days, and<br />
continues today out of superstition (which often<br />
accompanies SPM). Figure 6.2.8 shows the<br />
head places on its side on the head stand in the<br />
acoustic hood, allowing gravity to let fluid fall to<br />
head resting stand.<br />
Figure 6.2.8: Place head on its side after use in fluid to allow<br />
gravity to remove fluid safely.
Ryan’s MFP-3D Procedural Operation ‘Manualette’ Version 10 (v080501; Igor 6.03A); ©2008 6.31<br />
6.2.6: Imaging In Fluids- PRECAUTIONS:<br />
When imaging in fluids, aside from the precautions described in Figure 6.2.2, it is important not to allow buffer<br />
(or other corrosive fluids) to get to the scanner, or you’ll have a $10,000 problem, minimum. What can happen<br />
is that excess fluid can drip down onto the top of the stage, get sucked into the bottom of the scanner<br />
through the back plate via capillary action, then into the flexor channels via capillary action. Fluid can ruin the<br />
LVDT sensors and compromise (corrode) the flexor channels from moving properly. The following is an easy<br />
precaution to take, especially if you have a ‘<strong>St</strong>and Alone’ top view base.<br />
IF YOU DO NOT HAVE A CLOSED FLUID CELL: To protect the scanner, place a piece of plastic under the sample<br />
that has the droplet on it (see Figure 6.2.9A below). There are Teflon coated standard microscope slides with<br />
circular bare glass regions that could also be used (Figure 6.2.9B). A variety of these slides can be purchased<br />
from the EMS website under Figure 6.2.9B.<br />
A<br />
C<br />
B<br />
www.emsdiasum.com/microscopy/products/histology/slides.aspx#63414<br />
Figure 6.2.9: Precautions to exercise while working with fluids without an AR closed fluid cell: A) Place piece of<br />
plastic (or parafilm under sample; B) get some teflon screen printed slides from a vendor; C) make hydrophobic<br />
barriers around sample with silicone or a PAP pen.<br />
• A reservoir around sample can also be made.<br />
This can be done a variety of ways: the author<br />
has found that a silicone based adhesive, or<br />
vacuum grease (Dow Corning 976V) works very<br />
well to fabricate a fluid barrier on a glass slide.<br />
Figure 6.2.10 shows the cantilever holder above<br />
a droplet on a sample surrounded by vacuum<br />
grease.<br />
Plastic barrier<br />
droplet<br />
grease<br />
Figure 6.2.10: Droplet containment with vacuum grease.
Ryan’s MFP-3D Procedural Operation ‘Manualette’ Version 10 (v080501; Igor 6.03A); ©2008 6.32<br />
Put a small amount of the silicone product into a 1 to 5 mL syringe to control the amount coming out, much<br />
like what is used when piping frosting onto a cake, or a caulking tube. Templates can be drawn onto a piece of<br />
paper to get consistent sizes during application (Figure 6.2.9C). When choosing a silicone adhesive, check the<br />
ingredients to insure the solvents won’t interfere with your sample. If choosing any of these approaches, make<br />
sure the thickness of the barrier won’t prevent the cantilever holder from getting the tip to the surface (i.e. it<br />
doesn’t get hung up on the barrier), or you’ll never get the tip won’t engage, indicative of lack of hard engage<br />
in Z piezo meter, and ridiculous Deflection voltage variations (See Chapter 15 -Troubleshooting).<br />
• PAP pens can also be used to create a hydrophobic barrier around your sample; but they are more<br />
expensive.<br />
Another product that is pretty useful - inch wide adhesive stickers that act as a hydrophobic barrier. They are<br />
actually sold as spacers (called SecureSeal), but they polymeric material they are made from is sufficiently<br />
hydrophobic to use similar to the product in Figure 6.2.9B, yet comparably priced. Figure 6.2.11 below shows<br />
the package and one installed on a cheek cell sample (hence the sharp mark in the image which is the area<br />
the cells were put).<br />
http://www.gracebio.com/Products/Imaging__Microscopy/SecureSeal_Imaging_Spacers/<br />
Their CoverWell imaging chambers also look cool, and made of red silicone.<br />
http://www.gracebio.com/Products/Imaging__Microscopy/CoverWell_Imaging_Chambers/<br />
A<br />
B<br />
Figure 6.2.11: A) Adhesive hydrophobic<br />
barriers for standard microscope slides; B)<br />
installed with water drop on biological AFM<br />
sample.
Ryan’s MFP-3D Procedural Operation ‘Manualette’ Version 10 (v080501; Igor 6.04A); 7.1<br />
This section describes how to manage image<br />
channels: from how to turn on / capture<br />
additional input channels, or adjusting data scales<br />
during imaging. Topics include: Zooming on<br />
image features; save/ capture images; adjusting<br />
the Z scale of the image; real time section analysis,<br />
among others.<br />
7.0: Selecting image pixel density:<br />
The Scan Line and Scan Points (i.e., pixel density)<br />
is selected in the Main tab of the Master Panel<br />
using the respective setvar values. Note that the<br />
tip must be withdrawn to change these values,<br />
unless the Delay update checkbox is activated<br />
(See Sections 6.1.3 or 8.3 for more on the Delay<br />
Update function).<br />
• The aspect ratio of the image can also be<br />
changed in factors of 2, whole integer numbers.<br />
7.7E Igor Layouts 7.15<br />
This will automatically update the number of scan lines or points – for example, say a 1:1 image at 512 x 512<br />
was being collected, then changed to 1:4- the scan lines will be changed to 128 while the points will remain at<br />
512.<br />
One important calculation to keep in mind:<br />
Section topic page<br />
7.0 Selecting Image Pixel Density 7.1<br />
7.1 Master Channel Panel 7.2<br />
7.1A Adjusting Image Z scale 7.3<br />
7.1B Adjusting Trace/ Retrace 7.3<br />
7.1C Real Time Flattening 7.4<br />
7.1D Save Planefit 7.5<br />
7.1E Real Time / Saved displayed 7.5<br />
Channels<br />
7.2 Capturing Image Channels 7.5<br />
7.3 Offset Scan Area 7.7<br />
7.4 Zoom Scan Area 7.7<br />
7.5 Determining Multiple Offset/<br />
Zoom Parameters within Scan<br />
7.8<br />
Pixel Size = (Scan Area / # of pixels)<br />
Area:<br />
7.6 Real Time Section Analysis 7.9<br />
7.6A Basic Real time Section analysis 7.9<br />
7.6B Adjusting angle of line section 7.11<br />
7.6C Plotting multiple line sections 7.12<br />
7.6D Export the line section XY data: 7.12<br />
7.7 Other <strong>St</strong>uff 7.13<br />
7.7A Windows Manager 7.13<br />
7.7B Saving Igor Experiments 7.13<br />
7.7C Adding Meters to S&D Meter 7.14<br />
7.7D Modifying Trace Appearance 7.14<br />
For example, for a 512 x 512 pixels in a 5μm scan area, each pixel is 9.76nm 2 ; while in a 90μm scan area, each<br />
pixel covers 175.78nm 2 .<br />
So make sure the feature of interested has a high enough resolution such that it isn’t pixilated, but isn’t so<br />
high that it doesn’t take 2 days to collect the image.<br />
• The absolute number of simultaneous data channels at high pixel resolution is difficult to quantify, but is<br />
directly related to computing power. For example, twelve channels at 2k x 2k can be collected with the stock<br />
PC, or three channels at 4k x 4k. At lower pixel resolution (512 x 512), up to twenty images can be<br />
simultaneously collected. Obviously the higher the pixel density, the longer it takes to collect that data.
Ryan’s MFP-3D Procedural Operation ‘Manualette’ Version 10 (v080501; Igor 6.04A); 7.2<br />
Some notes on selecting pixel densities-<br />
• Unless the Delay update checkbox is activated, the tip must be withdrawn to change these values. If the<br />
Delay Update checkbox is activated, the user can change the pixel density and have it take place once the<br />
scan reaches top or bottom, or the ‘Frame Up’ or ‘Frame Down’ button is clicked.<br />
• Since Igor is a memory based program, collecting images with very large pixel densities (i.e, 2 to 4k x 2 to 4k),<br />
is most likely to occur with a fresh experiment / template (as opposed to one that has a lot of information<br />
already stored in it). To help accommodate this, saving images to memory is not recommended.<br />
The author often uses a low pixel density to scan quickly to find an area of interest, then increase it to get the<br />
good image.<br />
7.1: Master Channel Panel-<br />
This panel is where to select data channels to display & capture; adjust Z scales; color tables and flattening.<br />
OPENING IMAGE CHANNELS:<br />
▪ To open/ activate additional image channels before tip is scanning, go to the Master Channel Panel to do<br />
this. The default MFP-3D software is set for AC mode with Height, Amplitude and Phase channels (Figure<br />
7.1.1A) to be open in the Master Channel Panel, but it’s a good idea to always capture the Z sensors data too,<br />
especially when working with topography features larger than 500 nm (Figure 7.1.1B). Why?? Because the<br />
closed loop sensors are very linear and quiet over their range, whereas the piezo voltage (i.e., height channel<br />
suffers from piezo creep & hysteresis).<br />
What ever the first channel tab is selected as, it will be 32 bit; all others are 16 bit.<br />
Additional image channels CANNOT be activated during scanning.<br />
▪ Pull-down menus in the Master<br />
Channel Panel are self<br />
explanatory- and the help<br />
menus (question marks) to the<br />
right explain features further:<br />
Color Map, Live Display (Section<br />
7.1B), and Live Flatten (Section<br />
7.1C) should be selected to the<br />
user’s preference.<br />
A<br />
▪ (The author suggests…) Save<br />
both Trace and Retrace images!<br />
- just in case there is sample<br />
slope or some debris stuck to<br />
one side of the tip that will give<br />
an imaging artifact). Capturing<br />
the trace and retrace data<br />
usually increase your chances of<br />
obtaining that ‘publication quality’ image.<br />
<br />
<br />
<br />
7<br />
8<br />
<br />
<br />
Figure 7.1.1: A) Master Channel Panel; B) Selecting additional channels<br />
from Input pull down menu in the Master Panel.<br />
The Input pull-down menu- choose what data channel to display per respective tab; Note: only activated<br />
when tip is not scanning.<br />
<br />
<br />
<br />
B
Ryan’s MFP-3D Procedural Operation ‘Manualette’ Version 10 (v080501; Igor 6.04A); 7.3<br />
The Data Scale setvar- adjust the Z scale of the image here; or click the ‘Fix’ button to left of setvar to<br />
autoscale (see Section 7.1A).<br />
The ‘Auto’ checkbox autoscales the Z scale data during imaging (see Section 7.1B).<br />
The Data Offset setvar- adjust where the center of the (Z) Data scale of the image here, or click the ‘Fix’<br />
button to left of setvar to autoscale.<br />
The ColorMap pull-down menu offers many color tables.<br />
The Live Flatten pull-down menu (see Section 7.1C).<br />
7 The Save Planefit pull-down menu (see Section 7.1D).<br />
8 The Capture What pull-down menu (see Section 7.1E).<br />
The Live Display pull-down menu (see Section 7.1E).<br />
Show Scope (see Section 7.1B).<br />
7.1A: ADJUSTING IMAGE Z SCALE-<br />
There are many ways to adjust the Z scale in the image channel:<br />
Click Auto check box in top left hand corner of image channel tabs in the Master Channel Panel.<br />
Click the ‘Fix’ button to the left of the Data Scale setvar parameter window.<br />
Draw a quadrangle onto the image window, right (or left) mouse click inside the selected area and select<br />
‘Fix Scale’. This will fix the scale according to the Z values within the selected area.<br />
Alternatively, you can select ‘Fix All Scales’ which will rescale the Z data in all imaging data channels. It’s a<br />
very nice feature.<br />
Manually type a value, or use setvar arrows, in the Data Scale setvar parameter window.<br />
7.1B: ADJUSTING TRACE/ RETRACE SCALES:<br />
The individual Trace and Retrace images can be viewed and saved by selecting them in the respective pulldown<br />
menu on the Master Channel Panel. To view Trace or Retrace, confirm proper check box is selected.<br />
▪ The red bar/cursor to the left of the image indicates which scan line the tip is located (i.e., which<br />
slow scan line it’s rastering).<br />
▪ Trace or Retrace oscilloscope scan lines below the image can be turned ON or OFF<br />
with the ‘Show Scope’ check boxes at the bottom of the Master Channel Panel.<br />
Trace is Red; Retrace is Blue.<br />
▪ The Auto check box (if checked) auto scales the trace/retrace lines (below the image) with<br />
every slow scan line added. Typically, it shows the slope of the sample relative to the tip,<br />
because it’s auto-scaled- even if the slope (Z) is sub-nanometer over several tens of microns (XY), its still going<br />
to display slope because its auto-scaled (Figure 7.1.2A).<br />
▪ If the Auto checkbox is unchecked, it scales to the Data Scale setvar value. For example, if the Data scale<br />
value is too low, then trace/ retrace will be clipped (as seen in Figure 7.1.2B); this also depends on the Data<br />
Offset value.<br />
▪ Figure 7.1.2 shows an example result in the trace/ retrace lines from changing the Data Scale setvar value.<br />
Notice in 7.2B, the larger peaks are clipped because the Z scale is lower (red ellipse). By increasing the Z scale,<br />
the entire traces can be scaled down (Figure 7.1.2C).
Ryan’s MFP-3D Procedural Operation ‘Manualette’ Version 10 (v080501; Igor 6.04A); 7.4<br />
A<br />
B<br />
Figure 7.1.2: Effects of adjusting the Data Scale: A)<br />
‘Auto’ checkbox activated; B) Auto checkbox unchecked,<br />
smaller Data Scale defined in setvar window- Notice<br />
larger features clipped in the Trace/Retrace lines; C)<br />
‘Auto’ checkbox unactivated, larger Data Scale defined<br />
in setvar window.<br />
C<br />
▪ The Data and Offset Scales of the Trace and<br />
Retrace image channels can be separately controlled<br />
by clicking the ‘Setup’ button in the Master Channel<br />
Panel (Figure 7.1.3). The upper set of scale setvar<br />
applies to the Trace image, while the lower will<br />
apply to the Retrace. From the author’s<br />
understanding, if just the top is open, it will apply to<br />
both Trace and Retrace images of the respective<br />
channel.<br />
• It’s a good habit to always save the data as raw,<br />
unflattened data- to do this, select None in the Save<br />
Planefit pull-down menu (see Section 7.1.3D).<br />
Trace<br />
Image<br />
Retrace<br />
Image<br />
7.1C: REAL TIME FLATTENING:<br />
Figure 7.1.3: Activating Data Scale and Offset<br />
setvar windows for Trace and Retrace<br />
images. Green arrow: Choosing live flattening<br />
The Live Flatten pull-down menu allows the real<br />
time scan to be flattened via plane, or line, Masked Line, or not at<br />
all. This modification is only applied to real time data, but do not<br />
apply to saved data.<br />
None: leaves you with your raw data.<br />
Offset: takes the average value of the scan line, and subtracts<br />
that from the data.<br />
Line: Fits each scan line to a straight line, subtracts this line out of the scan line.<br />
Masked Line: (New feature!) this fits a line to each scan line, but doesn't use any data on the line that is more<br />
than 1/4 of the Data Scale away from the line. If you change the Data Scale the lines after the change are<br />
affected, but not the lines already done. If you do want to redo the current lines, reselect Masked Line in the<br />
popup. NOTE: The author shamelessly copied that text from the help menu.
Ryan’s MFP-3D Procedural Operation ‘Manualette’ Version 10 (v080501; Igor 6.04A); 7.5<br />
7.1D: SAVE PLANEFIT:<br />
Caution: This will modify the Saved data.<br />
None: saves the raw data.<br />
Offset: takes the average value of the Image, and subtracts that from the data.<br />
Planefit: subtracts a first order XY Plane from the Image.<br />
The rest of these options modify your data quite a bit more. But you can return<br />
the data to its raw state with the Ultra Restore Layer button on the Modify panel.<br />
Flatten 0: this removes the offset from each individual line.<br />
Flatten 1: this removes the offset and slope from each individual line.<br />
Histo Flatten: this removes the offset from each line by looking at a histogram of each<br />
line to determine the offset. The slope is removed in the X direction by a planefit on the whole image.<br />
Magic Mask: this does a first order flatten on each line, then calculates a mask and redoes the flatten. This<br />
process is reiterated until it’s satisfied. This process is similar to flattening offline images (See Section 12.2.1)<br />
Magic Mask (Pits): Use this if the sample happens to be imaging something with pits. This algorithm can’t tell<br />
if the features are pits or bumps.<br />
7.1E: REALTIME OR SAVED DISPLAYS:<br />
Use the pull-down menus to display or save the trace, retrace or both images. The author suggests saving<br />
both traces, but rarely displays both, unless the sample is expected to give some interesting result on the<br />
trace and retrace.<br />
7.2: CAPTURING IMAGES:<br />
The process of capturing image files occurs in the<br />
Main Tab of the Master Panel (see Figures 6.1,<br />
8.1).<br />
Figure 7.2.1: Activating the Save Image <br />
checkbox in the Main Tab.<br />
Base Name- type a 17 character (or less) filename. The<br />
filename can’t start with a number-Igor doesn’t seem to like that.<br />
Base Suffix- type; The software is designed to do continuous capture, increasing the ‘Base Suffix’ by one<br />
with every additional captured image.<br />
Image ‘Note’ line allows an unlimited length of text to describe imaging / experimental conditions (Figure<br />
12.1.1); this can later be recalled in ‘Show Note’ option under in commands pull-down menu of the Display<br />
Window (offline analysis -see Section 12.1)<br />
Save Images checkbox; a dialogue will appear to choose where to save the image data. Use ‘Browse’<br />
button to change folders, or type a new folder name. Alternatively, the path can be typed in using colons (:) or<br />
\ to separate folders.<br />
During imaging, the button will change to ‘Save Partial’ -a function that allows the user to save a partial<br />
image the tip has withdrawn before the entire image has been collected.<br />
The ‘Save <strong>St</strong>atus’ tells you if it’s saving current scan or the next.<br />
‘Save Prev.’ saves the image scan previous if you didn’t initially save it to disk (it’s temporarily stored in<br />
experiment memory). This is a nice feature for the temporarily distracted.<br />
▪ ‘Browse’ lets you look at stored images (see Section 12 regarding more on introductory data analysis).
Ryan’s MFP-3D Procedural Operation ‘Manualette’ Version 10 (v080501; Igor 6.04A); 7.6<br />
Save Graphics File (standard Igor panel):<br />
▪ If you happen to just a want a screen shot of one of the<br />
windows, you can make it the forward most window, and<br />
goto File save Graphics… the dialogue shown in Figure<br />
7.2.2 will appear. There are many things that can be userdefined<br />
in this panel.<br />
Size: the size of the saved graphics image can be<br />
adjusted here.<br />
File Format- choose what type of file (TIF, JPEG,<br />
etc.)<br />
Resolution: choose 1, 2 or 4x the resolution- larger<br />
values good for larger presentations to reduce<br />
appearance of pixilation.<br />
File Name:<br />
Path: the ‘Path’ needs to be defined: do this by going<br />
to the main menu and choosing:<br />
<br />
<br />
<br />
<br />
Figure 7.2.2: Saving graphics in Igor- allows size,<br />
file type, screen resolution, filename, path to be<br />
defined by user.<br />
Misc New Path…; this will bring up the ‘New Symbolic Path’ dialogue (Figure 7.2.3)<br />
Name the Path; the author generally uses one letter because it’s easy.<br />
If the path needs to be changed, click the ‘Path’ button; this will bring up the ‘Pick a Folder’ dialogue-<br />
A<br />
B<br />
C<br />
Figure 7.2.3: Choosing a Path in Igor: Misc New<br />
Path… A) choose path; B) Browse or type path folder in;<br />
C) once proper path is designated, click ‘Do It’ button.<br />
Click the ‘Browse’ button to select the folder you want the data dumped; Click ‘OK’ button when complete.<br />
▪This will update the ‘New Symbolic Path’ dialogue with the proper path; Click the ‘Do It’ button, which will<br />
install the new path choice into the Path of the Save Graphics File window (Figure 7.2.2).
Ryan’s MFP-3D Procedural Operation ‘Manualette’ Version 10 (v080501; Igor 6.04A); 7.7<br />
7.3: Offset Scan Area:<br />
Images can be offset a number of ways:<br />
Manually typing in a value into the X, Y offset setvar parameter windows. For more precision, pull up the<br />
Igor cursors (Ctrl + i) and use one to get the coordinates of the center of the offset image.<br />
Using the Hamster wheel (with activated radio buttons) to move. The author doesn’t really recommend<br />
this since the Igor’s update time is the rate limiting step in the process.<br />
Place the cursor somewhere in the image, or trace/ retrace line, left click the<br />
mouse button and choose X, Y or X-Y offset, or Offset Next Scan from the pop-up<br />
menu that appears.<br />
Use the Igor Crtl + i cursors to determine and exact XY coordinate of the center of<br />
the offset; type these values into the X & Y offset setvar windows. See section 7.5 for similar example.<br />
During the same imaging session, the tip can be offset by performing a similar operation as described in 3,<br />
but on saved data. Since the closed loop sensors are so good in the MFP-3D, the tip will go to that area. See<br />
Section 7.5 for more description and example. NOTE: if the head has been touched for some reason between<br />
the time the image was captured and this type of offset is selected, there is a great possibility that the head<br />
had been displaced by a couple microns in the kinematic divots on the baseplate.<br />
7.4: Z MING images:<br />
There are multiple ways to zoom on an image feature:<br />
Manually type in a value into the Scan Area setvar parameter window; This will zoom with the same image<br />
center as the previous scan area- unless you manually offset, which would be a separate step (see Section 7.3).<br />
Use mouse cursor to draw a box around a feature of interest on image; the Igor<br />
mouse cursor will change shape to indicate a pop up menu is available; right<br />
mouse click and select ‘Zoom Zoom’, this will pick the smallest side of the<br />
(imprecise) rectangle that was created. Figure 7.4 shows an example of this to<br />
zoom.<br />
To be more precise, select ‘[edit] Zoom Zoom’ and manually type in the Desired<br />
Size value. Click ‘Do It’ to Zoom to the desired location.<br />
[edit] Zoom Zoom<br />
dialogue<br />
‘Nice’ Zoom Zoom rounds to a nice number for the scan area.<br />
▪ An example of Zooming can be seen in Figure 7.4 - using the left button of the mouse, a square/ rectangle is<br />
drawn around feature of interest; move the mouse back inside the quadrangle- a special cursor should appear<br />
that brings up a menu after right or left mouse click. Select ‘Zoom Zoom’ to decrease the scan area relative to<br />
the smallest side of the quadrangle; To make a more precise scan area, select ‘[edit] Zoom Zoom’ ; which will<br />
present a dialogue allowing you to manually type in a value (i.e., instead of 35.61 μm, 35 μm was selected).
Ryan’s MFP-3D Procedural Operation ‘Manualette’ Version 10 (v080501; Igor 6.04A); 7.8<br />
A<br />
B<br />
35<br />
30<br />
Resulting<br />
ZOOM<br />
25<br />
20<br />
15<br />
10<br />
5<br />
1.5<br />
1.0<br />
0.5<br />
0.0<br />
-0.5<br />
-1.0<br />
-1.5<br />
0<br />
0<br />
10<br />
20<br />
µm<br />
Figure 7.4: Here’s an example of zooming on a<br />
feature. Image: Moth eye in air using AC mode.<br />
30<br />
7.5: Determining multiple Offset/ Zoom parameters within scan area:<br />
There are two ways to do this-<br />
Use Igor cursor Ctrl + i to determine XY coordinates<br />
before offset zoom.<br />
A<br />
From a larger scan area image, zoom on one area,<br />
then use larger scan area saved data to zoom on second<br />
feature.<br />
In some instances, it is desirable to zoom into two<br />
separate areas/ features of interest from a larger scan<br />
area- The only problem is knowing the exact coordinates<br />
of the scan area image centers will be before hand so<br />
they can be typed into the Offset setvar values later…<br />
This is also easy to accomplish because of Igor.<br />
Click Ctrl + i to bring up the Igor Cursors.<br />
Place the cursors in the areas of interest, to determine<br />
the X,Y coordinates within the scan area.<br />
▪ It’s often a good move to record these numbers so you<br />
remember them, especially for the second image zoom/<br />
offset. In the command line, type a comment using two //<br />
forward slashes. You can easily retrieve these values by<br />
scrolling up into the history window (see Figure 7.5.1B).<br />
2) Zooms/ offsets can also occur from a saved image,<br />
NOTE: To be of significance, the saved image must be<br />
viewed while the MFP is still scanning within that 90 um<br />
XY scan area. Figure 7.5.2 shows an example of this.<br />
B<br />
Figure 7.5.1: A) Using the Igor Ctrl + I cursors to find<br />
XY coordinates within a scan area during real time<br />
imaging; B) copy coordinates in command line as<br />
comments.
Ryan’s MFP-3D Procedural Operation ‘Manualette’ Version 10 (v080501; Igor 6.04A); 7.9<br />
A<br />
B<br />
C D E<br />
Figure 7.5.2: Zoom/ offsets from saved data: A) real time scan to zoom in on one area; B) Using saved data of initial<br />
real time data to zoom on another area of interest; C) large saved image; D) real time zoom image (panel A); E) zoom<br />
from saved image blue box in C).<br />
7.6: Real Time Section Analysis:<br />
7.6A: Basic Real-Time Line Section Analysis:<br />
To measure a section line analysis during a Real Time image acquisition, open the Analyze panel (Figure 7.6.1).<br />
Go to MFP IP Analyze Panel.<br />
Click ‘Include RealTime’ checkbox .<br />
‘Line’ will be selected from the Mode pull-down menu because it’s unable to do ‘Free Hand’ lines in real<br />
time. See Figure 12.7.2.7 for examples of Free Hand line drawing sections.
Ryan’s MFP-3D Procedural Operation ‘Manualette’ Version 10 (v080501; Igor 6.04A); 7.10<br />
Click the ‘Draw’ button; pull cursor over image feature to draw a<br />
line on the feature of interest in the image (Figure 7.6.2A).<br />
Select Full Width checkbox for sections to traverse to the edge<br />
of scan areas along the line vector drawn (figure 7.6.1).<br />
▪ Multiple scan lines can be averaged to eliminate noise or give more<br />
statistical relevance to the sectioned line.<br />
▪ Once the line is drawn, a Section plot similar to Figure 7.6.2B will<br />
appear. The Igor cursors (Ctrl + i) can be placed on the curve to<br />
measure points on the line (notice blue cursors on of feature in<br />
image being measure at FWHM), which are displayed in the lower<br />
half of the Analyze panel (Figure 7.6.2B).<br />
Figure 7.6.1: Section tab of the<br />
Analyze panel.<br />
A<br />
B<br />
Figure 7.6.2: Real time section analysis: A) draw<br />
line on image; B) Corresponding section<br />
analysis, with user positioned Igor Cursors; C)<br />
lower portion of Analyze Panel gives specifics of<br />
line relative to cursor locations.<br />
If the Y axis data values doesn’t match the values in the S&D meter, some kind of real time<br />
flattening is probably activated, which will offset the data. Switch the real time flattening to ‘None’<br />
in the Master Channel Panel (Figure 7.1.1A).<br />
▪ If the image happens to possess some tilt, it won’t be intuitive to get a proper height from the cursors.<br />
On the section plot, Hold Crtl + Shift key over curve to be ‘leveled’ (Figure 7.6.3A).<br />
Right or left mouse click over the line scan; a double arrow will appear (Figure 7.6.3A).
Ryan’s MFP-3D Procedural Operation ‘Manualette’ Version 10 (v080501; Igor 6.04A); 7.11<br />
Move mouse up or down to make section level. (see Figure 7.6.3B); from here, the Igor Crtl + I cursors can be<br />
put on to measure the dY.<br />
A<br />
ZSensor<br />
-80<br />
-100<br />
-120<br />
-140<br />
-160<br />
B<br />
-180nm<br />
0<br />
10<br />
20<br />
30<br />
40<br />
50<br />
60<br />
µm<br />
Figure 7.6.3: Real time line section plot leveling to obtain more accurate height differentials. A) crtl + shift +<br />
mouse button over section to obtain double arrow cursor; B) move mouse up or down to level section.<br />
Click the ‘Export Table’ button in the Section Window to get these cursor stats (i.e.,<br />
X a , Y a , Z a ; X b , Y b , Z b ; plus differential values and angle values).<br />
7.6B: Adjusting the Angle of the Section<br />
Line via three different ways-<br />
Click the ‘Clear’ button in the Analyze panel<br />
and redraw a new line over feature of interest.<br />
A<br />
B<br />
Grab one of the end Igor cursors on the<br />
section line in the image by left mouse click &<br />
hold while dragging cursor to new point (Figure<br />
7.6.4A to B). This will also update the Angle<br />
setvar value.<br />
Use the angle check box to manually adjust<br />
with the Angle setvar window.<br />
Figure 7.6.4: Adjusting line section angles: A) drag one of<br />
the end Igor cursors to a new area; B) result.<br />
▪ To average multiple scan lines, enter the desired amount of<br />
scan lines to be averaged in the Width setvar window in the<br />
Section tab of the Analyze panel. Lines will be displayed with solid<br />
center indicating center, and dotted lines represent the averaging<br />
scan line width (Figure 7.6.5- a 25 line average in a 512 x 512 image<br />
resolution).<br />
Figure 7.6.5: Averaging multiple scan lines
Ryan’s MFP-3D Procedural Operation ‘Manualette’ Version 10 (v080501; Igor 6.04A); 7.12<br />
7.6C: Plotting multiple section lines displayed on one section plot-<br />
Create a section line as described above.<br />
Click the ‘Take a “Snap Snot” of active trace and append to upper graph’ Button.<br />
Create additional section line.<br />
Click the ‘Take a “Snap Snot” of active trace and append to upper graph’ Button.<br />
▪ Figure 7.6.6 shows an example of this-<br />
A<br />
C<br />
D<br />
B<br />
Figure 7.6.6: Plotting multiple section on one section plot: A) create first section plot; B) click “Snap Shot”<br />
button in Sections window; C) Create additional Section plot; B) click “Snap Shot” button in Sections<br />
window again; D) resulting multiple sections plot(s): red- single line 7.11A; blue: averaged line 7.10;<br />
green: single line 7.11C. Sample: Collagen in air.<br />
7.6D: Export the line section XY data:<br />
Click the ‘Edit’ button in the Section plot- this will bring up a table with a Y value, relative to the points in<br />
the Igor Wave (see Igor ‘Getting <strong>St</strong>arted’ manual to understand the definition of a wave), and the points where<br />
the blue cursors are- kind of meaningless for use with another spreadsheet.<br />
What the author would then do upon this inquiry is:<br />
Go to Windows New Table…<br />
Select SectionWaveX & SectionWaveY.<br />
Click ‘Do It’- this will create an X,Y delimited table from which numbers/ data can be cut and pasted.<br />
None of the Asylum Research inmates will verbally condone the use of programs other than Igor Pro.
Ryan’s MFP-3D Procedural Operation ‘Manualette’ Version 10 (v080501; Igor 6.04A); 7.13<br />
7.7: OTHER STUFF:<br />
7.7A: WINDOWS MANAGER: The windows manager helps find windows when you have a lot of different<br />
panels and tables open.<br />
Ctrl + 1 opens the window (Figure 7.7.1)- upper left window.<br />
Find the panel/ graph or table you are interested in, and double click- this will bring that window forward.<br />
Figure 7.7.1: The Windows Manager panel; hotkey: (Crtl + 1).<br />
7.7B: SAVING IGOR EXPERIMENTS:<br />
• Saving the Igor Experiment is a great way to begin right where you may have left off- when you save an<br />
experiment, all the panels, graphs, etc. will come up just as it was exited once loaded. Other advantages of<br />
saving them is that every command executed is stored in the History window. Recall that Igor is memory<br />
based, so many full days of this will make the file large, and ultimately slow the program.<br />
• One down side to it is that these .pxp experiments can be pretty big Mbyte wise. If you save pxp’s on a<br />
regular basis it’s a good idea to back these files up, or remove them from the lab PC so it doesn’t get bogged<br />
down due to a full harddrive.<br />
• In the author’s experience, the best way to open a saved expt is to have the MFP-3D software open (loaded),<br />
then go to File Open Experiment and select the saved expt you wish to open. NOTE: it will open if you use<br />
the same version (or slightly later) to open the saved experiment with. See Section 14.17 for more on this.
Ryan’s MFP-3D Procedural Operation ‘Manualette’ Version 10 (v080501; Igor 6.04A); 7.14<br />
7.7C: Adding Meters to S&D meter:<br />
▪ To view additional signals in the S&D meter:<br />
Click the ‘Setup’ button,<br />
Change the parameter of interest <strong>St</strong>atus pull down menu<br />
From ‘Auto’ or ‘Off’, to ‘On’;<br />
Click the ‘Done’ button.<br />
▪ Figure 7.7.2 shows the phase signal being selected, such<br />
that the quantitative value of the Phase signal can be seen<br />
during imaging to aid user to whether the tip is<br />
experiencing net attractive or repulsive forces as it interacts<br />
with the surface (Section 6.1.4).<br />
Figure 7.7.2: Turning on additional meters in the<br />
S&D meter.<br />
7.7D: Modifying Igor Graphs:<br />
▪ To adjust line thickness (in any Igor Pro window), color<br />
or appearance, double click the mouse on the plotted<br />
line, and the Modify Trace Appearance dialogue will<br />
come up (Figure 7.7.3). Here the thickness, color, line<br />
style, and mode can be defined. When complete, click the<br />
‘Do It’ button.<br />
Figure 7.7.3: Modify Trace Apparence dialogue.
Ryan’s MFP-3D Procedural Operation ‘Manualette’ Version 10 (v080501; Igor 6.04A); 7.15<br />
7.7E: Igor/ MFP-3D Layouts:<br />
Additionally, the MFP-3D software has these items<br />
called ‘Layouts’ , and they’re not kidding when the say<br />
they are awesome! (Figure 7.7.4B).<br />
B<br />
A<br />
•Any data you have worked up in the offline analysis can<br />
be dumped into one of these layouts by click the layout<br />
button. (See Section 14.13).<br />
To save the layout, go to File Save Graphics; the Save<br />
Graphics File dialogue comes up- here you can<br />
determine what file type to save the file as; the name;<br />
and the Path (see Section 14.2)<br />
Figure 7.7.4: A) Saving the layout as Graphics file; B) Igor Layout example.<br />
Use the Igor tool box (Ctrl + T); upper left corner to add text or shapes to the Layout.<br />
• Only single page layouts can be created this way.
Ryan’s MFP-3D Procedural Operation ‘Manualette’ Version 10 (v080501; Igor 6.04A); 8.1<br />
Contact mode AFM (also known as constant force mode) is one of the more commonly used imaging modes in<br />
AFM. It is often used in imaging of hard materials, in some electrical techniques and to image biological<br />
materials- e.g. cells under low set point force and scan rate (because cells are big bags of water, they can be<br />
easily oscillated using AC mode on them- contact mode works great, and the Deflection images shows a great<br />
deal of detail). The features described in Chapter 7 also apply to this and all imaging modes on the MFP-3D.<br />
Section Topic<br />
page<br />
8.1 Set up & Initial Parameter Selection 8.1<br />
8.2 Tip Engagement 8.3<br />
8.3 Fine Tuning Imaging Parameters 8.4<br />
8.4 Lateral Force Microscopy 8.5<br />
8.1: SET UP AND INITIAL PARAMETER<br />
SELECTION:<br />
In the Main tab of the Master Panel, select ‘Contact’ from the<br />
Imaging Mode pull down menu (Figure 8.1, red ellipse).<br />
Parameters highlighted in orange will be mainly used to fine<br />
tune imaging parameters when scanning (see below).<br />
Radio<br />
Button<br />
Image channel selection: Go to the Master Channel panel:<br />
At the ‘Input’ pull down menus choose the following image<br />
channels: Height, Z sensor and Deflection (Figure 8.2). If doing<br />
Lateral Force Microscopy, choose Lateral in an additional 4 th<br />
channel.<br />
Figure 8.1: Contact mode imaging<br />
parameters<br />
Figure 8.2: For Contact mode imaging,<br />
select Height, deflection and Z Sensor<br />
channels
Ryan’s MFP-3D Procedural Operation ‘Manualette’ Version 10 (v080501; Igor 6.04A); 8.2<br />
If you don’t change from the default AC mode image channels of amplitude and phase, these<br />
channels won’t produce any meaningful data in Contact mode- they must be changed prior to<br />
imaging in contact mode.<br />
NOTE: Scan angle should be at 90° for lateral force microscopy (LFM). This may be obvious, but the<br />
author mentions it because some other commercial scopes scan perpendicular to the lever at 0°. See<br />
Section 8.4 for more on LFM.<br />
It’s a good habit to activate the Z sensor channel when imaging, especially when sample features are<br />
larger than a few hundred nanometers- the LVDT sensors are more linear than the piezos, and thus<br />
it’s a more precise Z measurement.<br />
For more on the Master Channel Tab, see Section 7.1.<br />
With a properly loaded cantilever, adjust the Photodetector (PD) to a slightly negative value. The slight<br />
negative free air deflection will place the SLD spot in the middle of the PSD (where the range is more linear)<br />
when the tip is engaged.<br />
▪ To conceptually help aid the selection of a Set Point voltage, a qualitative depiction of cantilever deflection vs.<br />
tip-substrate distance is shown in Figure 8.3. The contact point is when the Set Point deflection voltage is equal<br />
to the cantilever Set Point deflection value- this is when the cantilever starts to experience positive deflection<br />
due to the applied force from the piezo. Low set point forces will be slightly more positive Set Point voltages<br />
than the free air deflection voltage, while larger forces are much more positive than the free air deflection<br />
voltage. To know exactly how much force is being applied during imaging or a manipulation, the cantilever<br />
spring constant must be determined- See Chapter 9.<br />
Figure 8.3: Qualitative depiction of Cantilever Deflection vs. Tip-Substrate separation.<br />
Choose a Set Point voltage that is more positive than the free air deflection value in the S&D meter. In Figure<br />
8.4, the free air deflection is -0.20 V: therefore a Set Point voltage of -0.19V or more positive is what is needed to<br />
engage the tip. Set Point voltages near (just positive of) the free air deflection means the tip will apply low force<br />
to the sample (or false engage), while Set Point voltages much more positive than the free air deflection voltage<br />
means the tip will apply greater force to the sample.
Ryan’s MFP-3D Procedural Operation ‘Manualette’ Version 10 (v080501; Igor 6.04A); 8.3<br />
Figure 8.4: Choosing a Set Point voltage in<br />
Contact Mode: Set point must be more positive<br />
than the free air deflection voltage.<br />
▪ On the Main tab (Figure 8.1), adjust the highlighted parameters (dependent on sample):<br />
Integral gain (I): 8 to 10: allows the Integral gain to be responsive enough upon feedback servo activation.<br />
Scan rate: 1 Hz; for softer samples, choose a slower Scan Rate.<br />
Scan angle, resolution (scan points & lines) and image size is up to you.<br />
Rotating the scan angle results in counter clockwise rotation with positive rotation angle values<br />
▪ At this point you are ready to engage for an imaging-only application (i.e., if you are not interested in knowing<br />
the cantilever spring constant to know what forces are applied at a given Set Point voltage). See Chapter 9 if<br />
you want/need to determine cantilever spring constant.<br />
8.2: TIP ENGAGEMENT:<br />
Click ‘Engage’ in the Sum and Deflection window (Figure 8.4). Notice the Z-piezo voltage maximizing all the<br />
way red (150 V), indicating the Z- piezo is fully extended in anticipation of engagement of the feedback servo.<br />
Slowly turn the thumbwheel counter-clockwise (towards the surface; rate ~ several microns per second) until<br />
the deflection voltage value on the S&D meter equals the user defined Set Point, AND you here a chime sound<br />
(computer speaker volume must be on). The feedback servo is now activated. You will also notice the Z-piezo<br />
voltage meter goes from ‘railed’ in the red (150 V), to some lesser value.<br />
If you have the volume up on the transducer (front of controller, headphones plugged in), you can<br />
hear a frequency change as engagement occurs- it will sound like static and will change to a<br />
dampened sound when in contact.<br />
GENTLE ENGAGEMENT: Soft engages, similar to those described in Section 6.1.2B, and also can be done in<br />
Contact Mode. Choose a Set Point voltage slightly more positive than the free air deflection voltage; you can<br />
proceed by clicking the ‘Engage’ button and wheel the tip down until the feedback servo is engaged.<br />
An even more gentle engagement occurs by wheeling down 10 μm, then click<br />
‘Engage’; if the tip doesn’t engage, click ‘Withdraw’ button, wheel down another 10<br />
μm, and repeat. Notice that each graduation on the front thumbwheel is 1 μm.<br />
Once feedback has been activated, continue to lower the head with the front<br />
thumbwheel to ~ 70 V (i.e. no color in Z-Piezo meter). This indicates the piezo is in the middle of its Z- range (~<br />
7.5 μm standard head; ~ 20 μm extended head).
Ryan’s MFP-3D Procedural Operation ‘Manualette’ Version 10 (v080501; Igor 6.04A); 8.4<br />
▪ At this point the tip is engaged and just sitting on the surface- it does not begin rastering until you tell it to do<br />
so. You can now being imaging (see next step) or determine the Spring Constant (see Chapter 9).<br />
If the Z-piezo voltage is railed all the way blue (-10 V) upon clicking simple engagement, the piezo is<br />
fully retracted because it thinks it has crashed. This indicates a false engagement and adjustment<br />
must be made to the Set Point voltage to allow extension of the piezo. This often occurs when<br />
imaging in fluids/ high humidity, or too low a Set Point voltage (i.e. low force).<br />
Is the acoustic hood hatch still open?-<br />
Probably. Follow steps to preserve the tip’s apex while shutting the door:<br />
Use the Hamster to decrease the Set Point voltage to pop the tip off the<br />
surface.<br />
Close the hood door.<br />
Increase the Set Point voltage with the Hamster again to hard engage;<br />
Proceed scanning.<br />
8.3: FINE TUNING IMAGING PARAMETERS:<br />
Click the ‘Do Scan’ button on the Main tab. After a brief moment, imaging will begin.<br />
Tune the parameters with Set Point force, Integral<br />
gain (I) and Scan Rate. Use the arrow clickers (to<br />
right of setvar windows) to adjust parameters,<br />
opposed to typing values in, OR- see next bullet…<br />
▪ Alternatively, you can fine-tune the parameters<br />
using the ‘Hamster’ wheel on the front of the<br />
controller. Any parameter with a ‘radio’ button next<br />
to it (Figure 8.1) can be changed during a scan<br />
when it is activated (looks like black/ green dot in<br />
circle) with the ‘Hamster’. The Hamster gives “digital<br />
control with analog feel”. The toggle switch to the<br />
left of the Hamster allows you to toggle between<br />
radio buttons in the panel. This is a GREAT feature<br />
for tuning on the fly, and you don’t need to use the<br />
mouse. (The Hamster is also functional in the Force<br />
panel, described later in the Section 11).<br />
Height Channel<br />
A<br />
B<br />
Image quality can be monitored by image<br />
resolution and amount of noise in the line traces<br />
(located below images).<br />
The Set Point voltage and Integral gain should<br />
first be adjusted to achieve good tracking. Figure<br />
8.5 shows an example of imaging a calibration grid,<br />
with corresponding parameters from Main tab<br />
below. Panel A) shows the initial tracking of the tip<br />
upon engagement with a Set Point voltage of<br />
0.4V (free air was ~ -0.45V). B) Shows that with an<br />
Figure 8.5: Image parameter tuning in Contact Mode of<br />
calibration grid.
Ryan’s MFP-3D Procedural Operation ‘Manualette’ Version 10 (v080501; Igor 6.04A); 8.5<br />
increase in Set Point force (i.e. more positive Set Point voltage) and slight increase in Integral gain, tracking is<br />
improved greatly.<br />
Don’t be alarmed if you have too crank up the Integral gain when using long floppy cantilevers- the gain is<br />
related to the optical lever sensitivity (more gain for less sensitivity).<br />
The second parameters to adjust are the Scan Rate & Scan Angle. Having a vague idea of the orientation of<br />
the tip on the cantilever can make scanning at 90º more advantageous than 0º because of the shape of the tip<br />
at the end of the cantilever. Some cantilever manufacturers compensate for the slight angle the cantilever is<br />
mounted relative to the surface by having the front and back angles of the pyramid at different angles. Typically<br />
the<br />
The Delay Update checkbox allows the user to change the<br />
parameters during a scan, which will take effect at the end of that<br />
scan. During the period before update, the parameters changed will<br />
be highlighted in a light blue color. Notice that setvar without radio<br />
labels, these highlights also occur because these values only take effect when<br />
the frame is finished (e.g. scan rate).<br />
•It’s also great for changing the number of scan lines and points on the fly (i.e., image pixel density).<br />
-Without the Delay Update checkbox activated, the tip has to be withdrawn to change either the Scan Lines<br />
or Scan Points setvar values. The author is superstitious enough, and has had experiences where the tip is<br />
somehow changed during this withdraw step.<br />
-However, with the Delay Update checkbox activated, these parameters can be changed, then click the<br />
‘Frame Up’ or ‘Frame Down’ buttons to activate this new change- Notice the tip stays on the surface (S&D<br />
meter- Z piezo voltage). This makes scanning the surface at a lower value of scan points and lines to look for<br />
something more efficient (quicker), then increase for higher resolution imaging.<br />
8.4: LATERAL FORCE MICROSCOPY:<br />
Lateral Force Microscopy (LFM) can easily be performed on the MFP-3D.<br />
In the Master Channel Panel, confirm that Deflection and Lateral channels are selected. See Section 7.1 &<br />
Figure 7.1.1 for more detailed description).<br />
In the Main tab of the Master Panel, confirm the Scan Angle setvar is set to 90º.<br />
Confirm the imaging mode is set to Contact mode.<br />
Engage tip; as described in Section 8.2<br />
• Figure 8.6 shows an LFM image of a micro-contact printed alkanethiols on polycrystalline gold. The bright<br />
areas of the LFM images are terminated with a carboxylic acid, while the dark areas are a methyl terminus.<br />
AR does manufacture a head that has the ability to mechanically zero the SLD spot in the center of the PSD.
Ryan’s MFP-3D Procedural Operation ‘Manualette’ Version 10 (v080501; Igor 6.04A); 8.6<br />
µm<br />
35<br />
30<br />
25<br />
20<br />
15<br />
10<br />
5<br />
35<br />
A<br />
30 B C<br />
6<br />
4<br />
2<br />
0<br />
-2<br />
-4<br />
-6<br />
nm<br />
25<br />
20<br />
15<br />
10<br />
5<br />
20<br />
10<br />
0<br />
-10<br />
-20x1<br />
0<br />
0<br />
10<br />
20<br />
µm<br />
30<br />
0<br />
0<br />
10<br />
20<br />
µm<br />
Figure 8.6: A) Contact mode Height image of µCP pattern of –S(CH2)10CH3 and –S(CH2)10COOH; B: LFM image –<br />
bright areas of image represent –COOH terminus; C) ARgyle 4D rendering of lateral channel painted onto Height<br />
channel.<br />
30<br />
Electronic ZEROING LATERAL SIGNAL:<br />
A standard MFP-3D head does not have a mechanical means to zero the lateral deflection on the PhotoDiode,<br />
for reasons not to be discussed herein. There is an electronic way to zero the deflection- it’s an igor procedure<br />
file (.ipf) called LFM Rocks- contact support for this file.<br />
Load the LFM Rocks ipf- goto File → Open File → Procedure; load LFM rocks from wherever it’s saved.<br />
Compile the .ipf by clicking the compile button at the<br />
lower left of the .ipf window. Once compiled, this button will<br />
no longer be visible. To learn more about compiling Igor<br />
procedure files, read the Igor manual.<br />
To zero the lateral signal, go to to Macros→ ZeroLateral; (Figure 8.7B) the lateral signal will electronically be<br />
zeroed.<br />
A<br />
B<br />
Figure 8.7: Zeroing lateral deflection<br />
with LFM Rock ipf: A) typical lateral<br />
signal from a given cantilever (see<br />
Section 7.7C to view lateral signal): B)<br />
with LFM rocks compiled, select<br />
ZeroLateral from Macros in menu bar;<br />
C) result- electronic zeroing of lateral<br />
signal.<br />
C
Ryan’s MFP-3D Procedural Operation ‘Manualette’ Version 10 (v080501; Igor 6.04A); 8.7<br />
ARUP (User Panel) LFM friction loop-<br />
▪ You may have noticed in the AR user panel menu that there is something called LFM Friction Loop. In most<br />
cases, this isn’t going to be useful to the average or even advanced MFP-3D user- the reason being that unless<br />
you have one of the High Bandwidth Heads, and you have the mechanical lateral zeroing head (another option<br />
seldom chosen), the BW on the lateral signal is something silly like 50kHz- this friction loop signal is more or less<br />
going to be noise.<br />
This user panel was designed by our programmers as an attempt to help a customer (whom has the high BW<br />
head with mechanical lateral zeroing) to figure out the lateral InvOLS from the turnaround area at the end of<br />
the scan line.<br />
The author mentions it so you don’t waste your time with it-
Ryan’s MFP-3D Procedural Operation ‘Manualette’ Version 10 (v080501; Igor 6.04A); 9.1<br />
Section Topic page<br />
9.1 Thermal method 9.1<br />
<strong>St</strong>ep 1 Virtual Deflection Calibration 9.1<br />
<strong>St</strong>ep 2 InvOLS calibration 9.5<br />
InvOLS averaging 9.7<br />
<strong>St</strong>ep 3 Thermal Tune 9.9<br />
9.2 Misc. Operations 9.11<br />
9.3 Sader Method 9.12<br />
9.4 Spring Constant Tutor 9.13<br />
‘Thermal Noise Spring Constant<br />
Calibration Technique’ by Roger Proksch<br />
9.14<br />
9.1: Thermal Method (for determining Spring Constant)<br />
The determination of spring constant, k, is a quick 3-step procedure:<br />
Determine the ‘Virtual Deflection’ of the optical path.<br />
Determine the slope of contact region from a force curve to determine the ‘inverse optical<br />
lever sensitivity’ of the cantilever (in nm/V).<br />
Withdraw tip & perform a thermal tune to determine the cantilever’s resonant frequency. An<br />
algorithm computes the spring constant using the equi-partition theorem.<br />
This protocol can also be found in the Spring Constant Tutor: to view it in the MFP-3Dsoftware, go to<br />
Programming <strong>St</strong>art User Panel SpringConstantTutor. It reads remarkably similar to this section, just more<br />
eloquently. It even has an all in one panel set up that contains everything you need to do to complete the k<br />
determination, see Figure 9.9.<br />
A simplified technical note on spring constant calibration via the thermal method entitled Spring Constant<br />
Calibration by Roger Proksch, PhD. can be found at the end of this chapter.<br />
NOTE: If at all possible, it is best to do the spring constant calibration in air due to the higher<br />
cantilever Q (relative to the generally low cantilever Q in fluid).<br />
STEP 1:<br />
Determine Virtual Deflection in Optical Path:<br />
The virtual deflection is a mechanical coupling of the deflection signal with the Z movement, a result of the<br />
mechanical path not being quite perfect, resulting in a slight slope in the force curve. Although this may only<br />
be a few nm’s over several microns, if not corrected, it can skew the accuracy in measurement / analysis of the<br />
force to be determined. The exact origin of it is still not fully understood, but it depends on how the light is<br />
aligned on the lever as it travels through the piezo range. By performing this step first, it will give you a more<br />
precise estimate of the cantilever spring constant.<br />
▪ The virtual deflection correction essentially ‘levels’ the free air part of the force-distance curve (i.e. constant<br />
deflection). This in return aids force curve analysis because the free air baseline will have a constant deflection<br />
value until it makes contact or some other force is imparted upon the tip. In many dissociation based force<br />
measurements, analysis generally averages some section of the free air to find the zero contact point of the<br />
retract portion of the curve; having a baseline with a constant deflection value makes this more precise.
Ryan’s MFP-3D Procedural Operation ‘Manualette’ Version 10 (v080501; Igor 6.04A); 9.2<br />
▪ Before performing the first step, put the tip on the surface by engaging in CONTACT MODE on a clean,<br />
(infinitely) hard surface* (i.e., freshly cleaved mica, clean glass slide, cleaved graphite). Avoid bumpy surfaces<br />
such as an evaporated metal film like Au on glass, or dirty sample, because the tip may experience some<br />
slipping on the surface if on an asperity.<br />
*An infinitely hard surface will have a slope of unity in a distance vs indentation plot- See Section 11.2.<br />
A more detailed description of Contact Mode can be found in Section 8, but in brief:<br />
Select ‘Contact’ from the Imaging Mode pull-down menu on the Main Tab of the Master panel.<br />
Select a Set Point voltage (force): low Set Point voltage (force) is slightly more positive (in volts) than the<br />
value of the ‘Free Air’ Deflection (in Volts) in the S&D meter; higher Set Point voltage (force) are much more<br />
positive than the free air deflection voltage value. Low set point forces avoid truncating the tip’s apex. Refer<br />
to Figures 8.3. & 8.4.<br />
Integral gain = 7 to 10 is usually sufficient.<br />
Click the ‘Engage’ button on the S&D meter.<br />
Engage tip by slowly turning the thumbwheel (CCW) until the<br />
Deflection voltage matches the Set Point voltage; a bell sound will<br />
chime if speaker volume available; with continual approach with the<br />
thumbwheel, the z-voltage value goes from railed (150 V, red), to some<br />
other lower voltage value; adjust this down to around 70 V (no color in z-<br />
voltage meter).<br />
NOTE: if you need to engage as gently as possible, it’s best to<br />
do a false engagement in AC mode first, increase the Set<br />
Point force until the tip hard engages at the minimum<br />
possible force; then switch over to Contact mode once<br />
engaged. See Section 6.1.2 for this gentle engagement procedure.<br />
Click on the Force Tab of the Master Panel (Figure 9.1): This panel is set<br />
up so the user can define the specific distance the piezo travels during<br />
the force-distance cycle (called ‘Force Distance’).<br />
For a more detailed description of the Force Tab, see Section 11 (Force<br />
Spectroscopy)-<br />
▪ The white bar on the left side of the window represents the entire Z<br />
range of the z- piezo in the AFM head. The red bar represents the ‘Force<br />
distance’- a user defined approach/ retract cycle distance that the Z-<br />
piezo moves during the force-distance curve acquisition. As you change<br />
the value of the force distance, notice that the size of the red bar’s<br />
length changes. This can also be activated with the Hamster wheel, or by<br />
clicking on the red bar and dragging the mouse.<br />
Figure 9.1: Force tab of the master<br />
panel with calibration sub-tab shown.
Ryan’s MFP-3D Procedural Operation ‘Manualette’ Version 10 (v080501; Igor 6.04A); 9.3<br />
Initial Parameter adjustment- set parameters similar to Figure 9.1.<br />
Activate the radio button for ‘red’ mode (force distance bar is red)- this means the tip starts the approach/<br />
retract cycle off the surface .<br />
Slide the red force distance bar all the way to the top of the white vertical Z range bar.<br />
Choose a ‘Force’ distance (0.5 to 1 μm).<br />
Velocity of 1 μm/s.<br />
Activate the ‘Trigger’ from the Trigger channel pull-down menu- choose the ‘DeflVolts’ channel.<br />
▪ The trigger point value is the amount of positive deflection (or force, or Z distance) the tip experiences in<br />
contact with the surface before the piezo switches direction for the retraction part of the curve.<br />
Activate the ‘relative’ trigger radio button.<br />
Enter a ‘trigger’ point value of 0.4 to 0.6 V. Most other parameters in Figure 9.1 are not important at this<br />
point.<br />
Click ‘Single Force’ button; Notice the Z piezo voltage extends the tip to approach the surface, reverse<br />
direction when it finds the surface, then retracts and eventually stops at a voltage value that correlates with<br />
the user defined Force Distance.
Ryan’s MFP-3D Procedural Operation ‘Manualette’ Version 10 (v080501; Igor 6.04A); 9.4<br />
▪ A Force – distance curve should look similar to one in Figure 9.2A; Notice the very long approach (red) curvethis<br />
is because the piezo was traveling toward the surface waiting to reach a force equal to the trigger point<br />
selected. This long free air is what’s needed for Virtual deflection correction so the linear region of it can be fit.<br />
A<br />
B<br />
D<br />
C<br />
Figure 9.2: Calibrating the virtual deflection: A) initial force curve has long approach curve (red);<br />
place the Igor cursors on linear region of free air part of the approach curve; B) select Virtual Defl<br />
from Set Sens pull down in Cal sub-tab of Force tab in master panel; C) resulting linear curve fit; D)<br />
removing fit trace from force curve<br />
With the force plot window active, hit Ctrl + i which brings up a panel on the bottom of the plot that has<br />
Igor cursors (A:⊗, B:⌧; with their respective X-, Y-, dX & dY values). The author calls these Igor Cursors because<br />
they can be called up on any Igor Pro plot.<br />
Place the Igor cursors on linear part of free air approach (red) curve (Figure 9.2A). The object of this exercise<br />
is to fit a large Z distance (several microns) to make the virtual calibration more accurate.<br />
Make sure both cursors are on the same (approach/ retract) trace by using the keyboard arrow keys to<br />
assure they both move in the same direction. If they move away from (or towards each) other, they are not on<br />
the same trace.<br />
Go to ‘Set Sens’ pull-down menu in Cal Sub-Tab in the Force tab (Figure 9.2B, inset)- select ‘Virtual Defl<br />
Line’.<br />
The portion of the curve between the Igor cursors gets fit, represented with black line (Figure 9.2C); Also<br />
notice the virtual deflection value has been updated in the calibration sub tab.
Ryan’s MFP-3D Procedural Operation ‘Manualette’ Version 10 (v080501; Igor 6.04A); 9.5<br />
To remove this line fit, place the mouse cursor () on the black fit line, right click; choose ‘Remove<br />
fit_DeflVotls’ (Figure 9.2D). Removal of this curve allows you to perform another force curve for the next step;<br />
if you don’t remove the fit, then the updated virtual deflection parameter will have the next curve off scale<br />
and you won’t see the new curve in the plot window.<br />
Alternatively, just close the Force graph window- a new one will open open then next curve acquistion and<br />
will be properly rescaled.<br />
▪ The virtual deflection has now been corrected so the free air now looks ‘level’ in subsequent force curves<br />
(i.e., has constant deflection), relative to the signal to noise ratio of the curve.<br />
ALTERNATIVELY, you can calibrate the virtual deflection with the tip far off the surface such that the full<br />
range of the piezo is taken into account.<br />
See images on thumbdrive that do this.<br />
If you are using a entended Z range head (older- 28 μm or current- 40 μm), this part of the curve may<br />
not appear linear; in this case you should select ‘Virtual Defl Poly’ instead to account for the curvature<br />
of the approach curve. An example of this can be seen in Figure 9.11 at end of chapter.<br />
A<br />
B<br />
Figure 9.3: trying to eliminate charge by removing any glass components in sample mounting. Here, the sample<br />
(graphite) is fixed to sample puck via silver paint, and placed on an AR magnetic sample holder.<br />
SURFACE CHARGE CAN ALSO AFFECT YOUR FORCE CURVE AQUISTION-<br />
Occasionally, the flat substrate chosen can be subject to surface charges, causing some crazy<br />
non-linear deflections in the free air and near point of contact when using very low spring<br />
constant cantilevers. The author has found this to be true of 0.03 N/m and below levers using<br />
clean glass, or mica glued to a glass slide. For example, glass is notorious for having a surface<br />
charge, and mica’s negative charge can cause a thicker than normal inherent water layer to accumulate.<br />
Figure 9.3 shows an example of surface charging affecting the force distance curve: notice the non -linearity in<br />
the approach and retract parts of the curve- this is caused by the long range forces of the surface charge<br />
pulling the tip towards the surface- makes it tough to get a proper virtual deflection curve fit. To solve this, it’s<br />
a good idea to have a atomically flat material that doesn’t possess strong surface charge- Figure 9.3B shows a<br />
piece of graphite adhered to a magnetic sample puck on an AR magnetic puck holder. Sometimes you can’t<br />
escape the surface charge though…
Ryan’s MFP-3D Procedural Operation ‘Manualette’ Version 10 (v080501; Igor 6.04A); 9.6<br />
STEP 2:<br />
Determine the cantilever InvOLS:<br />
▪ The objective of the second step is to measure the slope of the contact region (called the ‘inverse optical<br />
lever sensitivity’; or InvOLS), a parameter necessary for the algorithm to determine the spring constant. Figure<br />
9.4 gives a sense of what the optical lever sensitivity is, given in units of V/nm; the software inverts it for the<br />
algorithm. Notice this is a similar curve as in Figure 8.3.<br />
Figure 9.4: qualitative description of calculating the Optical<br />
Lever Sensitivity<br />
Click the ‘Single Force’ button again. This time the force distance will be equal in both approach and retract<br />
cycle because the instrument now knows where the surface is. Alternatively, you can do this step on the<br />
contact region of the initial curve (Figure 9.2) by expanding on the contact regime area after correcting the<br />
virtual deflection.<br />
▪ You should have a force curve that looks similar to the one in Figure 9.5A. Notice the free air part of this<br />
curve has constant deflection value. It’s time to determine the InvOLS (inverse optical lever sensitivity) of the<br />
cantilever from the slope of the contact (repulsive) region of the force-distance curve.<br />
Expand on the contact region of the curve (Figure 9.5B).<br />
Place the Igor cursors on the either extension or retract part of the contact regime; use arrow keys to<br />
confirm cursors are on same curve (Figure 9.5B)- they will move in the same direction if they are. If not, correct<br />
this.<br />
Deactivate one of the cursors on the curve by going into the lower margin of that Igor window and<br />
clicking on the open circle/square. When it’s deactivated, it will turn black allowing you to finely<br />
position the other cursors on the curve. When done, reactivate and check that both cursors are on<br />
same trace.<br />
De-activated Igor cursor<br />
▪ In the Force tab, click on ‘InvOLS’ in the ‘Set Sens’ pull-down menu (Figure 9.6C). This ‘InvOLS’ refers to the<br />
Deflection inverse optical lever sensitivity (i.e, DC) value, and used to be called just ‘Deflection’. The slope<br />
calculation will automatically be updated in the Force tab, and connects the two cursors (⊗,⌧) in the<br />
Deflection vs. LVDT plot with a thick black fit line.<br />
It’s a good idea to record this InvOLS in your notebook. (Amp InvOLS is Defl InvOLS times the Kappa factor).
Ryan’s MFP-3D Procedural Operation ‘Manualette’ Version 10 (v080501; Igor 6.04A); 9.7<br />
A<br />
B<br />
C<br />
Figure 9.5: Determining the cantilever’s InvOLS : A) Force curve on a hard surface; B) expand on contact region,<br />
place Igor cursors on retract curve; C) select ‘Deflection’ from SetSens pull down menu in Calibration sub-tab in<br />
the Force tab.<br />
▪ Amplitude should be selected if doing force distance curve in AC mode (also known as dynamic force<br />
spectroscopy).<br />
Disengage the tip by clicking the ‘<strong>St</strong>op!!!’ button on the bottom of the ‘Main’ tab of the master panel, OR by<br />
clicking the ‘<strong>St</strong>op’ button to the right of the deflection meter on the Sum and Deflection Meter window, OR<br />
by clicking the ‘Withdraw’ button in the Force tab. All do the same thing: the S&D meter should show a piezo<br />
voltage of 0.0 V in its ‘withdrawn’ position.
Ryan’s MFP-3D Procedural Operation ‘Manualette’ Version 10 (v080501; Igor 6.04A); 9.8<br />
‘Averaging’ InvOLS: For more precise measurements of the InvOLS (because they can be slightly different<br />
from curve to curve), statistical representation can easily be performed using the MFP-3D.<br />
In the Force Tab of the Master Panel, click the ‘Set Up’ button towards the bottom of the panel-<br />
Check the ‘Limit Cont. to:’ Show? checkbox; this will allow a user defined number of force curves to be<br />
sequentially acquired at the same XY location, without clicking the ‘Single Force’ button repeatedly.<br />
Click the ‘Looks Good’ button to clean up the panel.<br />
Enter a value for how many force curves to be acquired in one spot. For the example shown in Figure 9.7,<br />
the author chose 100.<br />
Click the ‘Continuous’ button to acquire the force curves.<br />
Once the curves have been collected- (also described in Chapter 11).<br />
In the Master Force Panel, load the curves that you want to average the DC InvOLS on. Take note of the<br />
suffices of these curves because they will have to be designated in the Analysis tab (Figure 9.6B).<br />
Confirm that only the ‘Ext’ checkbox is activated, indicating that you only want to look at the extension<br />
part of the force curve.<br />
Plot the Force cursors as LVDT (closed loop Z sensor in the X axis) versus Deflection Volts (y axis)- typically<br />
that is what is done to calibrate the spring constant since the force constant of the cantilever isn’t known<br />
(Figure 9.6A).<br />
A<br />
B<br />
Figure 9.6: Averaging InvOLS to display as histogram distribution: A) determine Deflection range on extension part of<br />
one of the curves to be averaged; B) enter these range values into the deflection range and Offset setvars in the Analysis<br />
tab of the Master Force Panel. Set up Analysis tab similar to above for averaging InvOLS.
Ryan’s MFP-3D Procedural Operation ‘Manualette’ Version 10 (v080501; Igor 6.04A); 9.9<br />
Install the Igor Crtl + i curves on the contact regime part of the curve. Take note of the Y axis values- these<br />
will also be used in the Analysis tab to designate the ‘Deflection Range’ during the averaging (Figure 9.6A).<br />
Go to the Analysis tab of the Master Force Channel.<br />
Under the ‘Calculate’ pull-down, select DC InvOLS (i.e., InvOLS in contact mode, select AC InvOLS if you are<br />
doing Dynamic Force Spectroscopy).<br />
Under the ‘X Parm’ pull-down, select ‘InvOLS’ (InvOLS is what you want the Histogram to have on its X axis).<br />
Enter the appropriate suffix range in the ‘<strong>St</strong>art’ and ‘<strong>St</strong>op’ Indices.<br />
Under the ‘Deflection Range’ setvar, enter the value of the Igor cursor closer to the trigger point (Figure<br />
9.6A).<br />
Under the ‘Deflection Offest’ setvar, enter the value of the other Igor cursor (Figure 9.6A).<br />
Check the ‘Histogram’ Check box-<br />
Click the ‘Do It’ button- a histogram should be generated that will show a distribution of InvOLS values<br />
(Figure 9.7).<br />
• In Figure 9.7, a Gaussian fit was applied, although other fit types are available in the ‘Fit Type’ pull-down.<br />
Notice the Mean and Width of the histogram fit is display, and that the Bin size can be changed using the<br />
slider bar.<br />
Figure 9.7:Histogram of InvOLS values. The fit type pull down allows<br />
different fitting functions to be applied- for an example, a Gaussian fit<br />
was applied (not that the histogram looks Gaussian).
Ryan’s MFP-3D Procedural Operation ‘Manualette’ Version 10 (v080501; Igor 6.04A); 9.10<br />
STEP 3:<br />
Perform a Thermal tune:<br />
Click on the Thermal tab on the Master Panel (Figure 9.8). To be very<br />
precise, retract head back a hundred microns or so (with the thumbwheel) to<br />
eliminate the possibility of the cantilever experiencing any long range<br />
forces.<br />
Adjust the deflection (PD) on the AFM head so it reads ~0V deflection in<br />
the S&D meter, if needed.<br />
Click the ‘Do Thermal’ button at bottom of panel. This detects the natural<br />
resonant frequency of the cantilever by doing an iterative series of<br />
frequency sweeps and averaging them. A real-time amplitude vs. frequency<br />
(called a power spectrum) plot is generated (similar to Figure 9.9A). Let it<br />
collect many cycles (the more you collect, the more it filters out noise).<br />
▪ How fast the Thermal tune proceeds is dependent on the resolution value:<br />
3 is very good, but slow; 7 is efficient but produces a noisier plot.<br />
▪ For a thermal power spectrum in fluid, see Figure 9.10A at the end of this<br />
section.<br />
Hit ‘<strong>St</strong>op Thermal’ to cease sampling when plot looks like it has definition Figure 9.8: Thermal Tab.<br />
enough to fit a curve to it. On the power spectrum plot (Figure 9.9A), expand<br />
the first large peak (red dash line). Do this by holding down the mouse button and creating rectangle around<br />
peak, then right or left clicking the mouse button; select ‘Expand’ to give a plot similar to Figure 9.9C.<br />
Hit Ctrl + i to get the Igor cursors (⊗,⌧ at bottom); place one on the peak of the first resonant peak.<br />
(Figure 9.9C).<br />
Type the value from the cursor (X value, which is in Hz) into ‘Zoom Center’ parameter (in kHz) on the thermal<br />
tab (Figure 9.9C). If working in fluid, the peaks are much broader (see Figure 9.10A), and their resonant<br />
frequencies shift to about ½ to the ‘in air’ values.<br />
In Igor, Ctrl + A will get you back to full spectrum in any expanded Igor window / image.<br />
For example, this would get you from Figure 9.9C to 9.9A.<br />
Click on the ‘Show Fit ’ checkbox in the Thermal tab.<br />
Click the ‘Fit Guess’ button (this brings up a blue Gaussian shaped curve very near to the thermal resonant<br />
peak); (Figure 9.9D).<br />
Click on the ‘Show Fit ’ checkbox in the Thermal tab.<br />
Click the ‘Fit Guess’ button (this brings up a blue Gaussian shaped curve very near to the thermal resonant<br />
peak); (Figure 9.9D).
Ryan’s MFP-3D Procedural Operation ‘Manualette’ Version 10 (v080501; Igor 6.04A); 9.11<br />
A B C<br />
D<br />
E<br />
Figure 9.9: The thermal tune: A) Power spectrum after clicking ‘Do Thermal’ button in Thermal Tab ;B) Expanding on<br />
fundamental resonant peak; C) Zoomed peak, bring up Igor cursors, transfer X value (in Hz) to Zoom center parameter in<br />
thermal tab (in kHZ); D) After clicking ‘Fit Guess’ button; E) After clicking ‘Try Fit’ button, completing spring constant<br />
determination.<br />
Click on the ‘Try Fit’ button- a blue curve will fit to this resonant peak (Figure 9.9B). The software<br />
automatically calculates the spring constant and updates the resonant frequency, seen in Thermal and Main<br />
tab. (Figure 9.9E).<br />
▪ At this point the software has determined the cantilever’s spring constant by the equi-partition method. This<br />
is very useful when performing force distance curves, or needing to know how much force the Set Point is<br />
being applied by the tip. This value will be store in any saved data parameter file.
Ryan’s MFP-3D Procedural Operation ‘Manualette’ Version 10 (v080501; Igor 6.04A); 9.12<br />
9.2: Misc. Operations:<br />
A<br />
B<br />
Figure 9.10: Thermal tunes of contact mode cantilevers IN FLUID. A) Typical plot of a 0.03N/m triangle cantilever. B)<br />
One that has fundamental peak dampened (see note below): Program has difficulty fitting to dampened fundamental<br />
peak.<br />
▪ Sometimes when using a floppy cantilever IN FLUID, the author has found that there is a dampening effect<br />
that causes difficulty computing this peak position (see Figure 9.7B below). There are ways around this: 1) take<br />
the frequency spectrum before engaging/ taking force curve; perform a try fit once you have the InvOLS value<br />
(there will be some greater error in k determination with this approach). 2) Disengage the tip and manually<br />
retract of the tip a turn or two of the thumbwheel (20 μm to 40 μm) before taking the frequency spectrum.<br />
This seems to work much better, with a low number of iterations.<br />
As mentioned in <strong>St</strong>ep 1, an MFP-3D equipped with an extended head will have an initial force curve with a<br />
non- linear free air approach. Figure 9.11 below gives an example of this, as seen with a 28 μm extended head.<br />
This is when ‘Virtual Defl Poly’ would be selected for this calibration.
Ryan’s MFP-3D Procedural Operation ‘Manualette’ Version 10 (v080501; Igor 6.04A); 9.13<br />
A<br />
B<br />
Figure 9.11: Virtual Deflection found in extended heads. A) Force distance curve after<br />
first force curve (as described in <strong>St</strong>ep 1); B) after free air portion of approach curve is fit<br />
with polynomial.<br />
9.3: Sader method:<br />
The MFP-3D software also has the option of using the Sader method to determine the spring constant. This<br />
technique uses the dimensions of the cantilever (in meters), the Q and frequency (Hz) to back out a k value<br />
(N/m).<br />
In the command line type: Print kSader(w,l,Q,f)<br />
Where w is the width, l is the length, Q is the q from the<br />
thermal tune and f is the frequency.<br />
Here’s an example-<br />
Print kSader (30e-6, 60e-6, 118.9, 67283)<br />
k=0.338N/m<br />
For more on spring constant determination, the following references may be helpful-<br />
J. E. Sader, J. W. M. Chon, and P. Mulvaney, Rev. Sci. Instrum. 199, 70, 3967<br />
J. P. Cleveland et al., Rev. Sci. Instrum. 1993 64, 403
Ryan’s MFP-3D Procedural Operation ‘Manualette’ Version 10 (v080501; Igor 6.04A); 9.14<br />
9.4: Spring Constant Tutor-<br />
As mentioned on page 9.1, the Spring Constant Tutor allows all k<br />
determination steps to be performed in a single software panel.<br />
Go to Programming <strong>St</strong>art User Panel SpringConstantTutor;<br />
• This panel is set up where the progression of determining the spring<br />
constant goes from top to bottom. This is an example of building a<br />
User Panel (for more on this, see Section 14.14).<br />
(Although not described above) Virtual deflection is intended<br />
(with Spring Constant Tutor) to be determined when the tip doesn’t<br />
engage the surface- the entire range of the piezo is fit.<br />
Engage the tip- notice the active Z Piezo voltage meter.<br />
Determine the InvOLS using a trigger channel and trigger point.<br />
Notice the Deflection voltage is displayed b/c this Force curve<br />
acquisition is done in Contact mode.<br />
Thermal tune: first withdraw the tip, then click ‘Do Thermal’; bring<br />
up Igor cursors to fit the fundamental resonant peak to complete the<br />
spring constant determination.<br />
Figure 9.9: Spring Constant Tutor<br />
window allows all three steps of the<br />
spring constant determination to be<br />
performed in one single panel.
Ryan’s MFP-3D Procedural Operation ‘Manualette’ Version 10 (v080501; Igor 6.04A); 10.1<br />
Lithography and Manipulation software<br />
The MFP-3D closed loop system makes it ideal for accurate and complex scanning probe based lithography,<br />
and nanometer to micron scale tip manipulations. Typically, an area of the substrate is first imaged nondestructively<br />
(in AC mode or gentle contact) to determine what the ‘real estate’ looks like; then mouse strokes<br />
representing the tip’s path(s) can be added to the image using the MicroAngelo software. Images can be<br />
imported and scaled appropriately, set<br />
point voltage (or tip bias) ranges defined for<br />
the execution, and the scripting performed.<br />
These instructions assume that the MFP-<br />
3D is set up with desired tip and substrate,<br />
and is engaged.<br />
Section Topic page<br />
10.1 Introduction to Software Panel 10.1<br />
10.2 Drawing Lines 10.2<br />
10.3 Importing Images as Patterns 10.6<br />
10.4 Creating Array Patterns: The <strong>St</strong>ep Tab 10.8<br />
10.4B Varying Dwell Time 10.9<br />
10.4C Varying Set Point Voltage 10.10<br />
10.5 The Velocity Tab 10.11<br />
10.1: Introduction to Software Panel: <br />
• In the main menu bar of the MFP-3D software, open the lithography panel by choosing MFP controls <br />
Litho Panel. The panel consists of four tabs including MicroAngelo, Groups, <strong>St</strong>ep & Velocity. See Figure 10.1<br />
below.<br />
• The MicroAngelo tab allows the user to draw lines on the image representing<br />
tip paths, determine the set point during the manipulation and the set point<br />
between paths (kind of like a retraction set point); make groups of paths; define<br />
constant velocity during the path; determine mode (contact or AC); apply<br />
constant tip bias (if performing an oxidative or reductive manipulation; other<br />
features of this window will be described later in this procedure text.<br />
• The Groups tab allows the user to import an image, rescale a saved path (or<br />
group of paths) that you have previously drawn, or select between saved groups<br />
in memory. There are slider bars that allow X& Y rescaling preserving the aspect<br />
ratio; offsetting the group in X and/or Y; and group rotation.<br />
• The <strong>St</strong>ep tab allows the user to make arrays of points by defining number of<br />
points, spacing between points, dwell times (& ranges), and tip voltages (&<br />
ranges, if applicable).<br />
• The Velocity tab varies the tip velocity along the path based on the pixel color<br />
on an imported image.<br />
Figure 10.1: MicroAngelo tab<br />
of the Litho Panel.
Ryan’s MFP-3D Procedural Operation ‘Manualette’ Version 10 (v080501; Igor 6.04A); 10.2<br />
The help menus are excellent for the MicroAngelo software. To access them, just<br />
click on the question marks to the right of every parameter or button in the software<br />
panels.<br />
Image the substrate to determine an area suitable for lithography or the manipulation. Depending on your<br />
substrate material or application, it may also be a good idea to have the spring constant determined prior to the<br />
manipulation, so the user is aware of the amount of force applied at a given Set Point voltage.<br />
10.2: Drawing lines:<br />
10.2.1: Basic operation:<br />
MicroAngelo allows the user to draw linear or free hand lines representing tip paths on an image window.<br />
Multiple lines can be grouped together, offset, rotated and rescaled if necessary.<br />
In the MicroAngelo tab, activate the FreeHand or Line radio button depending on what kind of line you<br />
want to draw.<br />
Click on the ‘Draw Path’ button (see Figure 10.1); Notice the button now reads ‘<strong>St</strong>op Draw’, the free hand<br />
and line selections become faint because they can not be switched between each other, and a cross hair cursor<br />
() will be present when the mouse is on one of the image channel windows.<br />
Draw a path on image window with mouse/cursor; if drawing more than one path (with the line tool or free<br />
hand tool), left click mouse button at each segment; double click mouse button when finished drawing line<br />
segment.<br />
• Paths can be grouped together: If you want to save the pattern for future use, Click ‘Make Group’, then ‘Save<br />
Group’, name it in the dialogue that shows up. Notice this name will now appear in the list in the Groups tab.<br />
• If you want to switch between the FreeHand & Line tools, click ‘<strong>St</strong>op Draw’, switch to the other; then click<br />
‘Draw Path’ again.<br />
• Notice the drawn line turns from red to blue once clicking ‘<strong>St</strong>op Draw’.<br />
For scratching based lithography or manipulations, switch the imaging mode to Contact in that Main tab<br />
imaging mode pull down menu of the Master panel, or in the ‘Litho Mode’ pull down in the Litho Panel.<br />
Select a ‘Normal Set Point’ that will not damage the surface while the tip is moving between paths. In contact<br />
mode, a deflection value that is the same as the free air deflection (or more negative than that value) won’t<br />
damage the surface between litho paths.<br />
Determine/ select a ‘Litho Set Point’ value that will apply enough force to perform the desired lithography<br />
result (Scratch, oxidative/reductive, diffusion based direct write, etc.), or have enough force to perform the<br />
manipulation (without riding over what is intended to be pushed).<br />
Click ‘Do It!’ to execute the litho event. Notice this button now reads ‘<strong>St</strong>op Litho’.<br />
• The tip will be withdrawn when completed with the lithography/ manipulation execution.
Ryan’s MFP-3D Procedural Operation ‘Manualette’ Version 10 (v080501; Igor 6.04A); 10.3<br />
• The ‘Show Directions Arrow’ checkbox will show the direction the path will traverse, and will become<br />
apparent on the image. To adjust the number of arrows on the path pattern, double click on the path and a<br />
dialogue comes up allowing you to reduce or increase the number of arrows, similar to how plots are<br />
customized in Igor.<br />
• Figure 10.2 shows a simple set of lines drawn with MicroAngelo: one was by free hand, one by line. The two<br />
paths were grouped by clicking the ‘Make Group’, then ‘Save Group’ buttons- a dialogue came up asking what<br />
the group is to be named. The Free Air deflection (from S&D meter) was -0.57V, so I defined the ‘Normal Set<br />
Point’ as -0.5V, while choosing the Litho Set Point as 0.5 V. The velocity was 600 nm/s.<br />
A<br />
B<br />
12<br />
10<br />
8<br />
µm<br />
6<br />
4<br />
2<br />
0<br />
0<br />
2<br />
4<br />
6<br />
8<br />
10<br />
12<br />
Figure 10.2: A) line and free hand paths drawn & grouped, also showing ‘direction arrows’; B) AC<br />
mode image of resulting pattern on polycarbonate.<br />
Similarly, this same approach can be applied for sample manipulation via the tip.<br />
• If you rescale the image/ scan area to view results, you will probably have to kill the section by clicking ‘Kill All’<br />
button.<br />
10.2.2: Using the Setpoint Wave checkbox in MicroAngelo tab to systematically vary the<br />
Setpoint<br />
• When this is checked, a new dialogue is presented that allows Set Point voltage ranges to be applied along an<br />
individual line/ path, in either a linear or staircase waveform. Note that is not able to distinguish between<br />
objects in a group.<br />
•An example of scratch lithography using the varied Set Point Wave is demonstrated in Figure 10.4.<br />
After imaging the surface in AC mode, the path was drawn by clicking the ‘Draw Path’ button; then ‘<strong>St</strong>op<br />
Draw’ button was clicked (results in Figure 10.3A).
Ryan’s MFP-3D Procedural Operation ‘Manualette’ Version 10 (v080501; Igor 6.04A); 10.4<br />
Check the ‘Set Point Wave’ checkbox , which brings up the window similar to the one shown in Figure<br />
10.3B below. The control parameters at the top of this window allow the user to define a start and ending Set<br />
Point voltage, and whether that ramp is stepped linearly, or as a step function.<br />
• In the example below, the Set Point range was from 0 V to 7 V with a linear ramp wave. The ‘Voltage <strong>St</strong>ep’<br />
setvar value is insignificant when using linear waveform ramps- it only applies when using step wave forms.<br />
A<br />
B<br />
Figure 10.3: A) path drawn on acquired image; B) defining linear ramp after checking the Setpoint Wave box on the<br />
MicroAngelo tab<br />
Click the ‘Do It!’ Button to execute the MicroAngelo event.<br />
•Figure 10.4 shows the results of this ramping Set Point (applied force).<br />
As expected, with increasing Set Point voltage/ force, the tip plows<br />
further into the polycarbonate surface as it traverses the defined path,<br />
seen as a feature increasing in width.<br />
• The path was defined such the tip would experience increasing torsion<br />
as the pattern was traversed, to demonstrate what is described in the<br />
next section.<br />
10.2.3: Save Data checkbox allows the deflection, and lateral signals<br />
during the event to be viewed. See Figure 10.5B for an example of this.<br />
•To view the deflection, lateral and time signals during the manipulation<br />
event, click the ‘Save Data’ checkbox BEFORE the event (before clicking<br />
the ‘Do It!’ Button).<br />
After the event, click the ‘Litho Review’ button, which will bring up a<br />
panel similar to the one seen in Figure 10.5A (below). This panel shows a list of the litho events that were<br />
performed in Igor’s memory.<br />
Choose the event you want to see the saved data for during the event.<br />
Figure 10.4: Results of Setpoint<br />
Wave
Ryan’s MFP-3D Procedural Operation ‘Manualette’ Version 10 (v080501; Igor 6.04A); 10.5<br />
Choose X & Y wave desired from the respective pull down menus.<br />
Click ‘Make Graph’ button to view the data; a plot similar to the one seen in Figure 10.5B is displayed.<br />
• In this case, the lateral data is shown, representing the torsion on the cantilever during the lithographic event<br />
shown in Figure 10.4 (above).<br />
Note that the lateral signal during the manipulation is limited by the bandwidth of the ADC used for<br />
the lateral signal (~100 kHz). The bandwidth on the deflection signal uses the Fast ADC at 2.5 MHz.<br />
A<br />
B<br />
Figure 10.5: A) Plotter Manager Panel for Litho Review; B) example<br />
of lateral signal during tip path in Figure 10.4<br />
Use Snap checkbox & ‘Prescan’ Button- this litho mode is not understood by the author yet. Read the help<br />
menu if you want to use it.
Ryan’s MFP-3D Procedural Operation ‘Manualette’ Version 10 (v080501; Igor 6.04A); 10.6<br />
10.3: Importing Images as Patterns:<br />
Importing an image to use as a group in MicroAngelo<br />
is a very straightforward task. Many<br />
image files (tiffs, jpeg, Bitmap, etc.), as well as GDS (graphics design system) CAD drawing files can be imported.<br />
Open the Groups tab (Figure 10.6)<br />
Click on the ‘Load Image’ button; a browse dialogue comes up<br />
letting you select the stored file<br />
• The image loads and Igor immediately makes a ‘Contour’ of the<br />
image. Figure 10.7 shows the results of loading the AR logo.<br />
Figure 10.6: Groups tab.<br />
• The contour image defines the edges of the imported<br />
image as the path the tip will traverse during the<br />
manipulation. Notice at the top of the Contour<br />
window, there are some parameters you can adjust:<br />
‘Total contour’ has something to do with edge effectsits<br />
kinds of like a threshold in the mask function in the Figure 10.7: Contour & Picture windows.<br />
modify panel; ‘Which contour’ chooses which contours<br />
will be included in the group ultimately used as the path; the Color is a pull down menu that will color the<br />
different contours. These parameters are discussed further towards the end of this section. For now, this simple<br />
image will be contour value ‘1’. Contour effects are more pronounced in imported images that are grayscale or<br />
have color. It’s best to try it on your own…<br />
Click the ‘Save Group’ button to add this group to the list. I happened to call this group ‘ARlogo’, as seen in<br />
Figure 10.6.<br />
Highlight the group of your choice (in this case, the AR logo).
Ryan’s MFP-3D Procedural Operation ‘Manualette’ Version 10 (v080501; Igor 6.04A); 10.7<br />
Click the ‘Display Group’ button- this will display the group (colored red) in the image window (see Figure<br />
10.8 A).<br />
Position the group where you want it in the image area using the X & Y offset slider controls, along with<br />
rotation and size slider controls.<br />
CIick the ‘Add Group’ button, which will make the group pattern blue in the image window (Figure 10.8 B).<br />
A<br />
B<br />
Figure 10.8: A) group displayed, positioned to users preference; B) group after Add Group<br />
button activated<br />
Go back to the MicroAngelo tab.<br />
Define the ‘Normal’ & ‘Litho Setpoint’ voltages, and tip velocity. Choose a ‘Normal Set Point’ voltage value<br />
that doesn’t damage the surface between paths; Choose a ‘Litho set point’ value that will induce enough force<br />
to scratch the surface; Choose a tip velocity that will be at a rate sufficient enough to do what is intended.<br />
If the manipulation requires an oxidative or reductive potential, click the ‘Litho Bias’ checkbox, and<br />
define an appropriate bias to the tip.<br />
Make sure ‘Contact’ is selected from the pull-down menu (if that is the desired mode); Incidentally, if you<br />
change the imaging mode in the Main tab of the Master panel, it will also be updated here as well.<br />
the ‘Show Directions Arrow’ checkbox will show the direction the path will traverse, and will become<br />
apparent on the image. To adjust the number of arrows on the path pattern, double click on the path and a<br />
dialogue comes up allowing you to reduce or increase the number of arrows, similar to how plots are<br />
customized in Igor.<br />
When all parameters are defined, click the ‘Do It!’ Button;
Ryan’s MFP-3D Procedural Operation ‘Manualette’ Version 10 (v080501; Igor 6.04A); 10.8<br />
• During the manipulation, A red dot that represents the location of the tip, based on the values from the X,Y<br />
LVDTs is shown on the screen. You’ll also notice the ‘Draw Path’ button now shows what section of the group<br />
path is traversing. If you click this button during the litho procedure, it won’t do anything.<br />
• At the end of the patterning, the tip will be<br />
withdrawn.<br />
• In the pattern example shown in Figure 10.8<br />
above, an AC 160 Si cantilever was used to<br />
scratch a polycarbonate surface. The resulting<br />
scratch can be seen in Figure 10.9 (right):<br />
10.4: Creating Array Patterns:<br />
The <strong>St</strong>ep Tab. <br />
Figure 10.9: AC mode image of resulting patterned from an<br />
imported image scratched into a polycarbonate image<br />
• Arrays can be created using the <strong>St</strong>eps tab (see Figure 10.10 below); this<br />
tab can have the tip dwell at each subsequent array point for a user defined<br />
time, or apply a different force. Both functions can be systematically<br />
increased, or custom values can be manually entered.<br />
Creating simple arrays-<br />
Choose number of points desired in the array with ‘X Count’ and ‘Y Count’<br />
setvar inputs.<br />
Choose the distance desired between points in the array, in both X & Y<br />
dimensions using ‘X <strong>St</strong>ep’ & ‘Y <strong>St</strong>ep’ setvar inputs.<br />
The ‘Time <strong>St</strong>art’ setvar value is the amount of time the tip will be in contact<br />
with the surface (dwell) at each point in the array. If it is desired to have the<br />
tip have the same dwell at each point, enter 0 s in the ‘Time <strong>St</strong>ep’ value<br />
input.<br />
Click ‘Do It’ button to fabricate the array pattern. Notice the S&D meter<br />
deflection values reaching the defined Set Point during the indents.<br />
• Point 1 in the array start with the lower left, move to the right, then moves<br />
to left array in next row.<br />
Figure 10.10: <strong>St</strong>ep tab
Ryan’s MFP-3D Procedural Operation ‘Manualette’ Version 10 (v080501; Igor 6.04A); 10.9<br />
The array will be centered in image window; the XY offsets in the group tab doesn’t move the array to a<br />
user defined area in the image (like it does when using a pattern).<br />
• In the example shown in Figure 10.11, a 3 x 5 array was created using the parameter values shown in Figure<br />
10.10. Large forces were applied using a rather dull tip, resulting in the poor quality image below.<br />
A<br />
B<br />
Figure 10.11: A) array pattern created using the steps tab; B) resulting indent pattern array on<br />
polycarbonate.<br />
10.4B: Varying tip dwell time at each array point:<br />
• The amount of time the tip stays in contact with the surface at each array point can be independently or<br />
systematically varied using the <strong>St</strong>eps tab.<br />
To systematically vary the dwell time at each subsequent point in the array-<br />
Define a ‘<strong>St</strong>art Time’ value which represents the amount of time the tip dwells at point 1.<br />
Define a ‘Time <strong>St</strong>ep’ value: this is the amount of additional time spent at each subsequent point. For example,<br />
if you want the tip to spend 3s longer at each subsequent point, enter 3s in ‘Time <strong>St</strong>ep’; (<strong>St</strong>art Time being 1s).<br />
Point 1 (lower left of the array) would spend 1s; point two would spend 4s; point three, 7s, etc. Make sure to<br />
click the ‘Update Time’ button to ensure this change takes effect.<br />
• The individual time values at each point can be viewed in spreadsheet form by clicking the Edit Time button.<br />
To independently vary the dwell time at each subsequent point in the array-<br />
• Alternatively, maybe a more custom variation is required- in this case, click the ‘Edit Time’ button. This will<br />
bring up a spreadsheet that allows the user to manually change the time at each respective point.
Ryan’s MFP-3D Procedural Operation ‘Manualette’ Version 10 (v080501; Igor 6.04A); 10.10<br />
10.4C: Varying Tip Set Point Voltage at each array point:<br />
The amount of applied force the tip imparts to the surface the surface at each array point can be independently<br />
or systematically varied using the <strong>St</strong>eps tab. This can be helpful when doing a series of indents at different<br />
applied forces in an array.<br />
Check the checkbox above the ‘Volt <strong>St</strong>art’ setvar input (this is actually called ‘Use<br />
Voltage Wave); this will disregard the ‘Litho Setpoint’ input value in the<br />
MicroAngelo tab.<br />
To systematically vary the applied force at each subsequent point in the array-<br />
Define a starting Set Point voltage using ‘Volt <strong>St</strong>art’ setvar input.<br />
Define an end Set Point voltage using ‘Volt End’ setvar input.<br />
Click ‘Update Volts’ button to activate this change.<br />
• The individual Set Point setvar values at each point can be viewed in spreadsheet form by clicking the ‘Edit<br />
Volts’ button.<br />
Click the ‘Do It’ button; the deflection at each array point can be monitored in the S&D meter.<br />
A<br />
B<br />
C<br />
Figure 10.12: A) parameters used to make a 2 x 4 array with constant dwell at each point,<br />
while varying: B) the applied force from 0 V to 4V; C) varying the Setpoint (applied force)<br />
from 4V to 0V. Recall point 1 begins in the lower left of the array.
Ryan’s MFP-3D Procedural Operation ‘Manualette’ Version 10 (v080501; Igor 6.04A); 10.11<br />
• In the example above, two 2 x 4 arrays were produced by varying the Set Point voltage from 0 V to 4 V (Figure<br />
10.12B); and varied the Setpoint from 4 V to 0V (Figure 10.12C). In both examples, the tip dwell time was<br />
constant at each point (Tine <strong>St</strong>art = 1s; Time <strong>St</strong>ep = 0s).<br />
To independently vary the applied force at each subsequent point in the array-<br />
• Alternatively, maybe a more custom Set Point variation is required- in this case, click the ‘Edit Volts’ button.<br />
This will bring up a spreadsheet that you can go into and manually change the Set Point at each respective<br />
point.<br />
Although the author hasn’t tried this yet, when the ‘Litho Bias’ check box is check in the<br />
MicroAngelo tab, perhaps using <strong>St</strong>art and End Volts value inputs allow arrays to be produced with<br />
oxidative or reductive tip potentials.<br />
10.5: The Velocity Tab<br />
Using the Velocity tab- It is best to read the help menu on what this is for. Although I haven’t tried to do this yet,<br />
I am under the impression that it is used to draw images that have shading in them relative to a particular force<br />
or bias that is scaled to the grayscale pixel colors. I don’t think this feature has been working, but could be<br />
wrong.<br />
An image is loaded, the colors are converted to gray scale- dark grays are patterned using the ‘Min velocity’<br />
while the bright grays are patterned at the ‘Max Velocity’. All grays in between are patterned at a velocity<br />
determined by the grayscale value and the velocity range entered into the value inputs.<br />
I suspect this feature is good for diffusion dependent direct write scanning probe lithography techniques,<br />
among others.
Ryan’s MFP-3D Procedural Operation ‘Manualette’ Version 10 (v080501; Igor 6.04A); 11.1<br />
This Chapter is not yet complete<br />
Section Topic page<br />
11.1 Introduction to Force Spectroscopy 11.2<br />
11.2 Force Panel & Acquisition 11.3<br />
11.2.1 Force tab 11.3<br />
11.2.2 Misc. subtab 11.6<br />
11.2.3 Calibration subtab 11.8<br />
11.2.4 Go There subtab 11.9<br />
11.2.5 Save tab 11.11<br />
11.2.6 Force Triggering 11.11<br />
11.2.7 Force Display Channel 11.12<br />
11.2.8 Closed Loop Activation 11.15<br />
11.2.9 Empirical Considerations 11.15<br />
11.3 Force Mapping Acquisition 11.16<br />
11.4 Other Acquisition Techniques 11.20<br />
11.4.1 ‘Fishing’ 11.20<br />
11.4.2 Force Clamping 11.21<br />
11.4.3 AR Function Editor 11.XX<br />
11.4.4 Colloidal Probe Microscopy 11.22<br />
11.4.5 Cantilever based indentation 11.22<br />
11.4.6 Dynamic Force Spectroscopy 11.23<br />
11.4.7 Force Maveric 11.2X<br />
11.5 Force Curve Analysis 11.24<br />
11.5.1 Loading data 11.24<br />
11.5.2 The Force Display Panel 11.23<br />
11.5.2A Display subtab 11.24<br />
11.5.2B Pref. subtab 11.27<br />
11.5.2C Parm. subtab 11.27<br />
11.5.2D Cursor subtab 11.28<br />
11.5.2E Modify subtab 11.30<br />
11.5.2F Worm Like Chain (WLC) subtab 11.32<br />
11.5.2G Analyze subtab 11.35<br />
11.5.2H Spot subtab 11.39<br />
11.5.2I Elastic subtab 11.42<br />
11.6 Misc. Items 11.44<br />
11.6.1 Chemical Cross linking 11.44
Ryan’s MFP-3D Procedural Operation ‘Manualette’ Version 10 (v080501; Igor 6.04A); 11.2<br />
11.1: Introduction to the Force Spectroscopy<br />
In brief, Force spectroscopy measures the deflection displacement of the cantilever (with known spring<br />
constant) in the Z direction (generally) such that it measures an adhesion dissociation event between the tip<br />
and substrate, OR the compliance of a material under the ‘tip’ as it pushes into it. It usually begins with the tip<br />
approaching the surface with some ‘free air’ value, reaching a user defined cantilever deflection (force) and<br />
reversing direction for the retract cycle (although there are some exceptions).<br />
There are two major classifications that most force spectroscopy experiments measure:<br />
A pulling event in which the tip interacts with the surface, and some adhesion dissociation event between<br />
the tip and surface is measured on the retract cycle (Figure 11.1.1A).<br />
The tip pushes into the (material on the) surface to measure compliance (Figure 11.1.1B).<br />
A<br />
B<br />
Figure 11.1.1: Two classifications of force spectroscopy measurements: A) Pulling can yield adhesion forces; B) Pushing<br />
can yield compliance forces.<br />
Historically, the MFP-3D head was designed specifically to measure forces more accurately that traditional<br />
tube based scanner systems: specifically, the entire optical detection assembly moves together, so there is no<br />
change in the optical path length or movement in the SLD reflective spot on the back of the cantilever,<br />
allowing the optical lever sensitivity (InvOLS) to remain constant no matter what X,Y or Z movement of the<br />
piezo actuators occur. There are other more subtle contributors to the accuracy of the measurement relative<br />
to other commercial scopes, but this document isn’t a sales pitch.<br />
This chapter was designed to help describe, and in some cases reveal, the mind numbing force spectroscopy<br />
of the MFP-3D software and some empirical considerations. It was also the most challenging chapter for the<br />
author due to this versatility.<br />
Cantilever selection is very important in force spectroscopy: if too stiff, then small forces may not be<br />
recognized; if too floppy, perhaps not enough force can be applied during compliance measurements, or get<br />
stuck to the surface via adhesion or surface charges. Other considerations are the cantilever material<br />
regarding how well it will work in air/ fluid, or the ability to do chemical cross-linking to it.<br />
There are some excellent force spectroscopy review papers in the literature; although the author is likely<br />
missing many, a list of some useful ones are:<br />
•Butt, H.-J., Cappella, B., Kappl, M., ‘Force measurements with the atomic force microscope:
Ryan’s MFP-3D Procedural Operation ‘Manualette’ Version 10 (v080501; Igor 6.04A); 11.3<br />
Technique, interpretation and applications’, Surface Science Reports, 2005 59 1-152<br />
•Cappella, B., Dieter, G., ‘Force-Distance Curves by AFM’, Surface Science Reports, 1999 34 1-104<br />
•Heinz, W., Hoh, J. H., Journal of Chemical Education, 2005 82(5) 695-703.<br />
•Heinz, W., Hoh, J. H., Nanotechnology, 1999 17 143-150.<br />
•Dupres, V., Verbelen, C., Dufrêne, Y. F., ‘Probing molecular recognition sites on biosurfaces using AFM’,<br />
Biomaterials 2007 28 2393–2402.<br />
•Reif, M., Grubmüller, H., ‘Force Spectroscopy of Single Biomolecules’, ChemPhysChem 2002 3 255-261<br />
Some of the big players in the field include (but not limited to): Hermann Gaub, Gilbert Walker (Utoronto, Pitt),<br />
<strong>St</strong>ephanie Allen, Evan Evans (BC), Peter Hinterdorfer (Linz); Krystyn Van Vliet (MIT); Boris Akremitchev (Duke),<br />
Julio Fernandez (Columbia); Jarvis (Dublin); Hoh (JHU); Discher (UPenn).<br />
11.2: The Force Panel and Force Curve Acquisition:<br />
11.2.1: The Force tab of the Master Panel:<br />
The Force tab of the Master Panel is where most the basic force spectroscopy software control occurs- the<br />
subtabs in the center of the panel will be described below.<br />
<br />
<br />
<br />
<br />
<br />
The white bar along the left of the panel- this represents the<br />
entire travel distance of the Z piezo; the top of the white bar<br />
represents the piezo as fully retracted; the bottom represents<br />
the piezo fully extended.<br />
The red bar within it represents the ‘<strong>St</strong>art Distance’ and ‘Force<br />
Distance’, relative to the entire travel of the Z piezo (see below).<br />
• The Z piezo operates in OPEN LOOP by default. See Section<br />
11.2.8 to activate closed loop for constant velocity pulls.<br />
<br />
<br />
8<br />
<br />
7<br />
Figure 11.2.1.1: Force tab of the Master<br />
Panel.<br />
<strong>St</strong>art Distance- this setvar is the point at which the piezo<br />
begins its Z/ force distance cycle (i.e., the starting voltage<br />
applied to the piezo is another way to think about it). The red<br />
bar’s upper position in the white slider bar qualitatively depicts<br />
this position. The red bar can be moved with the mouse cursor<br />
two different ways:<br />
Place cursor somewhere in<br />
red region; left mouse click<br />
until hand icon appears, drag<br />
red bar throughout the Z<br />
piezo range (white slider<br />
bar);<br />
Left click mouse in the<br />
white area to roughly scroll<br />
the red cursor up or down.<br />
A<br />
B<br />
Figure 11.2.1.2: Moving ‘<strong>St</strong>art<br />
Distance’ with mouse: A) left click<br />
mouse in red bar until hand icon<br />
appears; B) drag cursor to move<br />
red bar.
Ryan’s MFP-3D Procedural Operation ‘Manualette’ Version 10 (v080501; Igor 6.04A); 11.4<br />
• the Hamster wheel (on front of MFP controller) can also execute this movement in real time when the setvar<br />
radio button is activated.<br />
Force Distance- this setvar is how long the force-distance cycle will be. Notice that as this setvar value is<br />
changed, the length of the red bar changes (i.e., the length of the red bar qualitatively depicts the force<br />
distance relative to the entire length of the Z piezo’s distance (white slider bar)). The length and position of<br />
the red bar can be manipulated with the mouse by holding the left button down over it, then moving it.<br />
A<br />
B<br />
Figure 11.2.1.3: Changing ‘Force Distance’ with mouse cursor: A)<br />
place cursor at edge of red bar; hold left mouse button down until<br />
double arrow appears; B) drag cursor to desired force distance value<br />
(see setvar).<br />
Scan Rate/ Velocity- changing the velocity, or scan rate, affects the<br />
other. Split / Synch Approach/ Retract velocities can be made different in<br />
‘Split’ mode; for experiments that require constant velocities, turn on<br />
the closed loop in the Z axis (i.e. LVDT; see Section 11.2.8).<br />
See Section 11.2.9 to select velocities that are not subject to hydrodynamic effects.<br />
Forward/ Reverse pulls (Red mode/ Blue modes)- these radio labels change whether the tip starts above<br />
the surface (free air), approaches the surface then pulls back to free air (Red mode); or starts at the surface,<br />
retracts to free air, then returns to the surface at the end of the force-distance cycle (Blue mode). Notice the<br />
color of the force distance bar changes to the appropriate color.<br />
Forward pull (Red Mode): tip starts cycle in free air and approaches surface; then<br />
retracts; this is the default mode upon start up. This is the most commonly used mode<br />
for force spectroscopy experiments.<br />
Reverse pull (Blue mode) tip starts cycle at surface and travels to free air, then returns<br />
to surface; This mode is good for ‘Fishing’ , possibly Force Clamp (see Section 11.4.1).<br />
forward<br />
reverse
Ryan’s MFP-3D Procedural Operation ‘Manualette’ Version 10 (v080501; Igor 6.04A); 11.5<br />
Trigger Channel- this pull down menu allows the user to define what<br />
units to measure before ‘triggering’- essentially a user defined Force that the<br />
tip applies before switching direction (Figure 11.2.1.4).<br />
• None- no trigger- piezo will go through its force distance cycle regardless<br />
of either not making contact with surface (Figure 11.2.7.3), or grinding it<br />
into the surface.<br />
• Deflection- will monitor the deflection (nm) on the PSD- best used if the<br />
spring constant has been calibrated (See Chapter 9).<br />
• Separation- This is Deflection subtracted from the LVDT signal; puts<br />
contact regime on left side; makes the contact regime have a slope of<br />
infinity if the cantilever is pushing against an infinitely hard surface.<br />
• Indentation- This is Deflection subtracted from the LVDT signal; puts<br />
contact regime on right side; puts increasing indentation depth to right of start. (Force on Y axis)<br />
• Force- will monitor Force applied- only relevant if the spring constant has been determined (See Chapter<br />
9).<br />
• RawLVDT- monitors the distance on the Z axis Closed loop sensor<br />
• DeflVolts- Monitors the amount of volts on the PSD- best used as trigger if the InvOLS has not been<br />
calibrated.<br />
8 Relative/ Absolute Trigger- this triggering choice with applies the user defined trigger value (relative); or<br />
takes the user defined trigger plus what ever the free air deflection is converted to the trigger channel<br />
dimension/ unit (absolute). For examples of triggering, see Section 11.2.<br />
Slope- this has to do with whether the force curve trigger is for a contact mode or AC mode (Dynamic) force<br />
curve. Most force curves are acquired in contact mode, and would require a positive slope. However, in<br />
Dynamic Force spectroscopy, the AC mode curves of many’s interest are plotted as amplitude, or phase vs.<br />
distance, often requiring a ‘Negative’ slope. See Section 11.4.5 for more on Dynamic force spectroscopy.<br />
Trigger Point- this setvar defines trigger point values. The ‘Trigger point’ is a user defined value detected<br />
on the PSD that tells the piezo to switch directions even if the force (deflection) curve hasn’t achieved the<br />
completed Force distance (deflection) value.<br />
See section 11.2.8 for a more complete description on trigger points<br />
BUTTONS-<br />
‘Withdraw’- withdraws the tip; puts Z piezo voltage at 0V (i.e., almost fully retracted).<br />
‘S&D channels’- brings up the ‘Force Channel Panel’; see Section 11.2.6 / Figure 11.2.6.1.<br />
‘Single Force’- activates a single force cycle (Crtl+3 also does this).<br />
‘Continuous’- initiates force cycles to be continuously executed;<br />
• The amount of continuous curves can be limited by clicking the to ‘Setup’ button.<br />
Activate the ‘Limit Contin. To’ checkbox. <strong>St</strong>ands for limit to continuous.<br />
Click the ‘Looks Good’ button.<br />
Enter the amount of curves needed to collect continuously in the Limit to Cont setvar.<br />
Do some force spectroscopy.<br />
Figure 11.2.1.4: Selecting a<br />
trigger channel.<br />
‘Save Curve’- if the curve looks like it’s something you want saved after the fact, and you don’t have all curves<br />
being saved in the Save subtab, click this button
Ryan’s MFP-3D Procedural Operation ‘Manualette’ Version 10 (v080501; Igor 6.04A); 11.6<br />
‘Review’- loads force curves for review/ analysis by bringing up the Force Display panel (see Section 11.5.1).<br />
There are four subtabs in the Force tab of the Master Panel to preserve some panel real estate in the software,<br />
described in sections 11.2.2- 11.2.5-<br />
11.2.2: The Misc. subtab-<br />
This sub-tab controls two things-<br />
The MFP-3D software allows the user to define a period of<br />
‘Dwell’ where the tip stops moving (or maintains some load) in<br />
the middle or end of a scan whilst continuing to collect data at<br />
some rate. This feature is great for data acquisition where perhaps<br />
a chemical reaction timescale needs to be expanded to<br />
accommodate some receptor-ligand event, or to assess some<br />
creep /compression event while applying/ maintaining a load to<br />
the sample with the ‘tip’.<br />
• For now there is no feedback on during the dwell for nontriggered<br />
force curves. For triggered force curves there is either a<br />
Z LVDT -> Z Piezo feedback loop running, or a Defl -> Z Piezo<br />
feedback loop running during a dwell.<br />
A<br />
B<br />
<br />
<br />
<br />
<br />
<br />
7<br />
Figure 11.2.2.1 Misc. tab allows user to<br />
define temporal and low pass filter settings<br />
for Dwell and force curve collection.<br />
Dwell Pull-down menu- activate Dwell function here. (Figure 11.2.2.1B).<br />
Dwell Time- this defines the length of Dwell. Click the ‘Use’ checkbox to<br />
increase Dwell rates- maximum dwell time is 500s (8.3 minutes).<br />
Dwell Rate- This is the rate at which data is collected<br />
during a dwell- i.e., maybe the experiment calls for more or<br />
less points to be collected during this time. It must be<br />
activated with the Use checkbox to the left of the setvar.<br />
Dwell Filter- this is a low pass filter that can clip from 1<br />
Hz to 1kHz; often not a default parameter- must be activated<br />
in the setup menu of the panel.<br />
Dwell period<br />
• An example of a force distance curve (plotted as deflection<br />
vs. time) with a multi second dwell setting is seen in Figure<br />
11.2.2.2.<br />
The band width (BW) options for the curve collection.<br />
Note, to view the BW options (in most version of MFP-3D<br />
software), they must be activated to be shown using the<br />
‘Setup’ button.<br />
Figure 11.2.2.2: Example of a force distance<br />
curve (plotted as cantilever deflection vs. time,<br />
with a multi second Dwell towards surface.
Ryan’s MFP-3D Procedural Operation ‘Manualette’ Version 10 (v080501; Igor 6.04A); 11.7<br />
Sample Rate-this is essentially how many points per second that is collected during the force curve<br />
acquisition (Figure 11.2.2.3A).<br />
Low Pass Filter- this effectively changes the low pass filter on the signal so you can adjust the amount of<br />
signal noise; the lower the frequency, the more data that gets clipped. Use this filter with caution- if small<br />
forces must be measured, too small of a filter setting (i.e., < 1kHz) could clip the event of interest. (Figure<br />
11.2.2.3A).<br />
-1.35<br />
A<br />
-1.40<br />
bl0012BW=500Hz<br />
bl0014BW=1kHz<br />
bl0020BW=20kHz<br />
bl0027BW=50kHz<br />
B<br />
0.5<br />
bl0038BW=200Hz; 10k Pt/s<br />
bl0031BW=500Hz; 2k Pt/s<br />
bl0036BW=1kHz; 5k Pt/s<br />
bl0027BW=50kHz; 2k Pt/s<br />
Force pN<br />
-1.45<br />
-1.50<br />
Force pN<br />
0.0<br />
-0.5<br />
-1.55<br />
-1.0nN<br />
-1.60<br />
-1.65nN<br />
7.24 7.23 7.22 7.21 7.20<br />
µm<br />
Figure 11.2.2.3: Examples of filter settings for<br />
force curve acquisition: A) various data<br />
streams from a free air portion of a force curve<br />
collected at 2kHz (i.e., 2,000 points/sec) with<br />
different low pass filter settings- Notice higher<br />
filter settings are more noisy; B) Examples of<br />
force curves collected at various sample Rates<br />
and low pass filter settings: C) zoom of boxed<br />
area in B).<br />
C<br />
Force pN<br />
-300<br />
-350<br />
-400<br />
-450<br />
6.80 6.78 6.76 6.74 6.72 6.70<br />
µm<br />
bl0038BW=200Hz; 10k Pt/s<br />
bl0031BW=500Hz; 2k Pt/s<br />
bl0036BW=1kHz; 5k Pt/s<br />
bl0027BW=50kHz; 2k Pt/s<br />
-500pN<br />
6.76 6.75 6.74 6.73<br />
µm<br />
The author typically sets the sample rate to at least twice the Nyquist Rate, but often as much as 4x’s just to<br />
collect the data with the notion of more points are better because one never knows about the analysis<br />
requirements.<br />
• Examples of the changing the Sample rate and low pass filter can be seen in Figure 11.2.2.3B,C: this was<br />
acquired with an Olympus Biolever in water on a mica surface, but is shown to demonstrate using the Sample<br />
Rate and Low Pass Filter setvar settings to get the effect needed.<br />
7 ‘Set RT Update Prefs’ button- this brings up the UiMenuPanel (Figure<br />
11.2.2.4) allowing the user to choose how the Force graph gets updated:<br />
Never- force plots updates after the acquisition is complete.<br />
Auto- will update with some time constraints within the acquisition<br />
parameters.<br />
Always- force plot is updated as its being collected; this will be evident by<br />
a black line that appears within the data stream in the force curve; See<br />
Figure 11.2.2.2 an some example of this.<br />
Figure 11.2.2.4: Real time<br />
updating of force plots using the<br />
UiMenuPanel.
Ryan’s MFP-3D Procedural Operation ‘Manualette’ Version 10 (v080501; Igor 6.04A); 11.8<br />
11.2.3: The Cal. subtab-<br />
• This sub-tab is where the calibrations are executed and displayed for<br />
spring constant determination (see Chapter 9 for a complete<br />
description of that protocol).<br />
A<br />
Defl InvOLS- deflection inverse optical lever sensitivity- the slope of the<br />
contact regime (of a force distance curve on an infinietly hard surface)<br />
acquired in CONTACT mode, in which the units are nm/V (i.e., amount<br />
of detected distance of cantilever deflection per votlage on the<br />
photodetector).<br />
Kappa Factor- coefficient between Defl InvOLS and AmpInvOLS; value<br />
is usually 1.09. The author forgets the meaning of it, and seemingly the<br />
author of the help menu has as well.<br />
Amp InvOLS- Amplitude inverse optical lever sensitivity- slope of the<br />
contact regime (of a force distance curve on an infinietly hard surface)<br />
acquired in AC mode, in which the units are aslo nm/V. Slightly<br />
different because its an AC signal on the photodetector.<br />
Spring Constant- the calibrated spring constant will be dsiplayed here.<br />
See Section 8 for protocol for determining spring constant k via the<br />
thermal or Sader methods.<br />
Set Sensitivity pull-down menu- this is where to select what is being<br />
calibrated.<br />
B<br />
Figure 11.2.3.1: A)The ‘Cal’ sub<br />
Tab of the Force tab; B) Set<br />
Sensitivity pull-down options.<br />
Amp2 InvOLS- Amp InvOLS for second frequency in DualAC, I suppose.<br />
Virtual Deflection- this is how to calibrate the slight abberant deflection that occurs in the optical detection<br />
system using a very long force distance cycle- the free air often has several nm worth of deflection over the<br />
entire 15 μms of Z travel. It must be calibrated to ‘level’ the free air part of the curve to allow for more<br />
accurate analysis/ determination of contact point; it’s updated upon calibration.<br />
Deflection Offset checkbox- this will electronically set the Deflection voltage in the S&D meter to 0V;<br />
The offset the same magnitude is made to whatever the free air delfection is, this will electronically zero the<br />
deflection, and then an absolute trigger works like a relative trigger (see Section 11.2.7 for more on Absolute<br />
and Relative triggers).<br />
• For example, if there was a -0.88V free air deflection in the S&D meter, typing 0.88V into the deflection offset<br />
setvar, and clicking the checkbox to activate it would electronically set the free air delfelction to 0.0V.<br />
Virtual Defl. 2 nd Term- this is for extended Z range heads that need a polynomial to fit the Virtual Deflection;<br />
is updated upon calibration.<br />
For a more complete protocol description of spring constant calibration, see Chapter 9.
Ryan’s MFP-3D Procedural Operation ‘Manualette’ Version 10 (v080501; Igor 6.04A); 11.9<br />
11.2.4: The GoThere subtab-<br />
• The Go There subtab of Force tab of the Master panel allows the user to<br />
designate points on a previously acquired image for subsequent force<br />
curves. This is very useful when you have imaged the surface and want<br />
to immediately acquire force curves at specific points/features on your<br />
image. The MFP-3D’s closed loop makes the accuracy possible.<br />
Once an area has been imaged for subsequent user defined force<br />
distance-curve (or I(V) curves) to be acquired, use this tab for location<br />
cursor placement.<br />
Procedure:<br />
Acquire image in AC or Contact mode.<br />
If the image was acquired in AC mode, but the desired force curve<br />
acquisition is to be in contact mode (i.e., not dynamic force<br />
spectroscopy), withdraw the tip, and change the imaging mode to ‘Contact’ from the imaging mode pull<br />
down menu in the Main tab of the Master panel.<br />
Click the ‘Show Tip Location’ checkbox- this will bring the location of the tip within the XY scan area,<br />
displayed as a red dot (by default).<br />
In the ‘Spot Display’ pull-down menu, select ‘Numbered Markers’(Figure 11.2.4.1).- this will correlate the<br />
‘Spot Number’ with the defined cursor(s) on the image area (Figure 11.2.4.2B).<br />
Click the ‘Pick Point’ button; this will bring a ⊕ cursor (on the all the open image channels) usually<br />
designated as ‘0’, and will be in the center of the image (Figure 11.2.4.2A).<br />
Using the left mouse button, drag the ⊕ cursor to desired position on one of the image channels.<br />
Click on the ‘That’s It!’ button; which locks the point at that spot, meanwhile the Spot number index is<br />
advanced by one in anticipation of the next point being chosen. Notice the user defined location/ spot is<br />
marked on the image with an ‘X’ and also labeled with the spot number (Figure 11.2.4.2B).<br />
• Notice the Spot Number base suffix will increase by one, expecting another point to be picked.<br />
Repeat as necessary/ desired.<br />
Figure 11.2.4.1: The Go There<br />
subtab for Point and Click force<br />
curve acquisition.<br />
When ready to acquire the force curves, use the setvar arrow keys or type cursor number of which location<br />
to acquire force curves at into the ‘Spot Display’ setvar, then click the ‘Go There’ button. Notice the red dot<br />
designating the tip position will move to that point (Figure 11.2.4.2B), generally at a rate the scan rate is set to<br />
in the Main tab of the Master Panel.<br />
Click the ‘Single Force’ button , ‘Continuous’ button, Crtl +3, or downward function selector toggle (Figure<br />
11.4.1.1) on the controller to acquire force curve(s).<br />
• Figure 11.2.4.2 shows an example of designating some user defined points on a second amplitude image of<br />
some water based paint (see Dual AC Section 6.1.5). In A), the ⊕ cursor was moved from image center to<br />
designate first defined location (as seen in Figure 11.2.4.2B); In B) three different points are selected at<br />
different contrasted image locations- Notice tip is at point three because of red dot marker.
Ryan’s MFP-3D Procedural Operation ‘Manualette’ Version 10 (v080501; Igor 6.04A); 11.10<br />
A<br />
B<br />
Figure 11.2.4.2: Designating ‘Point and Click’ force curve locations on a previously acquired image; A)<br />
drag the ⊕ cursor from center to desired location; B) many locations selected; tip located at position 3,<br />
indicated by red dot (•). Data shown is a DualAC amplitude2 image of water based latex paint in air.<br />
To acquire multiple curves at a given point, you can click the ‘Continuous’ button, and designate the ‘Limit to<br />
Cont’ setvar to a desired value (see Section 11.2.1).<br />
• Recall this setvar isn’t shown in the default MFP-<br />
3D software, so it must be activated by clicking the<br />
‘Setup’ button. If the setvar is set to ‘inf’ it means it<br />
will collecte curves continually (infinitely) until<br />
told to stop.<br />
NOTE: Every time a new file name is chosen, the numbered markers will refresh and you have to pick points<br />
over again.<br />
The locations of these force curves can be labeled on the previous acquired image (if captured)- see Section<br />
11.5.2H (In Analysis).<br />
• If you continue to image in another location or scan size, but have the ‘Show Tip Location’ checkbox<br />
activated, Igor will have trouble scaling the image. Difficult to describe, but obvious when its happening- just<br />
deactivate in the Go There sub-tab of the Force tab.<br />
The ‘Go There’ functions also work for the electrical characterizations techniques.
Ryan’s MFP-3D Procedural Operation ‘Manualette’ Version 10 (v080501; Igor 6.04A); 11.11<br />
11.2.5: The Save subtab:<br />
• This sub-tab is where force curves get saved. Use the same 17<br />
character filename as with the images; the filename can’t start with<br />
a number or Igor lets you know its displeasure with your desire to<br />
attempt this.<br />
• As curves are acquired, the base suffix will increase by 1.<br />
Figure 11.2.5.1: The Save subtab.<br />
NOTE: When the ‘Save to Mem’ (memory) checkbox is selected, Igor<br />
can really get bogged down. The author prefers to save everything<br />
to disk- makes the analysis easier too because you can see all the individual curves.<br />
• See Section 11.5.2E to learn how to save each force curves as an .ibw IF the experiment was saved to<br />
memory, but the ‘Save to Disk’ checkbox was unmarked.<br />
11.2.6: Force Channel Panel:<br />
This panel assigns the data channels displayed and saved in Force<br />
Plots.<br />
The Green / Blue / Red circular dots to the left of the channels<br />
describe the settings of those channels.<br />
● Red = Channel is not on.<br />
● Blue = Channel is ONLY displayed (no examples of this in Figure<br />
11.2.6.1)<br />
● Green = Channel is saved (does not care if channel is displayed<br />
or not).<br />
▪ Up to 5 channels can be plotted simultaneously- activate using<br />
the Graphs pull down menu in the upper right of the Force<br />
Channel Panel.<br />
The default force channel panel should look like Figure 11.2.6.1.<br />
This panel can be a little confusing initially:<br />
• The ‘Save’ column is what data is saved always- the channels<br />
checked here are what can be called up in the Force Display Panel<br />
in the Analysis section of this software (i.e., there is a pull-down<br />
menu that you can select the Y axis for- see Figure 11.5.2A.1).<br />
• The ‘Graphs’ pull-down allows up to 5 channels to be plotted<br />
simultaneously. Depending on the number of graphs selected in<br />
the pull-down menu, that many X&Y columns will be displayed.<br />
Figure 11.2.6.1 displays 2 graphs columns, which is the default in<br />
most MFP-3D software versions.<br />
• Each Graph column allows selection of two dimensions to plot<br />
the desired curve/ signal in.<br />
Figure 11.2.6.1: Force Channel Panel:<br />
activate axis dimensions here.
Ryan’s MFP-3D Procedural Operation ‘Manualette’ Version 10 (v080501; Igor 6.04A); 11.12<br />
• Figure 11.2.6.2 shows an example of a deflection (Y)<br />
vs. Time (X) plot assigned via the Force Display Panel.<br />
The inset shows the X axis radio label selected to<br />
assign time as the X axis; Deflection would be<br />
checked in the Column tab.<br />
Figure 11.2.6.2: A Time vs. Deflection plot<br />
11.2.7: Force Triggering:<br />
The term trigger can mean a lot of different things to a lot of different folks-<br />
▪ Trigger points: The ‘Trigger point’ is a user defined dimension value<br />
(distance, force, voltage, etc.) usually detected on the PSD that tells the<br />
piezo to switch directions even if the force (deflection) curve hasn’t achieved<br />
the completed Force distance (deflection, force, voltage) value.<br />
Activate it by choosing what channel you want it to trigger on (RECALL<br />
Figure 11.2.1.3); (for example, I like to use the ‘deflection’ channel which will<br />
be in nm; alternatively, your can choose DeflVolts, which will be in Volts, or<br />
Force in Newtons).<br />
Type in your desired trigger value; (just don’t pick femptometers…)<br />
Figure 11.2.7.1: Selecting a<br />
trigger channel.<br />
Select what kind of trigger you want; the difference between the two are-<br />
• Absolute trigger is the default trigger: This takes the defined trigger setvar value and adds it to what ever<br />
the free air deflection happens to be. What you get is Force curves with larger deflections (or other channel)<br />
plotted then you might expect. (absolute is (1) in parameter file list)<br />
• Relative trigger is more sensitive and should be used for more accurate force distance curve acquisition,<br />
unless you electronically offset the Deflection- see Section 11.2.3, . The author uses relative trigger because it<br />
triggers at whatever the defined setvar trigger value is. Note, very low trigger values will show inherent noise<br />
floor of cantilever/ system. (relative trigger is (0) in parameter file list)<br />
the Author usually picks ‘relative’…
Ryan’s MFP-3D Procedural Operation ‘Manualette’ Version 10 (v080501; Igor 6.04A); 11.13<br />
A 5<br />
4<br />
5nm Relative trigger<br />
B<br />
50<br />
40<br />
5nm Absolute trigger<br />
nm<br />
3<br />
2<br />
1<br />
nm<br />
30<br />
20<br />
0<br />
-1<br />
10<br />
0<br />
0<br />
-200<br />
-400<br />
nm<br />
-600<br />
-800<br />
Figure 11.2.7.2: Relative vs. Absolute trigger: A) 5 nm relative trigger (notice 5nm deflection on Y axis); B) 5 nm Absolute<br />
trigger with -0.88V deflection which adds an additional 47.74 nm of deflection to trigger point (InvOLS was 54.27nm/V for<br />
this AC160 Si lever), giving about 52nm of deflection before triggger.<br />
0<br />
-200<br />
-400<br />
nm<br />
-600<br />
-800<br />
•Figure 11.2.7.2 shows the difference between Relative trigger and Absolute: In panel A), a 5nm relative<br />
deflection trigger was acquired, while panel B) shows a 50 nm Absolute trigger. Both collected with Deflection<br />
as the trigger channel.<br />
• Some notes for choosing ‘No’ trigger point (i.e., if<br />
‘None’ is selected under the Trigger type pull-down)-<br />
a couple things can happen depending on what the<br />
<strong>St</strong>art Distance is-<br />
If the start distance/ Force distance combination<br />
doesn’t allow the tip to engage on the surface<br />
during its cycle, a noisy curve like the one in Figure<br />
11.2.7.3 will be seen. The noise is essentially the<br />
noise floor of the cantilever. In addition, the history<br />
window notifies you that the curve ‘Never triggered’.<br />
If the <strong>St</strong>art Distance/ Force Distance combination<br />
allows the tip to engage in the surface, it will mash<br />
the tip into the surface until the end of the force<br />
distance cycle has been reached.<br />
Relative triggers-<br />
Figure 11.2.7.3: No trigger reached- curve represents<br />
noise floor of cantilever.<br />
Figure 11.2.7.4 shows two examples of user defined deflection triggers (the cantilever k had been<br />
determined); Panel A) shows a ~1 nm relative trigger- good for functionalized tips where you don’t want the<br />
tip apex or chemistry (functionalization you may have spent time on) to be ground off the tip from excessive<br />
force; while Panel B) has a relative deflection trigger of 15nm.
Ryan’s MFP-3D Procedural Operation ‘Manualette’ Version 10 (v080501; Igor 6.04A); 11.14<br />
A<br />
1.0<br />
0.5<br />
1 nm relative trigger<br />
B 14<br />
12<br />
10<br />
15 nm relative trigger<br />
0.0<br />
8<br />
nm<br />
-0.5<br />
-1.0<br />
nm<br />
6<br />
4<br />
2<br />
-1.5<br />
0<br />
-50<br />
nm<br />
-100<br />
-150<br />
Figure 11.2.7.4: Two examples of low force relative Deflection triggers: A) a ~1 nm relative trigger- notice contact regime<br />
of force curve is minimal- best used for functionalized tips in which some sort of dissociation event is being measured; B)<br />
increasing the relative trigger to a few nm’s worth of deflection. Note there is some weird adhesion to the surface.<br />
• With a calibrated spring constant, choosing force as the trigger parameters allows forces to be dialed<br />
in, which is generally more intuitive than using cantilever deflections.<br />
SURFACE CHARGE CAN ALSO AFFECT FORCE CURVE AQUISTION-<br />
Occasionally, the substrate chosen can be subject to surface charges, causing some crazy nonlinear<br />
deflections in the free air and near point of contact when using very low spring constant<br />
cantilevers. The author has found this to be true of 0.03 N/m (and below) levers using clean glass,<br />
or mica glued to a glass slide. Glass is notorious for having a surface charge. Figure 11.2.7.5A<br />
shows an example of surface charging affecting the force distance curve: notice the non-linearity in the<br />
approach and retract parts of the curve, caused by the long range forces of the surface charge pulling the tip<br />
towards the surface, or an inherently deep water layer. Either way, it’s tough to get a proper virtual deflection<br />
curve fit. To solve this, it’s a good idea to have an atomically flat material that doesn’t possess strong surface<br />
charge- Figure 11.2.7.5B shows a piece of graphite adhered to a magnetic sample puck on an AR magnetic<br />
puck holder, along with the <strong>St</strong>atic Masters to help dissipate charges. All this said, sometimes you can’t get rid<br />
of the charge. Good luck-<br />
0<br />
-2<br />
0<br />
-50<br />
nm<br />
-100<br />
-150<br />
A<br />
B<br />
Figure 11.2.7.5: Surface charge can affect cantilever deflection in force-distance curves: A) attractive forces pulling<br />
cantilever towards surface in approach; B) Eliminating charge by removing any glass components in sample mounting.<br />
Here, the sample (graphite) is fixed to sample puck via silver paint, and placed on an AR magnetic sample holder, and<br />
the use of a <strong>St</strong>atic Master.
Ryan’s MFP-3D Procedural Operation ‘Manualette’ Version 10 (v080501; Igor 6.04A); 11.15<br />
11.2.8: Closed Loop (Z) Activation:<br />
To turn on the closed loop in force measurements, got to the setup<br />
menu to activate it, from the mode pull down menu, select Closed<br />
loop- this will ensure the piezo moves at a constant velocity because<br />
the LVDT closed loop sensors will command the piezo voltages applied<br />
to the Z piezo.<br />
Force curves can be monitored with the headphones. This is great for a variety of reasons: You<br />
can have the headphone volume up to listen/monitor to the force-distance cycles while you<br />
work on something else across the room. Large (non-specific) multiple events curves can be<br />
heard through a sort of ‘ripping’ sound when working with bio systems; or you can hear if the<br />
tip comes off the surface by a constant static noise (as opposed to static, dampen, static sound<br />
of a regular force-distance cycle).<br />
11.2.9: Empirical considerations:<br />
Force Distance- choose a force distance that is large enough to have some of the free air portion in the curve,<br />
such that the contact point can be properly determined for the analysis. Using force distances that are too<br />
long (i.e., mostly all free air in the curves) are just wasting time, unless they are specifically required (perhaps<br />
heterogeneous surface topographies might require this in an adhesion or compliance force map.<br />
Working in fluid- when acquiring force curves in fluid (which is common) it’s a good idea to let the system<br />
equilibrate for a couple hours. The most dramatic deflection drift will occur in the first 20 minutes, but drift<br />
will continue to occur as the thermal gradients approach equilibrium.<br />
Additionally, there can be some mechanical drift due to friction and the non-ideal shapes of the head legs<br />
settling into their respective kinematic mates. A good practice for setting the head down is a very gently twist<br />
to the left (CCW) when setting the head down- very gently, just to reduce some stress- you may not even<br />
register movement. Newer systems don’t have this issue due to a kinematic machine difference in the<br />
baseplates.<br />
Choosing velocity in fluid- choosing too great a velocity<br />
when working in fluid can cause hydrodynamic effects.<br />
Figure 11.2.9.1 shows an example of this- as the velocity of<br />
the cantilever increases from 1 to 20 um/s, there appears to<br />
be some hysteresis between the approach and retract cyclesthis<br />
is a hydrodynamic effect, and is something that should<br />
be avoided because it will affect the contact point in analysis,<br />
among many other potential convolved contributors.<br />
When figuring out experimental parameters for force curve<br />
acquisition, this should be one of them.<br />
nN<br />
1<br />
0<br />
-1<br />
-2<br />
-3<br />
20 um/s<br />
1 um/s<br />
10um/s<br />
Trigger points- these are very important, especially when<br />
using functionalized tips- applying too much force with a<br />
high trigger point value can cause the tip to be ground into<br />
the substrate, seriously compromising the chemistry on the<br />
tip.<br />
The flip side is if you want to average the invols throughout<br />
-4<br />
0.0<br />
-0.2<br />
-0.4<br />
Figure 11.2.9.1: Hydrodynamic effects can<br />
occur in fluid with fast force curve acquisition<br />
cycles.
Ryan’s MFP-3D Procedural Operation ‘Manualette’ Version 10 (v080501; Igor 6.04A); 11.16<br />
the force data set, a small trigger won’t give enough points such that the invols appears to shift more<br />
throughout the data set.<br />
Loading rate: In some cases, determining the loading rate is important for publication. Acquiring the force<br />
curves at the same spot with different velocities will suffice- the force values generally increase with velocity.<br />
Using different cantilevers over the course of the experiment will require some velocity (or force distance)<br />
matching so the different cantilevers can be compared properly in the analysis.<br />
Cantilever selection- choosing a cantilever that is appropriate for the measurement is also important. Trying<br />
to measure small forces with a stiff lever might not be sensitive enough. The opposite is true when trying to<br />
push on something less compliant with a low spring constant cantilever- the cantilever can deflect a similar<br />
amount regardless of how much force it’s asked to apply.<br />
Sample Prep- it’s important to have the substrate affixed very well- Don’t use two sided tape- it can introduce<br />
a lot of creep into the experiment, but more importantly, if working in fluid it can come detached- ultimately<br />
causing it to ‘float’. When this occurs, there can be some hysteresis in the contact regime of the curve because<br />
the cantilever is displacing the substrate, along with whatever material is on the surface.<br />
Sampling points- having a sufficient amount of data points can be beneficial such that a small force event<br />
can be detected in the analysis portion of your experiment (which the author suspects is 90% of the force<br />
spectroscopy experiment). It’s good to look at a few curves in the offline to confirm enough points are<br />
present. A safe bet is to choose about four times the Nyquist rate.<br />
InvOLS / k changes before and after an experiment- sometimes you can get different InvOLS values numbers<br />
before and after an experiment- this can happen, although it’s not really intuitive when you think about it.<br />
•It could be slight spot movement (maybe some knobs were brushed at somepoint<br />
•Sometimes the tip just lands on some spurious local asperity which contributes enough to the deviation.<br />
•Floppy cantilevers can be dampened by the surface even when the tip is retracted several microns- this in<br />
turn compromises the thermal peak fit on the final step of the k determination. Wheel that tip several<br />
hundred microns up (if you can), and the peak should be sharper (Example seen in Figure 9.10B).<br />
there are some ways around this thoughyou<br />
can average all the InvOLS values throughout the experiment (preferably if you have a several 10’s of<br />
nanometers of deflection trigger to get a decent InvOLS fit), or you can take an average before and after, then<br />
combine after the experiment – you have to dump this into the Parm setvar in the Force Review Panel (see<br />
Section 11.5.2C)<br />
this approach does depend what is being done, softer material won’t be especially suitable for this approach<br />
because they are not infinitely hard surfaces. To get around this, you can calculate the InvOLS (or average<br />
InvOLS) on an infinitely hard surface with the same tip and then plug that into the spring constant setvar in<br />
the Force Review Panel. (see Section 11.5.2C)
Ryan’s MFP-3D Procedural Operation ‘Manualette’ Version 10 (v080501; Igor 6.04A); 11.17<br />
11.3: Force Mapping:<br />
There are two ways to acquire force mapping curves with the MFP-3D (well really three- our Atomic Force<br />
application scientist <strong>St</strong>efan Vinzelberg has also written some, but the author hasn’t used it personally):<br />
The newer versions of the MFP-3D software have a 5 th tab in the Master Panel for Force Mapping.<br />
Chad Ray (Duke Chemistry) has written a macro to acquire force distance curves in an array- something that<br />
AR has been using for years.<br />
MFP-3D Force Mapping:<br />
In versions after 080310, a fifth tab in the Master Panel called the<br />
FMap panel (Figure 11.3.1A) allows the acquisition and calculation of<br />
Force Maps acquired from the MFP-3D, and can do this in REAL<br />
TIME. This is new code that can acquire up to 100,000 force map<br />
points, and even more if your have a hot rod computer.<br />
A<br />
The curves can be collected in a ‘Frame Down’ fashion (starting<br />
point blue dot):<br />
Row 1<br />
Row 2<br />
Row 3<br />
The opposite is true is doing a ‘Frame Up’ Force map. For the MatLab<br />
exporters out there, this is an important consideration for post<br />
processing due to the way they are exported.<br />
To set the force map acquisition up-<br />
Determine whether to perform Force distance acquisition in<br />
contact mode or AC mode (Dynamic force).<br />
Determine the scan area for the Force Map; if acquiring a force<br />
map directly after imaging an area, the ‘Scan Size’ setvar will already<br />
have that area dialed in the ‘Scan Size’ setvar; the same occurs for<br />
the X&Y offsets.<br />
Determine the velocity of the translation between points in XYthis<br />
is remarkably similar to scan rate, but a setvar with frequency<br />
units is not offered.<br />
Determine a Scan Angle the tip will follow during the acquisition<br />
(i.e., if 0°, then the X axis will be parallel to the length of the<br />
cantilever; 90° will be normal to the length of the cantilever).<br />
B<br />
Figure 11.3.1: Force Map tab: A)<br />
showing map parameters; B) showing<br />
triggering parameters.<br />
Determine the number of points and lines. This code is designed to handle 256 x 256, but the coder has had<br />
it beyond that- he suspects higher performance computer makes this occur with less hiccups.<br />
• The ‘Scan Line Time’ setvar will tell how long it will take to acquire the Force Map based on the parameters<br />
defined.<br />
• The Width: Height is the aspect ratio of the scan area, just as in imaging.
Ryan’s MFP-3D Procedural Operation ‘Manualette’ Version 10 (v080501; Igor 6.04A); 11.18<br />
• The ‘Delay Update’ nor ‘Slow Scan Disabled’ features do not work yet. Look for it to be added in later<br />
versions.<br />
Define trigger points and tip velocity in the Force sub-tab (Figure 11.3.1B); they will be refreshed in the<br />
Force tab as well; and vice versa.<br />
Confirm the data is being saved some where; The author suggests creating a separate folder for this- the<br />
curves will then be saved in separate folders that contain all the points per each line (i.e., in the 50 x 50<br />
example below, 50 different folders were created). This is no big deal, for the Calculation part, just load the<br />
folder created (see Section 11.5.1).<br />
• Every time a new force map is begun, a new folder will be added to the<br />
root folder. For example, if your root file name is XXXX, then the first time a<br />
force map is begun, a folder called XXXX01 will be created in the root; that<br />
folder contains folders containing the points from each line/row of the map.<br />
Beginning a new force map will create a new folder called XXXX02, or so on.<br />
• The author has experienced some difficulty when calling the folder ‘FMap’-<br />
probably because FMap is in the code (although this is just speculation<br />
because the author doesn’t know how to code). Name it something other than this- FMap1 works.<br />
To acquire a Force Map in real time, the Calc subtab needs to have the proper data inputs designated to<br />
display them as the Force Map is being acquired. Something that looks like an MFP-3D ‘Display Window’<br />
appears during acquisition, with tabs that correlate to what Channels that are selected in the Calc subtab (see<br />
Figure 11.3.3).<br />
Click ‘Do Scan’, ‘Frame Up’ or ‘Frame Down’ to begin Force Map<br />
Acquisition.<br />
Go get a sandwich, or take a nap.<br />
• As the Force Map is being acquired, the red dot that indicates tip<br />
position is displayed on the image channel window. Figure 11.3.3<br />
shows a screen shot example of a Force Map being collected in real<br />
time. The red area at the top of the image is where data points hadn’t<br />
been collected yet.<br />
NOTE: if using a functionalized tip, or you don’t plan on imaging<br />
before the Force Map acquisition, click on ‘Do Scan’ in either the Main<br />
tab or the FMap tab to expand the image channel panel before<br />
engaging- the tip will begin scanning even though it isn’t on the<br />
surface, and no damage will occur to the tip. This is only mentioned<br />
because it can help the user get a special feel for where the tip (in XY)<br />
is during the experiment.<br />
Figure 11.3.2: The Calc. subtab<br />
defines Force map data channels and<br />
their respective parameters.
Ryan’s MFP-3D Procedural Operation ‘Manualette’ Version 10 (v080501; Igor 6.04A); 11.19<br />
• A real time screen shot of a Force map<br />
of some five polymeric particles (red) on<br />
mica (blue) using a Si tip is shown in<br />
Figure 11.3.3. The parameters the<br />
author used for acquisition of the Force<br />
Map used for image can be seen in<br />
Figure 11.3.2 .<br />
Figure 11.3.3: Screen shot of real time Force map acquisition: Pixels<br />
are updated after each subsequent acquisition.<br />
Old School alternative: Chad Ray’s Force Volume program:<br />
• This is a macro that Chad Ray, PhD (Akremitchev lab, Duke Chemistry) wrote many years ago that is based on<br />
the MFP-3D ‘Go There’ code. HOWEVER, it does not work with MFP-3D software version 080501- an earlier<br />
version (like the older stable version 070111 should work (see Section 14.16 for making MFP-3D software<br />
copies). The author only includes it because it has a history with MFP-3D users because it was the force<br />
mapping acquisition program used for many years, and easily allows data export for all those MatLab users<br />
out there (common in the force spectroscopy labs around the globe).<br />
Obtain Chad Ray’s force Volume acquisition program from<br />
support@AsylumResearch.com, or the author.<br />
The version you want is 060404 and it’s easy to install.<br />
Click the executable and load the user function into the desired<br />
version of the MFP-3D software (i.e., if you have multiple copies of MFP<br />
software; see Section 14.16 for a description on multiple MFP-3D<br />
software versions).<br />
Activate by going to Programming→ Load User Functions →<br />
UserChad0. It will load a Panel similar to Figure 11.3.4.<br />
Tip engagement: the author usually tries to engage as gently as<br />
possible either with the gentle AC mode false engagement technique<br />
(see Section 6.1.2B), then switch to contact when the tip is in proximity<br />
of the surface via the piezo extension; OR via one of the gentle<br />
techniques used in Contact mode (see Section 8.2).<br />
Figure 11.3.4: Chad Ray’s Force<br />
Volume acquisition panel.<br />
•It is presumed that the spring constant has been determined at this point.<br />
Choose the array size (keep number of points and lines and equal value), and what output you want the y-<br />
axis to display (i.e, Force, deflection); choose what the X axis should be- (i.e., Raw or LVDT)<br />
‘One Note’ makes only one parameter header in that specific folder full of ibw’s.
Ryan’s MFP-3D Procedural Operation ‘Manualette’ Version 10 (v080501; Igor 6.04A); 11.20<br />
Enter the scan area size in the Main tab of the Master panel- Chad’s program will equally divided the<br />
number of points in the array size relative to the scan area.<br />
NOTE: if you are using a functionalized tip and do not want to image (i.e., raster) with it<br />
before taken the force curves (which is not suggested); click the do scan button before<br />
engaging so a full image window is open. See featureless image, Figure 11.3.5.<br />
•The author suggests having parameters like <strong>St</strong>art Distance,<br />
Force Distance, Trigger Point, Velocity, etc., determined before<br />
starting the Force Map experiment.<br />
Go to the Save sub-tab of the Force tab (see Section 11.2.5)<br />
in the Master Panel; determine what to name the experiment,<br />
and if an image note is needed.<br />
Click the ‘Save to Disk’ checkbox. The author<br />
recommends creating a separate folder for each Force Map<br />
experiment- this make it easier for analysis, or batch curve<br />
exporting.<br />
Click the ‘Do Force Volume’ button; the AFM will begin to<br />
collect force curves from left to right on each line, following<br />
the raster pattern depicted by the arrows in (Figure 11.3.5).<br />
• To change the appearance of the markers, marker numbers<br />
or tip position marker, Click on one of these feature to bring<br />
up the Igor ‘Modify Trace Appearance’ Panel. An example can<br />
be seen in Figure 11.3.6.<br />
Figure 11.3.5: Image channel display points<br />
of Force map acquisition.<br />
• When the acquisition program is finished, the piezo will retract<br />
to 0V (tip is withdrawn).<br />
ANALYSIS-<br />
See Section 11.5.1G for force curve analysis description/<br />
protocol.<br />
Batch Force curve export-<br />
Chad’s program will also export the curves as .dat files by<br />
clicking the ‘Export Data’ button. It will create a folder within<br />
the folder that the force map data is stored called ‘export’.<br />
• If the ‘One Note’ checkbox is activated, it will create one<br />
text file that has the header info in it, and the rest of the curves<br />
are tab delimited.<br />
• The text file curves can copied and pasted from notepad, or in<br />
some programs opened directly.<br />
Figure 11.3.6: Changing the default marker<br />
appearance of the Force map during<br />
acquisition using the Igor Modify Trace<br />
appearance panel.
Ryan’s MFP-3D Procedural Operation ‘Manualette’ Version 10 (v080501; Igor 6.04A); 11.21<br />
Chad has incorporated a feature called ‘Update <strong>St</strong>art Dist checkbox that automatically adjusts the<br />
start distance as the tip traverses the sample collecting the array. This way you don’t have to be<br />
concerned about the tip not making contact because the surface is not level.<br />
This process can be monitored in real time by listening to the transducer (headphones). When<br />
the tip makes contact, you can hear it go from a static noise to quiet/ dampened (contact), and<br />
back to static sounding upon retraction.<br />
11.4: Misc. Acquisition Operations:<br />
11.4.1: ‘Fishing’:<br />
There is a technique in force pulling in which a dissociation, or series of dissociations are sought- using the tip<br />
to try to ‘hook’ a molecule on the surface, or is functionalized and is brought near the surface for some time to<br />
allow a receptor – ligand association to occur. Quite often the success rate of this is low, and takes many<br />
attempts, hence the term ‘fishing’. The experimenter can use the forward pull (red mode) or reverse pull (blue<br />
mode), which allows some reaction time to occur as the tip sits at the surface. Quite often the Hamster wheel<br />
is used to fine tune the start distance in real time.<br />
Procedure-<br />
Confirm that Forward pull (red Mode) radio button is activated in the Force tab. (see Section 11.2.1).<br />
Use a small trigger point value (i.e., couple nm’s worth of Deflection), if the tip is functionalized or for use<br />
with low applied tip force.<br />
Click the ‘Single Force’ button such that a force curve is performed to find the surface.<br />
Select ‘None’ from the Trigger point pull-down menu (i.e., turn off trigger point; Figure 11.2.7.1).<br />
Activate ‘<strong>St</strong>art Distance’ radio button.<br />
Use the Hamster wheel to finely move the <strong>St</strong>art Distance closer or further<br />
from the surface such that the tip makes contact with the surface right at<br />
the end of the Force Distance cycle.<br />
Use the Function toggle switch to activate a single force pull by pushing<br />
the lower portion down (Figure 11.4.1.1). If there happens to be some Z<br />
drift, adjust the Hamster wheel in the appropriate direction. NOTE: There is<br />
no toggle switch to do this on the remote hamster on the new ARC2<br />
controllers ( Figure 1.5) it’d be nice if there was.<br />
Repeat as necessary.<br />
Figure 11.4.1.1: Downward<br />
Function toggle to execute force<br />
curve when working in Force tab.<br />
• Figure 11.4.1.2 shows some examples of fishing for a titin construct physisorbed to Au in fluid, using a Au<br />
coated tip. The first panel shows a force curve that doesn’t touch the surface; a slight increase in the start<br />
distance (80nm) allows the tip to just touch the surface; a further increase in the start distance (50nm) brings<br />
the tip in contact with the surface long enough to produce an event, although not very periodic; increasing<br />
the start distance another 10nm shows a nice titin pull (i.e., periodic sawtooth pattern).
Ryan’s MFP-3D Procedural Operation ‘Manualette’ Version 10 (v080501; Igor 6.04A); 11.22<br />
A<br />
-24.0<br />
B<br />
-24.2<br />
-24.4<br />
-24.2<br />
-24.6<br />
nm<br />
-24.8<br />
nm<br />
-24.4<br />
-25.0<br />
-24.6<br />
Force Dist: 5.60um; time:7:56:59<br />
-25.2<br />
-25.4<br />
Force Dist: 5.68um; time:7:57:14<br />
C<br />
20<br />
10<br />
2.15 2.10 2.05 2.00 1.95 1.90<br />
µm<br />
D<br />
20<br />
2.25 2.20 2.15 2.10 2.05 2.00<br />
µm<br />
10<br />
0<br />
nm<br />
nm<br />
0<br />
-10<br />
Force Dist: 5.73um; time:7:57:22<br />
-10<br />
Force Dist: 5.74um; time:7:57:36<br />
-20<br />
-20<br />
2.30 2.25 2.20 2.15 2.10 2.05<br />
µm<br />
2.30 2.25 2.20 2.15 2.10 2.05<br />
µm<br />
Figure 11.4.1.2: Examples of sequential force distance curves acquired via ‘fishing’ for a Titin Construct. All<br />
curves acquired with a force Distance of 297.83nm; and velocity of 297.83nm/s. Force distances and time<br />
indicated in each force curve panel; A) tip doesn’t make contact with surface; B) increase force distance to<br />
barely touch surface; C) increase Force distance futher to show some events; D) increase Force Distance<br />
slightly more to get nice titin pull. Data courtesy of Jason Cleveland (AR) and Jan Hoh (JHU).<br />
11.4.2: Force Clamping:<br />
Force clamping is an advanced force curve acquisition technique that works well<br />
with molecules tethered to the tip and surface- at some user defined point in the<br />
retract cycle of the force curve, the cantilever can maintain a negative deflection<br />
under feedback.<br />
•There are many parameters in the Force Clamping Panel that are arrived at by<br />
trial and error depending on the molecule. Without the proper molecule to tether<br />
to the tip and surface a, it has been difficult for the author to appropriately<br />
describe this in the beta version.<br />
The intent to describe this section more accurately in the final version of this<br />
manualette.<br />
To open the Force Clamp Panel, Goto Programming Load User Func.<br />
•The LoadUserFuncMacro dialogue appears-<br />
Select ForceClamp.ipf.<br />
Click the ‘Continue’ button.<br />
• This will load the Force Clamp Panel (Figure 11.4.2.1).
Ryan’s MFP-3D Procedural Operation ‘Manualette’ Version 10 (v080501; Igor 6.04A); 11.23<br />
• Typically, before successful clamping commences, some<br />
standard force curves should be obtained to determine the types<br />
of parameters to be used (i.e., force distance, trigger points;<br />
sample rates, etc.).<br />
Perform some force curves to get an idea of the Trigger points,<br />
Dwell, velocity, and other parameters that are needed. The<br />
author’s experience is a distance from the surface (on the retract<br />
cycle) must be determined with acquiring regular force curves to<br />
assign the ‘Pull Off’ value in the Force Clamp Panel – this will be<br />
when the clamp feedback kicks in.<br />
Another advantage of performing regular force curves before<br />
activating clamped curves is to find an area on the surface that<br />
has a molecule to grab. Depending how dilute the surface is, this<br />
could take a bit of time and patience.<br />
At this point, it is best to read the help menus for<br />
Force Clamping. A protocol will be developed for<br />
the official version 10 release of this operational<br />
manualette. Contact support@asylumresearch.com<br />
if you really need to use this in your research.<br />
Figure 11.4.2.1: Force Clamp Panel.
Ryan’s MFP-3D Procedural Operation ‘Manualette’ Version 10 (v080501; Igor 6.04A); 11.24<br />
11.4.4: Colloidal Probe Microscopy:<br />
Colloidal probe microscopy is a force spectroscopy technique in which<br />
a spherical probe is mounted onto a cantilever, and used (in most<br />
cases) to push on a soft material. The sphere allows Hertzian mechanics<br />
to be applied to the analysis.<br />
Some reviews and useful papers regarding colloidal probe microscopy:<br />
Bonaccurso, E., Kappl, M., Butt, H.-J., Current Opinion in Colloidal & Interface Science, 2008 13<br />
107-119.<br />
Table 1 (P 319) Vezenov, D., Noy, A., Ashby, P., J. Adhesion Sci. Technology 2005 19 (3-5) p313 – 364.<br />
Leite, F.L., Hermann, P.S.P., J. Adhesion Sci. Technology 2005 19 (3-5) p365 – 405.<br />
Christendat, D., Abraham, T., Xu, Z., Masliyah, J., J. Adhesion Sci Technology 2005 19 (3-5) p149-163.<br />
Tormoen, G.W., Drelich, J., J. Adhesion Sci Technology 2005 19 (3-5) p181 – 198.<br />
Kappl, M., Butt, H.-J., Particle & Particle Systems Characterization 2002 19 (3) p 129-143.<br />
Some assumptions for acquisition and analysis include:<br />
•Load ∝ α(depth) m , where is a function of the geometry & the elastic properties (Young’s modulus and<br />
passion ration); and m reflects the shape of the pressure distribution.<br />
• is fully elastic<br />
•Pressure distribution same a spherical indenter shape<br />
•Radius of spherical indent < radius of sphere<br />
•No friction<br />
•Isotropic<br />
•Cantilever spring constant similar to material being pushed- want cantilever k much larger.<br />
The analysis of compliance curves is described in Section 11.5.2I under the Elastic subtab description of fitting<br />
the data.<br />
A Note on Cantilever Calibration with Spheres: it is usually more challenging to calibrate the cantilever<br />
spring constant (via thermal method) with a sphere affixed due to the increased Surface Area (especially in<br />
air), and the typical materials spheres are made from. An example of large surface forces acting on a sphere<br />
can be seen in Figure 11.XX- notice large jump to contact and ridiculous adhesion to surface before snapping<br />
back to free air.<br />
There are two ways to avoid large attractive forces that will affect the virtual deflection calibration: If<br />
working in air, calibrate virtual deflection and the thermal tune far off the surface (several hundred microns) to<br />
avoid long range charges of sphere and surface from prematurely deflection cantilever; or work in fluid,<br />
although the much lower Q of cantilever can make fitting the curve more challenging.<br />
For acquisition, some considerations:<br />
• Not to indent more than a quarter of the diameter of the<br />
sphere affixed to the cantilever.<br />
• Choose your cantilever spring constant so that it actually<br />
can apply a load to the sample, rather than fully deflect<br />
with the load (see Figure 11.4.XX).<br />
Mindy 5 or3 infinitely hard surface<br />
Anodisc 11<br />
200<br />
150<br />
nN<br />
100<br />
50<br />
0<br />
-50<br />
0<br />
-10<br />
µm<br />
Figure 11.X.XX: Large surface forces can act on<br />
a sphere affixed to cantilever (in air; k ?)<br />
-20<br />
-30
Ryan’s MFP-3D Procedural Operation ‘Manualette’ Version 10 (v080501; Igor 6.04A); 11.25<br />
80nm<br />
60<br />
calibration (slope=0.828449)<br />
material of interest (slope=0.867995)<br />
80nm<br />
60<br />
calibration (slope=0.828449)<br />
material of interest (slope=0.867995)<br />
Deflection (nm)<br />
40<br />
20<br />
0<br />
Deflection (nm)<br />
40<br />
20<br />
0<br />
-20<br />
-20<br />
-40<br />
-40<br />
0.0<br />
-0.5<br />
-1.0<br />
distance (um)<br />
-1.5<br />
-2.0<br />
-2.5µNaN -2.0 -1.5 -1.0 -0.5 0.0<br />
distance (um)<br />
Figure 11.X.X: Force vs. distance; B) Force vs. Indentation (deflection (PSD signal) is subtracted from the LVDT<br />
signal.<br />
• If viscoelasticity is a consideration, perhaps a dwell period at some constant load with an oscillating<br />
waveform is in order (see Section 11.4.3 to make custom waveforms in the AR Function Editor)<br />
• Confirm that the piezo velocity isn’t too fast to cause any hydrodynamic effects (see Section 11.2.9)<br />
• Colloidal probes are commercially available from NovaScan (Iowa), sQube (Germany) and probably some<br />
other vendors; but can also be made in the lab, especially if your MFP-3D has some sort of bottom view optics.<br />
The author believes that learning how to do this should be relative to how many are needed for the research.<br />
With enough practice, it can be done efficiently without lacking quality, but the first few take awhile and seem<br />
to have a larger margin of error in the assembly and aesthetics.<br />
• Regarding sphere materials, things to consider are: Material’s thermal expansion coefficient (Borosilicate<br />
has a favorable one); the Material’s modulus (don’t want it too soft to act as another spring in the system);<br />
mono/ poly dispersity of particles glued to tips (i.e., for Herztian mechanics, as close to sphere shape as<br />
possible helps the math); the Material charge - most polymers and glass products have an intrinsic charge,<br />
which can contribute to attractive/ repulsive forces.<br />
Preparing Colloidal Probe tips:<br />
There are different ways to prepare them, however, the author will describe how they are made in <strong>St</strong>efan<br />
Zauscher’s lab (Duke MechE; thanks to Jeffery Coles and Eric Darling for showing me how to make them). It<br />
takes some practice to achieve coordination, but isn’t that hard to do.<br />
The set up is shown schematically in Figure 11.4.4.3A- a pulled capillary (mounted in an XYZ micropositioner)<br />
is oriented such that some portion of the end of it can be focused upon with the objective of a standard<br />
optical microscope. A small amount of glue is placed on a glass slide and set onto the microscope stage (UV<br />
curable Norland optical adhesive #81- UV cures in about 15 min., but is workable for some time).<br />
Using the X,Y & Z translators on the microscope, the stage is moved up to the pipette to get a small amount<br />
of glue- what normally seemed to occur is several small droplets formed along the pulled pipette, which is<br />
fine because the can all be used. Next, the glue slide is moved aside and another standard microscope slide is<br />
set on the stage with the probe(s) laying tip side up. The stage is translated such that the cantilever to be<br />
sphere mounted is brought up to a glue droplet- you’ll know when it gets close because it will come into<br />
focus with the droplet on the pipette (same focal point); its OK if the cantilever deflects slightly because the<br />
tip shape doesn’t have to be preserved. Only a small amount of glue is needed- See Figure 11.4.4.3C.
Ryan’s MFP-3D Procedural Operation ‘Manualette’ Version 10 (v080501; Igor 6.04A); 11.26<br />
• Next step is to mount the uncured glued cantilevers into the cantilever holder; with a sprinkling of the<br />
spheres to be glued to the cantilevers on a clean glass slide on the scanner plate in the MFP3D. Glass slide<br />
should be very clean (Piranha; rinsing with copious amounts of DI water; N2 dry; oven dry) Spheres are made<br />
from all kinds of materials- in the author’s tutorial, the Zauscher lab used 10 um borosilcate spheres (Duke<br />
Scientific). Unless tip-less cantilevers are being used, confirm that the pyramid height isn’t taller than the<br />
sphere to be glued, or there will be some difficulty picking it up behind (or in front) of the tip.<br />
Using the tip (& bottom) view optics, the probe can be translated over to a sphere on the substrate and the<br />
head lowered to make contact. This is remarkably similar to the Cleveland added mass method of spring<br />
constant calibration. It’s best to have the tip engaged (in contact mode) so that when the head is lowered to<br />
make contact, there is some give.<br />
A<br />
B<br />
Figure 11.4.4.3: placing glue on cantilevers using optical<br />
microscope stage: Focus on pulled capillary containing glue<br />
droplets- use microscope stage to bring up to static glue drop<br />
until slight deflection is seen in cantilever; B) image of<br />
capillary under objective: Example of amount of glue need at<br />
end of cantilever (Veeco NP SiNx).<br />
C<br />
Sphere<br />
tip<br />
Glue<br />
During this pick up stage, monitor the Deflection<br />
voltage in the S&D meter- it will deflect to a positive<br />
voltage when the tip is lowered onto a sphere.<br />
Switching between top and bottom view optics can<br />
make this registration process a little easier.<br />
30<br />
20<br />
• Sphere placement can be in front of or behind the<br />
tip. The placement of the sphere can affect the<br />
analysis assumptions- be sure to have a plan for<br />
analysis before preparing these probes.<br />
nN<br />
10<br />
0<br />
-10<br />
Figure 11.4.4.4 shows an example of a Force vs.<br />
Separation curve acquired with a 5μm sphere on a<br />
0.0<br />
0.5<br />
1.<br />
µm
Ryan’s MFP-3D Procedural Operation ‘Manualette’ Version 10 (v080501; Igor 6.04A); 11.27<br />
NovaScan SiNx cantilever (k= 0.32 N/m). Sample?<br />
Fitting compliance curves with basic Herztian mechanics found in the MFP-3D software is described in Section<br />
11.5.XX– the author is aware that analysis can get pretty involved using more complex mathematical models,<br />
but this is a good place to start for those in the crowd that want to dabble with this to make a relative<br />
measurement.<br />
11.4.5: Cantilever based indentation:<br />
Cantilever based indentation is a nice (relative) way to look at compliance of materials, but it is subject to<br />
great error due to the concomitant longitudinal and torsional cantilever movements as the piezo pushes the<br />
cantilever towards the surface- this additional movement cannot be easily characterized, ultimately<br />
compromising the quantitative modulus property value in the analysis. Never the less, is very commonly used<br />
and can yield a lot of information about samples.<br />
Depending on cantilever spring constant and the compliance (modulus) of the sample, it can be difficult to<br />
determine which dimension the ‘tip’ experiences the most movement in. Another significant issue is deconvolving<br />
the contact area of the tip (one of the larger sources of error in nanoindentation experiments).<br />
Other considerations are the possibility of the tip piercing the sample, and determining the torsional<br />
cantilever constant.<br />
All that being said, it can be rather useful for some relative / approximations for sample compliance. In<br />
addition to using the force panel for acquisition, the vertical nanoindentation panel can also be used- here<br />
the surface is ‘found’ with a low trigger force, then the indenter panel kicks in to apply a load under constant<br />
load, or force (system works under closed loop operation). More on the indentation panel is seen in Section<br />
XX.<br />
An example of the tip moving in the X (or Y)<br />
dimension as force is applied to the surface<br />
can be seen in Figure 11.4.5.1- a ~80nN load<br />
was applied with a 1.45 N/m Si cantilever into<br />
some PDMS. Notice the slipping of the<br />
cantilever in the extension curve (red)- this is<br />
the tip slipping on the surface as the load is<br />
applied- hardly a uniform load. De-convolving<br />
this would be very challenging and laden with<br />
error.<br />
nN<br />
80<br />
60<br />
40<br />
20<br />
0<br />
pdms0002Force_Ext<br />
pdms0002Force_Ret<br />
500 400 300 200 100 0<br />
nm<br />
Figure 11.4.5.1: example of cantilever based indent on<br />
PDMS where tip stick-slips in the approach (red), while<br />
retract looks like a smooth unload (blue). Force (Y) vs.<br />
distance (X).
Ryan’s MFP-3D Procedural Operation ‘Manualette’ Version 10 (v080501; Igor 6.04A); 11.28<br />
Instances where the cantilever gets pinned (arrows) as<br />
the Z piezo continues to push against the material often<br />
results in negative deflection (cantilever becomes bowed<br />
under tension), which give negative slope in the Force vs.<br />
Indentation plots (Figure 11.4.5.2). This will confuse the<br />
fitting algorithm because negative slope tricks the<br />
software into thinking the cantilever is moving away<br />
from the surface (remember extending piezo). In this<br />
example, some cantilever based indentation was<br />
occurring on an active ingredient of a common<br />
pharmaceutical (data courtesy of Jonas, <strong>University</strong> of<br />
Iowa).<br />
50nN<br />
Force (nN)<br />
40<br />
30<br />
20<br />
10<br />
0<br />
-60nm -50 -40 -30 -20 -10 0<br />
Indentation (nm)<br />
Figure 11.4.5.2: Effects of negative deflection<br />
that can occur when cantilever gets ‘pinned’ as<br />
piezo continues to push towards surface:<br />
Indenation vs. Force gives negative deflection-<br />
AFM thinks cantilever is movi n g away as piezo<br />
Figure 11.4.5.3 shows and where the cantilever spring<br />
constant was too floppy to show a difference between<br />
the infinitely hard calibration surface, and the material.<br />
This is apparent due to the relative slopes of the two<br />
force curves- they are very similar.<br />
TAKE HOME MESSAGE: cantilever selection is very<br />
important.<br />
60nm<br />
40<br />
Deflection (nm)<br />
20<br />
0<br />
soft material<br />
Hard Surface<br />
-20<br />
-40<br />
0<br />
-5<br />
-10<br />
Figure 11.4.5.3: Example of too soft a lever<br />
being used- hard surface contact regime very<br />
similar to force on material- means cantilever<br />
cannot apply enough force to push into it.<br />
Empirical Considerations for acquisition-<br />
Aside from the empirical considerations mentioned in Section 11.1. X, here are some additional<br />
considerations-<br />
• Tip material vs. sample material hardness- if the tip material is similar in hardness/ modulus to the sample, a<br />
two spring system is in play, further adding to the error- especially is soft. In indentation, the indenting tip<br />
should be much harder than the sample (Si has a Moh’s hardness scale of ~2- 3).<br />
• sample mounting is important- use a good glue to eliminate this intended adhesion layer as a possible<br />
spring under the substrate. This can manifest itself as a hysteresis between the approach and retract curvesmost<br />
noticeable in the contact regimes.<br />
• Elastic vs. plastic deformation: this will affect the load and unload a great deal. The shape of curve and give<br />
qualitative sense to what the material is doing during a loading cycle.
Ryan’s MFP-3D Procedural Operation ‘Manualette’ Version 10 (v080501; Igor 6.04A); 11.29<br />
• indentation depth: shallow indents generally show less tip plowing than large indent depths- this can<br />
sometimes give negative slopes in the Force vs. Indentation unloading curve because tip gets pinned as piezo<br />
continues to drive it into surface (Force vs. indentation, see Figure 11.4.5.1 above), negative deflection doesn’t<br />
make sense to the computer during analysis (it thinks the tip is moving away from the surface with increasing<br />
piezo extension which clearly shouldn’t occur). This is likely due to a combination on mostly plastic<br />
deformation and tip plowing into the surface. This means less complex contact area consideration in the<br />
analysis.<br />
• Calculate spring constant on an infinitely hard surface before hand; do not touch LDX, LDY or PSD knobs on<br />
head while changing samples, for this will change the position of the SLD spot on the cantilever, changing the<br />
true InvOLS (nm/V) value, although the initial one would still be used in the software- ultimately convolving<br />
the true data.<br />
Empirical considerations for the force acquisition:<br />
- collect k & InvOLS before and after expt. One nice approach is to averaging the invols over all the force curves,<br />
average them, then install this number into the parms panel when doing the offline analysis (See section<br />
11.5.X.X). If doing receptor-ligand dissociation experiments on thin layer of a ‘biomaterial’ on an infinitely hard<br />
surface like glass, you could use a relatively 'large' trigger like 30 nm (deflection) so there’s enough linear<br />
regime (and points in that regime) to fit the invols well. The mfp software allows for invols averaging. Small<br />
trigger points (although attractive when functionalizing the tip with chemistry/ biomass), can be bad for this<br />
approach because small triggers also mean only a couple points in this region.<br />
If doing compliance measurements on something large and squishy (like a cell) where you necessarily won't get<br />
a linear region for invols collection; maybe you should do 100 or so before, and 100 or so after; then average all.<br />
If the invols before and after look different, its probably the way the invols was fit. This pill probably help with<br />
more points- jack up the sample rate to 4kHz, but keep the filter down by 1kHz. this is twice the nyquist rate.<br />
when doing the thermal tunes of soft cantilevers in fluid, lift the head far off the surface so the fundamental<br />
resonance isn't dampened (broadened - is that a word??), makign the fit better; you can keep it at the default<br />
resolution value of 5, but collect 50 to 100 of these before fitting.<br />
sources of error in the invols; aside from touching the knobs on the head<br />
-thermal drift- I told you to let it equilibrate for 20 to 30 minutes; like many of the protein or Ab/Ag dissociation<br />
people do is wait several hours to let the system equilibrate. the first few minutes give a great deal of thermal<br />
drift (deflection goes off scale one way or the other (+ or-), as well as some mechanical drift that occurs because<br />
of the kinematic settling.<br />
in exact fitting of the Invols- look at the fit closely; maybe it kind of sucks. An error in the invols measurements<br />
result in a different spring constant calculation by the software.<br />
contamination of reflective surface (backside) of cantilever- maybe some localized RI change could cause the<br />
invols to be different. Bio mass can be sticky- or you poked thru the cell membrane (I don't mean to sound as<br />
accusatory as that sounds)
Ryan’s MFP-3D Procedural Operation ‘Manualette’ Version 10 (v080501; Igor 6.04A); 11.30<br />
silicon nitride is a strange material- most the cantilever fabricators that I know complain about it's<br />
inconsistency. Perhaps the material properties change over the course of an force data set because of stress or<br />
strain issues (material adsorption, or if there is a metal film evaporated onto the lever); this is only speculation<br />
that could be hard to deconvolve.<br />
There are two ways to approach doing cantilever based indentation:<br />
use the Force tab of the Master Panel;<br />
use the indenter panel (from Mode Master); better suited for harder materials because the surface is found<br />
with a low trigger force using the force tab, then indented under a closed loop Z operation using the indenter<br />
panel from mode master.<br />
1) Using the force tab exclusively:<br />
This approach is remarkably similar to a regular force curve. Trigger points can be used as loads; Dwells can be<br />
used as holds or creep studies. The authors issue with it is sometimes the indent (X) vs Force (Y) plots<br />
sometimes don’t look the way one might do to fit an indent curve.<br />
2) Use the Force tab in conjunction with the Indenter Panel: With this approach the force tab can be used to<br />
apply a very small trigger point (i.e., 1 nm deflection trigger), then the cycle defined in the activated<br />
indenter panel applies the load until it reaches its end and completes the Retract curve.<br />
Initially, this is what needs to be done- I refer to chapters in the procedural manualette v10.<br />
-Load tip (Ch3), align SLD on cantilever/ zero PSD (Ch4)<br />
-decide on type of cantilever spring constant and tip shape you plan to do your expt with- this is important<br />
-perform a gentle engage to preserve tip apex. This can be done in AC or Contact mode- much more difficult to<br />
do with stiffer levers<br />
- Confirm the imaging mode is set to Contact<br />
-Find InvOLS and cantilever spring constant on infinitely hard surface – so you know roughly what kind of loads<br />
to apply, and or deflection voltage. (Ch9). Floppy levers can give you some challenging surface charge issues for<br />
k determination.<br />
- set up your expt. Is it in fluid, do you need to image in AC mode first for point and click force curves?<br />
-open the Master Indentation Panel from the mode master (user<br />
settings>Mode Master) also present upon software start up.<br />
You’ll use this panel to set up tip loads in closed loop Z in this panel; more later<br />
-determine what your force spectroscopy parameters are going to be; by this I mean possibly the following:<br />
will dwells, or load holds by the tip be needed?<br />
-what kind of data will you need for your analysis (low triggers, long free air deflections, etc.)?<br />
-Do you need long force distances because the material is so compliant relative to the chosen cantilever<br />
- Do I need to move at every new point (use GO there tab- Ch11)<br />
-Are more or less sampling points needed; how about the bandwidth that the LP filter is clipping? (Ch11- force<br />
tab stuff)<br />
So once you (kind of) know what you want to do, its time to actually see how that sample actually shows what<br />
these parameters might do.
Ryan’s MFP-3D Procedural Operation ‘Manualette’ Version 10 (v080501; Igor 6.04A); 11.31<br />
There are two ways to do the indentation controls: 1) use the AR Indenter Panel; 2) use Master Indentation<br />
Panel accessible thru the ‘Mode Master’ menu dialogue.<br />
1) The AR Indenter Panel:<br />
When the indenter check box is activated , this panel kicks in<br />
the Closed loop Z after the trigger (if there was one) from the<br />
regular force tab trigger is reached.<br />
So here’s how this normally works: you find the surface with a very<br />
gentle trigger force/ point, then the values you have in the AR<br />
Indenter panel kick in.<br />
The indenter mode pull-down menu gives important options<br />
regarding the feed back-<br />
•Load: Feedback of the Deflection voltage (aka constant stress rate<br />
in the vertical indenter community)<br />
•Displacement: Feedback of LVDT sensor voltage<br />
•Indentation: here the LVDT signal from Deflection- gives the<br />
indentation depth (best for those types of expts)<br />
<br />
<br />
<br />
<br />
<br />
<br />
The Units pull down let’s the user choose between Volts,<br />
distance (m) or Force (N)<br />
This lets you choose your loading rate and maximum load in<br />
a dimension you feel comfortable with.<br />
Indenter function pull down- this let’s you choose between a triangle (voltage/ loading) waves, add a dwell<br />
(for creep) or use the AR Function editor for custom routines- very flexible- AC and DC modes.<br />
The rest of the stuff below is for vertical indenter stuff so just disregard.<br />
2) the Master Indentation Panel: this panel combines many individual panel into one for convenience;<br />
found under the Mode Master (User Setting>[Mode Master]; or Crtl+F2).<br />
-click on the Mode Master indentation button upon software startup, it opens up this<br />
large panel. Keep in mind that it also sets parameters used for our vertical indenter- a<br />
much different spring constant and resonant frequencies than cantilever based expts.<br />
Change parameter setvars based on the cantilever stiffness in expt; also, this is the only<br />
way to get to this panel; using the smaller indentation panel is a much scaled down<br />
version.
Ryan’s MFP-3D Procedural Operation ‘Manualette’ Version 10 (v080501; Igor 6.04A); 11.32<br />
The navigator is like the main tab of the master panel; approaching the surface is from the force tab, and this is<br />
where you (typically) define a low trigger force to ‘find the surface without significant movement into it’; then<br />
all the sub tabs from the force tab are present; lastly the indenter panel, described above, is there to define<br />
waves.<br />
Figure 14.6.2: the Indentation Master Panel from the Mode Master gives most indentation, mapping and point and<br />
click features in a single location.
Ryan’s MFP-3D Procedural Operation ‘Manualette’ Version 10 (v080501; Igor 6.04A); 11.33<br />
11.4.3 MFP-3D Function Editor<br />
The MFP-3D software has something known as the function editor, which is very useful for applying custom<br />
made waveforms for force spectroscopy and indentation techniques, but is just as easily extended to other<br />
techniques like the electrical and PFM techniques (not described here because that is another 300 pages of<br />
text the author is not prepared to described at this time).<br />
To open, go to Programming Function Editor. A panel like the one shown in Figure 11.4.3.1 will appear.<br />
The buttons to the right of the panel allow the segments to be copied then pasted to the left or right of the<br />
copied segment.<br />
Insert- will insert a segment to the left or right of the forwardmost (red) segment, having the same constant<br />
values as the red segment its attached to.<br />
Paste- paste a copied segment; will have the same parameters as copied segment<br />
Copy- copy a segment;<br />
Draw- allows free hand segments<br />
Layout- dumps image of function to a Igor Layout (which are awesome).<br />
Any segment in red is the forward most segment and can be manipulated via the buttons or setvars.<br />
Segment Parms subtab-<br />
<strong>St</strong>atic: this is for DC voltages applied to the piezo (stack); the ‘<strong>St</strong>art’ and ‘End’ Piezo voltages, and velocity can<br />
be<br />
Dynamic: this is for AC voltages applied to the piezo (shake);l the amplitude, Frequency and Phase setvars can<br />
e adjusted accordingly. This is useful for oscillating the tip for viscoelastic materials.<br />
Global Parms subtab-<br />
This scales and offsets the signals in the<br />
function generator<br />
The ‘Units’ pull down allows choice between Volts (applied to piezos) or meters ( accurate with calibrated<br />
InvOLS. This can also be useful if using the function editor for applying electrical biases to tip or sample if<br />
doing an electrical technique (not described here).<br />
The ‘Units Scale’ will give the sensitivity (InvOLS displayed if meters selected for Units.<br />
Scale- allows the generated function to be scale be some setvar factor; axes will rescale.<br />
Offset with offset the signal on the Y axis.<br />
Sample Rate is what the data is collected at.<br />
The Sin Amp allows the sinusoidal amplitude to be scaled<br />
The Sine Freq allows the frequency of the Sine signal to be scaled<br />
Sine Phase can offset the phase from 0 to some other user defined value.<br />
The Advanced subtab-<br />
The author is not advanced enough to describe this.
Ryan’s MFP-3D Procedural Operation ‘Manualette’ Version 10 (v080501; Igor 6.04A); 11.34<br />
<br />
<br />
<br />
<br />
Figure 11.4.3.1: The AR function editor allows custom wave forms to be applied to the Z piezos, or tip sample<br />
biases, for advanced force spectroscopy expts.<br />
• Figure 11.4.3.2 shows a simple function that was generated in the Editor- many segments were added and<br />
set to tell the cantilever to deflect to 176 nm, hold for 5 seconds with an oscillation of 10 Hz with 7.06nm peak<br />
to peak amplitude at 90° phase, pull back a bit and hold again for 3 s at 8 Hz with 31.52 nm peak to peak<br />
amplitude 0°, then return to a negative deflection. Note that this was just made up and unlikely to work in<br />
deflection unless some major adhesion force could grab the tip for a 150nm deflection in a real expt.
Ryan’s MFP-3D Procedural Operation ‘Manualette’ Version 10 (v080501; Igor 6.04A); 11.35<br />
Figure 11.4.3.2: a custom wavefom created in the function editor as an example.<br />
11.4.5: Dynamic Force Spectroscopy- this section is not yet complete<br />
Dynamic force spectroscopy acquires force curves while in AC mode. The Z piezo still performs all the same<br />
things as it does in contact mode force spectroscopy (pretty much everything described until this point), but<br />
the shake piezo is also being driven such that the cantilever is oscillating. The interest in Dynamic force<br />
spectroscopy is that attractive and repulsive forces can act on the tip, just as it does in AC mode imaging (see<br />
Section 6.1.4). The author has not sat down to do this yet.<br />
11.4.6: Force Maveric- this section is not yet complete<br />
The Force Maveric is for seriously advanced users allowing custom programmed force curve acquisition<br />
acrobatics to be made- The author does not know how to use it with any profficiency, and probably won’t<br />
learn soon due to lack of interesting materials to learn on.<br />
There is an extensive help section on how to use this, with numbered procedural directions for us. Contact<br />
support@asylumresearch.com if you think the maverick is the way to perform your advanced force<br />
experiments- chances are most can be done with the existing force techniques described above.
Ryan’s MFP-3D Procedural Operation ‘Manualette’ Version 10 (v080501; Igor 6.04A); 11.36<br />
11.5: ANALYSIS:<br />
The MFP-3D software has some force curve analysis built into it. The force display panel has a lot of features,<br />
so the author attempts to tell what he knows about these features.<br />
11.5.1: Loading force data:<br />
To load curves, click on the ‘Review’ button in the Force tab of the Master Panel; this will bring up the<br />
Master Force Panel (Figure 11.5.2A.1) and the The ‘ARPathDialogue’ will appear asking where to load the<br />
curves from (Figure 11.5.1.1) .<br />
If the displayed path is pointing towards the desired files, click ‘That’s It’ button.<br />
If The AR path dialogue doesn’t have the desired path in it-<br />
Click the ‘Browse’ button which will bring up the ‘Path to Load Data’ dialogue.<br />
Click the ‘Browse’ button which will bring up a ‘Browse for Folder’ dialogue.<br />
A<br />
B<br />
Figure 11.5.1.1: Loading force curve files in the MFP-3D software: A) ARPath dialogue inquires location stored data<br />
location; B) Path to Load Data dialogue points to stored data if different than ARPath.<br />
Select the desired folded and click the ‘OK’ button; this will refesh the Path<br />
in the ‘Path to Load Data’ dialogue.<br />
Click the ‘OK’ button; a small loading meter will pop up while Igor is<br />
loading the curves indicating progress and remaining time.<br />
•The last ARPath Dialogue location will be stored until next time a file load request is made.<br />
11.5.2: The Master Force Panel:<br />
This panel has many options built-in for force curve analysis in the MFP-3D software. It consists of nine tabs,<br />
which will be described below. As always, the help menus are pretty good at describing what the functions<br />
do; yet sometimes are not all that procedurally descriptive.
Ryan’s MFP-3D Procedural Operation ‘Manualette’ Version 10 (v080501; Igor 6.04A); 11.37<br />
11.5.2A: The Display subTab:<br />
The Display tab is where curves are loaded, axes are chosen and curves (either individual or multiple) are<br />
listed to be displayed.<br />
Load Curves- Described in Section 11.5.1.<br />
Multiple Axis selection- from this pull down, multiple Y axes can be displayed: up to five Y axes can be<br />
displayed, just as with the Force Channel Panel.<br />
Y axis data to be displayed- data that is listed in black is saved data from the initial experiment- the Force<br />
Channel Panel’s left most Save Column is where this comes from (i.e., green dots in Figure 11.2.6.1).<br />
• Values that are gray (i.e., cannot be selected) are values that were not activated in the Force Channel Panel,<br />
and hence not saved data.<br />
• Clicking the ‘Select 0’ button below this<br />
unselects any previous Y axis selection(s) when<br />
one’s mind has changed- makes it easier than<br />
scrolling through the menu to see what was<br />
selected for Y axis display.<br />
<br />
<br />
X axis to be displayed- this pull down allows<br />
the user to choose what X axis data will be<br />
displayed (i.e., raw, LVDT, indentation,<br />
separation, Force, Deflection Volts, raw volts,<br />
Drive, Drive voltage, time). Each has their own<br />
special place in data representation.<br />
• Indent and Separation X axis plots the Y axis as<br />
LVDT- Deflection; the difference between the<br />
two is that indent plots the event on the right,<br />
while separation plots the event on the left.<br />
<br />
<br />
7<br />
<br />
<br />
<br />
• By clicking the ‘Indent View’ checkbox, the X<br />
axis is switched to ‘Ind’, which automatically<br />
puts the surface on the right side of the plot, as<br />
is done with indenter data.<br />
<br />
Show Notes- this brings up a spreadsheet of<br />
the global variables that has every saved<br />
imaginable saved parameter in it for your<br />
perusal pleasure.<br />
Movie- this allows the user to sit back and<br />
watch Igor scroll through the force curves (at a<br />
user defined rate) so you can concentrate on<br />
looking for interesting curves events, without<br />
incessantly pushing the advance button. See<br />
the end of Section 11.5.2A for more on the<br />
‘Movie’ button.<br />
<br />
Figure 11.5.2A.1: The Display tab of the Master Force Panel.<br />
Curves are loaded, plot axes are chosen and curves displayed<br />
in this tab.
Ryan’s MFP-3D Procedural Operation ‘Manualette’ Version 10 (v080501; Igor 6.04A); 11.38<br />
7Show Sections- this allows the user to display extension, retraction, Dwell, and clamp (depending on the<br />
expt.); For example, if you are only interested in the extension part of the force curve, just have ‘Ext’ selected.<br />
Scrolling buttons- these buttons allow the user to scroll forward or backward through the saved force<br />
curves; either individually or in leaps of 10; or randomly by clicking the ‘Rand’ button- this is nice for statistical<br />
purposes.<br />
The ‘+’ button highlights additional / sequential multiple curves that are displayed in the Force Review Graph.<br />
The ‘−‘ button removes the last curve selected in a multiple non-sequential curve display.<br />
Force Plots- this section is where all the loaded force curves are;<br />
Click on a filename to load the curve into the Force Review Plot; Clicking Shift or Ctrl allows multiple curves<br />
to be selected and displayed.<br />
To select multiple sequential curves,<br />
Highlight the first curve while holding the shift key down (Figure 11.5.2A.2A).<br />
Go to the last desired curve (which will highlight that individual; Figure 11.5.2A.2B).<br />
Go back to the first one (while holding down the shift key) and click on that one again- all the curves<br />
between them will be highlighted and displayed (Figure 11.5.2A.2C).<br />
A<br />
B<br />
C<br />
Figure 11.5.2A.2: Highlighting multiple, consecutive force cures: A) select the first; B)<br />
shift + mouse click on the second; C) shift + re-click on first highlights all between.<br />
Displayed Plots- This shows what force curves are displayed in the ‘Force Review Graph (also highlighted<br />
in Figure 11.5.2A.1).<br />
• Once a curve is selected from the Force Plots section, the curve will be loaded into the Force Review Graph.<br />
Figure 11.5.2A.3 is an example of a force curve on a hard surface with some relative trigger. Notice the<br />
buttons along the top of the Panel- these allow the typical export and save features that many of the data<br />
plots in the MFP-3D software offer.<br />
• A zero or contact point can be manually adjusted by placing the cursor at a point on the force curve and<br />
right mouse clicking- choose on of the offsets and it will adjust it to zero on the X, Y or both axis. In Figure<br />
11.5.2A.3, the cursor was placed on the extension part of the curve, and offset in X&Y; the result is that point is<br />
zeroed (see inset).
Ryan’s MFP-3D Procedural Operation ‘Manualette’ Version 10 (v080501; Igor 6.04A); 11.39<br />
A<br />
Cursor<br />
here<br />
nm<br />
10<br />
B<br />
0<br />
-10<br />
-20<br />
20<br />
0<br />
-20<br />
nm<br />
-4<br />
Figure 11.5.2A.3: Manually offsetting curves in the Force review graph: A) Place mouse cursor at curve location<br />
to offset to zero; right mouse click and select with axis to offset; B) result of X-Y offset on A).<br />
More about the Movie Player-<br />
Clicking the ‘Movie’ Button brings up a small panel (Figure 11.5.2A.4)<br />
• Frame Rate pull down: 0.7 to 2 in 0.1 Hz increments; The author has<br />
experienced frame rates larger than 1.1Hz makes it difficult to stop the force<br />
curve you want to view at because its tough to Interrupt Igor between frames to<br />
actually press the <strong>St</strong>op button.<br />
To Begin, press the Play button; this will begin the process of shuttling<br />
through the loaded force curves.<br />
To stop, press the stop button.<br />
To mark force curves of interest, press the checkmark button; this stores the<br />
selected force curves in memory- accessible via the Data Browser.<br />
Figure 11.5.2A.4: The<br />
force curve review Movie<br />
Player Panel.<br />
• the ‘Clear Marked’ button-<br />
• the ‘Invert Selection’ button- This just swaps which files have been selected or remain unselected. If you<br />
want to select most of the files, it may be easier to just select the few you don't want, and then invert the<br />
selection.<br />
• the ‘Move Selection’ button- this brings up a<br />
‘Question’ dialogue asking for a folder name to be<br />
created that will dump selected curves into this New<br />
folder. This folder is located in the subfolders string
Ryan’s MFP-3D Procedural Operation ‘Manualette’ Version 10 (v080501; Igor 6.04A); 11.40<br />
(see Figure 11.5.2A.5). Note that the extension, retraction and LVDT data will be displayed.<br />
• the ‘Delete Selection’ button- this should delete a force<br />
curve from the memory holding the selected curves.<br />
Note- clicking the help button in the Data Browser brings up a<br />
detailed Igor help .ihf file describing the data browser.<br />
11.5.2B: The Pref subTab:<br />
The author had no experience using this tab because of the<br />
code writing ineptitude he possesses. Let’s move on…<br />
11.5.2C: The Parm subTab-<br />
This tab is useful for looking at force curve file parameters-<br />
Figure 11.5.2A.5: Igor Data Browser<br />
selected force curves from Movie panel in the<br />
marked folder in the SubFolders .<br />
• Under each Title box are pull-down menus that can<br />
display various parameters. Next to each respective<br />
title box, a setvar allows a number of parameters to be<br />
shown.<br />
Figure 11.5.2C.1shows a Parm Panel the author set up<br />
to display desired parameters. Notice in XPT & Thermal,<br />
the setvar is set to zero because none of those<br />
parameters are of importance to the author in this<br />
example. Also notice that are three force curves’<br />
acquisition parameters displayed in the columns on<br />
the right.<br />
• The author will often make an additional Parm Panel,<br />
as in Figure 11.5.2C.1 (notice no upper tabs!), so that<br />
curves can be selected in the Display tab with out<br />
having to shuttle between Parm and Display subtabs<br />
to look at the parameters. This feature is great for<br />
working offline on the curves you are trying to<br />
remember what occurred during the experiment.<br />
Figure 11.5.2C.1: The Parm tab shows stored parameters<br />
values for each open curve.
Ryan’s MFP-3D Procedural Operation ‘Manualette’ Version 10 (v080501; Igor 6.04A); 11.41<br />
Changing Force curve parameters-<br />
The Parm subTab also allows parameter changes to be made to the curves offline- say you didn’t know the<br />
spring constant of the cantilever until the end of the experiment, but the saved data has the default value of<br />
1N/m in it.<br />
Procedure-<br />
With the proper parameter open in the title box, change the setvar value to the proper value- this will up<br />
date the information immediately.<br />
To permanently change the parameter, click the ‘Set Selected’ button towards the bottom of the panel.<br />
To change all the parameters in the set, click the ‘Set All’ button towards the bottom of the panel.<br />
Clicking the ‘Export Table’ button at the bottom of the panel will create a small spreadsheet with all the<br />
parameters set up by the user<br />
A<br />
B<br />
Figure 11.5.2C.2: Changing setvar values in the Parm subTab: A) two consecutive curves with same parameters, but<br />
changing black curve to roughly half the InvOLS value; B) result in slope of contract regime (Inset: same InvOLS<br />
values)<br />
• Figure 11.5.2C.2 shows an example of two consecutively acquired force curves with the same parameters.<br />
Before changing the InvOLS value on the black curve, the slopes are the same (Figure 11.5.2C.2B inset); After<br />
changing the InvOLS to half its initial value, the slope of the contact regime is updated (Figure 11.5.2C.2B).<br />
11.5.2D: The Cursor subTab-<br />
This tab allows the user to install cursor ‘locks’ on the curvethese<br />
are typically used in conjunction with the WLC and<br />
Elastic subtabs, described in Section11.5.2F & 11.5.2H,<br />
respectively. Some of this material will be reiterated in Section<br />
11.5.2F.<br />
To place a ‘lock’ on a curve, place the cursor in the desired<br />
location and click the left mouse button while holding the<br />
shift key down (Figure 11.5.2D.2A). Multiple locks can be<br />
installed per curve (see WLC, section 11.5.2F).<br />
To remove an individual lock, place the cursor on the lock<br />
and left mouse button with Ctrl key.<br />
To remove al locks from a curve or multiple curves, choose<br />
Figure 11.5.2D.1: The Cursor subtab – useful<br />
for installing cursor locks on force curves for<br />
function fitting.
Ryan’s MFP-3D Procedural Operation ‘Manualette’ Version 10 (v080501; Igor 6.04A); 11.42<br />
the specific curve (or all curves) from the ‘Clear Locks From Trace’ pull-down menu; Click ‘Clear Locks From<br />
Trace’ button to activate this process (Figure 11.5.2D.1).<br />
• The ‘Highlight Locks From Trace’ pull-down allows the lock cursors to appear much larger- this is good for all<br />
those old folks out there that have trouble seeing smaller things - like the author does (Figure 11.5.2D.2B).<br />
Figure 11.5.2D.2: Installing locks on a curve using the Cursor subtab: A) Shift + left mouse click at desired<br />
location installs cursor locks; B) Locks highlighted (increases lock size for better viewing).<br />
• When multiple force curves are in memory, and have cursor locks installed, The ‘Limit Locks to Trace’ pulldown<br />
menu allows all the curves selected (if more than one), or selected to be chosen. For example- In Figure<br />
11.5.2D.3, only the locks in curve 0004 (red) can be manipulated, while the ones in 0261 (blue) cannot. There<br />
doesn’t seem to be an apparent visual on the plot itself telling which curve is limited.<br />
Figure 11.5.2D.3: Limiting locks to one curve when multiple curves with installed locks are viewed: Designate<br />
this curve to the ‘Limit to Locks Trace’ pull-down in the Cursor tab.
Ryan’s MFP-3D Procedural Operation ‘Manualette’ Version 10 (v080501; Igor 6.04A); 11.43<br />
11.5.2E: The Modify subTab-<br />
This is a very useful subtab, and there is a lot<br />
going on here- points in curves can be zeroed in<br />
X,Y or both; virtual deflection (or other portion<br />
of curve) can be subtracted out; force curves<br />
saved to memory in an experiment can be saved<br />
to .ibws for each curve (if that wasn’t done<br />
initially).<br />
The tab is broken down into three general<br />
columns: under the left title box is the ‘last’<br />
curve selected; the middle ‘Selected’ curve is or<br />
Figure 11.5.2E.1: Modify subtab.<br />
are the curve(s) selected- operations will be<br />
performed on multiple curves selected; the last (right) column will perform operations on all the curves in<br />
memory- this is nice for batch stuff.<br />
Y & X (Raw) offsets:<br />
There are non manual ways to offset the force curves,<br />
opposed to those described in Figure 11.5.2A.3 above:<br />
Y offset: this operation averages the last 10 points of the free<br />
air, and makes that zero. Typically, if there is a small<br />
attractive ‘jump to contact’ in the extension cycle of the<br />
curve, the zero point will be just to the right of it.<br />
• Figure 11.5.2.E.2 shows a before and after (inset) of Y offset<br />
of simple force curve.<br />
-110<br />
-120<br />
nm<br />
-130<br />
10<br />
0<br />
-10<br />
-3.2<br />
Clicking the ‘Offset all Y’ button will offset all the curves<br />
that are loaded in the memory.<br />
nm<br />
6<br />
4<br />
2<br />
-140<br />
-3.2<br />
-3.4<br />
Figure 11.5.2E.2: Offsetting the Y axis in force<br />
curves using Modify tab: Click the ‘Y Offset’<br />
button, which will offset the curve to zero on<br />
the Y axis (inset).<br />
0<br />
-2<br />
-4<br />
-6<br />
0<br />
-10<br />
nm<br />
Figure 11.5.2E.3: Offsetting the X axis in<br />
force curves using Modify tab: Click the<br />
‘Raw Offset’ button, which will offset the<br />
curve to zero on the X axis.<br />
Raw (X) Offset: this operation defines the surface as zero distance,<br />
and defines the surface as when the deflection of the lever is the<br />
same as the free air.<br />
Click the ‘Raw (X) Offset’ button.<br />
• Figure 11.5.2E.3 depicts this with some author drawn lines to<br />
guide the eye. At the point of intersection, the deflection would<br />
equal the deflection of the free air (i.e., no positive or negative<br />
deflection in the lever).
Ryan’s MFP-3D Procedural Operation ‘Manualette’ Version 10 (v080501; Igor 6.04A); 11.44<br />
Line subtraction-<br />
Let’s say the virtual deflection (see Section 9.1) was not calibrated and all the curves in a data set have a little<br />
bit of slope in the free air portion- this can affect the accuracy of where the zero point of the curve is, and<br />
ultimately the magnitude of the force/ deflection/ etc. value calculated.<br />
Well this can be corrected in the Modify tab:<br />
Place the Igor cursors on the extreme ends of the linear region, preferably the extension part of the curve.<br />
Confirm that the Modify Ext. radio button is activated (Figure 11.5.2E.1).<br />
Click the ‘Line Subtraction’ button in the Modify subTab. The curve will become parallel to the X axis<br />
(Figure 11.5.2E.4).<br />
• These modifications can be saved individually, or in bulk, depending on what operation was executed.<br />
Click the ‘Save Sel.’ button to save this change to the individual selected force curve. It will overwrite the<br />
raw data.<br />
• Figure 11.5.2E.4 shows an example of a force curve collected on a MFP plus in the old Igor 5 software (i.e.,<br />
before the virtual deflection calibration was featured in the software). Just the Extension part of the curve is<br />
shown.<br />
nN<br />
1.0<br />
AFTER line subtraction<br />
0.5<br />
0.0<br />
0.0<br />
-0.2<br />
-0.4<br />
-0.6<br />
-0.8<br />
-1.0<br />
µm<br />
Igor cursors<br />
Figure 11.5.2E.4: Example of using line subtracting to remove slight virtual deflection from a force<br />
curve (acquired on older MFP-3D/ Plus software).<br />
Line subtraction doesn’t work if Y axis is on Force- must be on deflection.
Ryan’s MFP-3D Procedural Operation ‘Manualette’ Version 10 (v080501; Igor 6.04A); 11.45<br />
Saving curves from memory to ibw’s: Sometimes an Igor experiment is saved, but the force curves were not<br />
saved to disk, just to memory. When opening up the experiment, the force curves should be loaded in<br />
memory, as seen in the lower box in the Display subTab.<br />
To Save the curves to individual .ibw’s, click the ‘Save All’ button, which will<br />
convert all the curves saved in memory to individual .ibw’s (igor binary waves),<br />
dumping them into what ever folder the initial experiment was saved in.<br />
To change folder directories, click the ‘Save As All’ button, which will bring<br />
up the AR Save Path dialogue awaiting the user to indicate a path to the desired folder.<br />
If the curves weren’t saved to memory in the experiment, there is little chance of recovery, seemingly.<br />
11.5.2F: The WLC subtab-<br />
This tab is where Worm Like Chain fitting occurs, in conjunction with locks placed on the curves described in<br />
the Cursor subtab (section 11.5.2D). This is generally used on force curves that show ‘saw tooth’ patternstypically<br />
proteins whose domains are being pulled apart. Each one of these saw tooth dissociation events are<br />
commonly termed ‘hitches’. There are two models (i.e., single or multi chain models) that can be fit,<br />
depending on if the sequential hitches are influenced by the preceding hitch, or not.<br />
• Another description of this on the FAQ portion of the AR website:<br />
http://www.asylumresearch.com/Support/FAQ3D.shtml<br />
Locks need to be installing on the hitches on the Force vs. Sep plot….<br />
Load the force plot(s) you what to fit. Accurate InvOLS and k are important, or the Force vs. Sep plot (see<br />
next step) will be compromised.<br />
•The demonstrative example in Figure 11.3.2F1 shows a titin construct (data courtesy Jason Cleveland (AR)<br />
and Jan Hoh (JHU)) with some sawtooth dissociation action (k=42.51 pN/nm; InvOLS=20.47nm/V). NOTE: only<br />
the interesting part of the retract curve of the deflection vs. distance plot for fitting the WLC is shown (Figure<br />
11.5.2F2).<br />
1.5nN<br />
A<br />
1.5nN<br />
B<br />
Force (nN)<br />
1.0<br />
C8_0229Force_Ext<br />
C8_0229Force_Ret<br />
Force (nN)<br />
1.0<br />
C8_0229Force_Ext<br />
C8_0229Force_Ret<br />
0.5<br />
0.5<br />
0.0<br />
0.0<br />
0<br />
-100<br />
-200<br />
-300nm<br />
0 50 100 150 200 250 300nm<br />
Distance (nm)<br />
Distance (nm)<br />
Figure 11.5.2F1: A) Force vs. distance; B) plotted as Force vs. Separation- contact regime is equal to unity.
Ryan’s MFP-3D Procedural Operation ‘Manualette’ Version 10 (v080501; Igor 6.04A); 11.46<br />
In the Display subtab, plot as Force vs. Sep (Sep is short for tip - sample separation). This<br />
should make the contact regime of the curve have a slope of unity.<br />
Offset X&Y to zero, either manually (via mouse cursor on curve, see Section 11.5.2A), or use<br />
the offset Y and Raw buttons (Section 11.3.2E) in the Modify subTab. This is an important step.<br />
In the Cursor subTab, select the ‘Ret.’ (retract) checkbox.<br />
On the force plot, place the locks on the graph to define the stretching regions (Shift + left mouse click,<br />
Section 11.5.2D) - these are the lock points described in Section 11.3.2D: the error region of the fitting<br />
function must be defined, so pick one point where the polymer ruptures its attachment to the tip, and pick<br />
the other point at the lowest extension as the data looks like it will be fit. As the locks are defining the hitches,<br />
a fitting curve will appear, although not correct until the ‘Fit’ button is executed (Figure 11.5.2F.2A).<br />
• Multiple stretching events can be fit in a single force plot: pick two ‘locks’ (cursors) to define each stretching<br />
event (the software calls polymer stretching events hitches).<br />
A<br />
B<br />
Figure 11.5.2F2: A) Installing locks on sawtooth pattern for WLC fit: as locks are defined, fit line appears and<br />
is updated; B) all locks installed, but WLC not fit.<br />
Go to the WLC tab. There is a lot going on here- the author will try to explain- the software help menus are<br />
also very useful here:<br />
Multi Chain model/ Single Chain WLC models:<br />
To determine whether the multiple hitches in the force plot to be fit via either single chain or multi chain,<br />
consider the following: Is the observed response due to one chain with domains or loops (Single Chain); or is<br />
each hitch the result of stretching a separate chain (Multi Chain)?<br />
If you think you have a single chain, then you want to unselect the Multi Chain check box (upper left<br />
corner, Figure 11.5.2F.2). Single Chain is when the latter hitches are influenced on the preceding hitches. In<br />
this example, Single chain is being used.
Ryan’s MFP-3D Procedural Operation ‘Manualette’ Version 10 (v080501; Igor 6.04A); 11.47<br />
If you think that each hitch is from a separate chain, then select Multi Chain checkbox. Multi Chain is<br />
when each hitch is not dependent on the preceding hitch.<br />
Single Persistence length checkbox- this should be checked if (you think) the domains of the same size are<br />
being pulled apart. Uncheck it if they are not.<br />
Temperature- can influence the calculation: this<br />
information can be obtained at various places- the Parm<br />
subTab panel; or if using a heater accessory from the<br />
environmental controller (heater) panel.<br />
<br />
<br />
<br />
Show Individual <strong>St</strong>retches checkbox- this will put a<br />
dotted elastic response fit line on hitch (see Figure<br />
11.5.2F4).<br />
Tag <strong>St</strong>retches checkbox: this will label the contour<br />
length (L C ) on each fit (see Figure 11.5.2F4).<br />
Hold and Constrain fit parameters checkboxes:<br />
• Hold means that the fitting function will hold that<br />
parameter constant and not fit it.<br />
• Constrain means that it will keep the fit parameter<br />
between the upper and lower limits (the limit controls<br />
show up after you constrain one of the parameters.<br />
<br />
<br />
<br />
<br />
<br />
The Pers is the ‘Persistence Length’; it is basically a<br />
measure of the polymer's stiffness. Lower persistence<br />
lengths have much more non-linear responses.<br />
Figure 11.5.2F3: WLC tab.<br />
The extension ratio is the fraction of the contour<br />
length that the polymer chain is extended.<br />
The fit parameter is the extension ratio where the polymer chain ruptures its attachment to the tip (max<br />
extension ratio). So you can get the contour length of the chain from the rupture length divided by the max<br />
extension ratio.<br />
‘Fit’ button- this executes the fit calculation command once the fit parameters have been defined.<br />
You can also tweak your fit with the Max Iterations and Fit Tolerance controls. The author doesn’t have<br />
enough experience fitting WLC to offer additional insight into these fitting features.
Ryan’s MFP-3D Procedural Operation ‘Manualette’ Version 10 (v080501; Igor 6.04A); 11.48<br />
400<br />
200<br />
C8_0229Force_Ret<br />
C8_0229Force_Ret#1<br />
C8_0229Fit_Ret<br />
Hitch0<br />
Hitch1<br />
Hitch2<br />
Hitch3<br />
Hitch4<br />
Hitch5<br />
Hitch6<br />
Figure 11.5.2F4: Fit WLC model on<br />
Titin construct sawtooth dissociation<br />
force curve. Single Pers was used.<br />
pN<br />
0<br />
-200<br />
-400<br />
L c<br />
=161.9 nm L c<br />
=218.7 nm<br />
L c<br />
=273.5 nm L c<br />
=318.2 nm<br />
L c<br />
=190.5 nm<br />
L c<br />
=246.1 nm L c<br />
=301.6 nm<br />
100<br />
150<br />
200<br />
nm<br />
250<br />
300<br />
•Once the fit is complete, it will have labels and fit functions similar to Figure 11.5.2F4. the values of the hitch<br />
columns can be shuttled using the arrow buttons in the WLC tab (red circle Figure 11.5.2F3.<br />
11.5.2G: The Analyze subtab-<br />
This panel can also do a lot- and will be difficult for the author to describe in full- or even 1/20 th of that.<br />
Simple batch adhesion (dissociation force curves) calculations: this calculate the adhesion between the<br />
largest minima (largest dissociation event) and the average of the last 5 points of the free air (maixima)- this is<br />
useful for single event force curves (classis FCs on infinitely hard surfaces); but for multiple dissociation<br />
events, or events other than the tip- substrate interaction that may be considered non- specific, its likely to<br />
not be all that useful.<br />
Load the force curves.<br />
Offset X&Y in the Modify sub Tab (see Section 11.5.2E.1).<br />
InvOLS averaging:<br />
Averaging the InvOLS can be important because it can be a little different every time. Since a lot of force<br />
experiments depend on statistical occurrences, might as well have a statistical average or some other value<br />
for this as well.<br />
Procedure-<br />
In the Master Force Panel, load the curves that you want to average the DC InvOLS on. Take note of the<br />
suffices of these curves because they will have to be designated in the Analysis tab<br />
Confirm that only the ‘Ext’ checkbox is activated, indicating that you only want to look at the extension<br />
part of the force curve are calculated (Figure 11.5.2G.1B).<br />
Plot the Force curves as LVDT (X) versus Deflection Volts- typically that is what is done to<br />
calibrate the spring constant since the force constant of the cantilever isn’t known.<br />
In the Modify subtab, click the ‘Y offset’ and ‘Raw (X) Offset’ buttons to zero the curves<br />
(see Section 11.5.2E.1).
Ryan’s MFP-3D Procedural Operation ‘Manualette’ Version 10 (v080501; Igor 6.04A); 11.49<br />
Install the Igor Crtl + I cursors on the contact regime part of the Extension curve. Take note of the Y axis<br />
values- these will also be used in the Analysis tab to designate the ‘Deflection Range’ during the averaging<br />
(Figure 11.5.2G.1A).<br />
A<br />
B<br />
Figure 11.5.2G.1: Averaging InvOLS to display as histogram distribution: A) determine Deflection range on extension<br />
part of one of the curves to be averaged; B) enter these range values into the deflection range and Offset setvars in the<br />
Analysis tab of the Master Force Panel. Set up Analysis tab similar to above for averaging InvOLS.<br />
Go to the Analysis subtab of the Master Force Channel.<br />
Under the ‘Calculate’ pull-down menu, select DC InvOLS (i.e., InvOLS in contact mode, select AC InvOLS if<br />
you are doing some Dynamic Force Spectroscopy).<br />
Under the ‘X Parm’ pull-down, select ‘InvOLS’ (InvOLS is what you want the Histogram to have on its X axis).<br />
(in older software) Enter the appropriate suffix range in the ‘<strong>St</strong>art’ and ‘<strong>St</strong>op’ Indices.<br />
Under the ‘Max Deflection’ setvar, enter the value of the Igor cursor closer to the trigger point (Figure<br />
11.5.2G.1A).<br />
Under the ‘Min Deflection’ setvar, enter the value of the other Igor cursor (Figure 11.5.2G.1A).<br />
Check the ‘Histogram’ Check box- this<br />
will calculate the histogram.<br />
Click the ‘Do It’ button- a histogram<br />
should be generated that will show a<br />
distribution of InvOLS values (Figure<br />
11.5.2G.2).<br />
• In Figure 11.5.2G2, a Gaussian fit was<br />
applied, although other fit types are<br />
available in the ‘Fit Type’ pull-down. Notice<br />
the Mean and Width of the histogram fit is<br />
displayed, and that the Bin size can be<br />
changed using the slider bar.<br />
Figure 11.5.2G.2: Histogram of InvOLS values. The fit type pull down<br />
allows different fitting functions to be applied- for an example, a<br />
Gaussian fit was applied (not that the histogram looks Gaussian).
Ryan’s MFP-3D Procedural Operation ‘Manualette’ Version 10 (v080501; Igor 6.04A); 11.50<br />
Force Map Analysis:<br />
Follow this protocol to create force maps for collected/ stored data- this works with the AR force map, or Chad<br />
Ray’s Force Volume program.<br />
Click the ‘Review’ button in the Force tab of the Master Panel.<br />
A dialogue will appear asking where to retrieve the data from-<br />
• After a moment, the curves will load, and each individual file will be visible in the Force Plot List of the<br />
Display tab in the Master Force Panel.<br />
Go to the Modify subtab, click the ‘Offset all Y’ and ‘Offset all Raw’ buttons- to ‘zero’ the curves about zero.<br />
To produce a force map, go to the Analyze subtab. Notice at the bottom of the panel, an area called ‘Force<br />
Map’ (Figure 11.5.2G.3).<br />
A<br />
B<br />
C<br />
Figure 11.5.2G.3: Force Map analysis &<br />
construction is found in the Analyze tab of the<br />
Master Force Panel.<br />
In the Input pull – down menu, confirm the data is from the folder just loaded containing the force curves<br />
to be analyzed for the Force Map (Figure 11.5.2G.3B).<br />
In the function pull-down, choose what kind of data to be analyzed (see 11.5.2G.3B).<br />
Choose what portion of the force curve to be analyzed form the section pull-down menu (i.e., for<br />
FMapCalcIndent, extension should be selected; if looking at FMapAdhesion, Retract should be chosen<br />
(11.5.2G.3C)).<br />
Choose what dimension to display the X & Y data in from the X pull-down menus.<br />
• The author finds it easier to leave the output image name as what the software calls it. You can easily change<br />
this name in the List panel (see Section 12.1.2) after the pixilated Force Map has been created.
Ryan’s MFP-3D Procedural Operation ‘Manualette’ Version 10 (v080501; Igor 6.04A); 11.51<br />
• Figure 11.5.2G.4 shows an example of a Force Map using chemical force microscopy over a μicroContact<br />
printed pattern of a carboxylic acid terminated thiolate and methyl terminated thiolate, with the carboxylic<br />
acid terminated thiolate on a Au coated tip in pH 4.0 buffer (standard pH meter buffer, with out indicator<br />
color). The Force Map calculated with the MFP-3D analysis Panel is seen in Figure 11.5.2G.4A; the LFM image<br />
of the same area immediately after the force Map was acquired can be seen in Figure 11.5.2G.4B, and clearly<br />
correlates the areas of acid hydrophilic (higher force pull off forces in FMap and dark in LFM image) and the<br />
hydrophobic areas (lower forces in FMap and brighter colors in LFM image).<br />
• See Section 12.4.2 to insert the Force Map layer into an image channel display.<br />
-COOH<br />
40<br />
30<br />
1000<br />
30<br />
10<br />
20<br />
10<br />
800<br />
600<br />
400<br />
200<br />
pN<br />
20<br />
10<br />
5<br />
0<br />
-5<br />
mV<br />
0<br />
0<br />
10<br />
20<br />
µm<br />
30<br />
-CH 3<br />
0<br />
0<br />
10<br />
20<br />
µm<br />
30<br />
40<br />
-10<br />
Figure 11.5.2G.4: A) Force Map from a chemical force microscope experiment in which carboxylic acid thiolates (brighter<br />
pixels) and methyl terminated thiolates were pattern (via µCP) with a carboxylic acid thiolate functionalized Au coated<br />
SiNx tip; B) subsequent LFM image of pattern utilizing same scan area. See Figure 13.13 for an example of the Force<br />
Map painted onto the LFM image using ARgyle.<br />
• Figure 11.5.2G.5 is an example of a Force Map on a polymeric particle. Here, two separate Force maps were<br />
calculated using height, and adhesion. In C), since the the tip wasn’t functionalized with anything, only edge<br />
effects are seen in the adhesion map (dark perimeter ring). The particle did not deform under the load of the<br />
~2N/m cantilever with the trigger values used for the acquisition, the calculated indent force map didn’t show<br />
very exciting data.
Ryan’s MFP-3D Procedural Operation ‘Manualette’ Version 10 (v080501; Igor 6.04A); 11.52<br />
A<br />
B<br />
-1.5<br />
-2.0<br />
C<br />
154<br />
153<br />
-2.5<br />
µm<br />
152<br />
nN<br />
-3.0<br />
151<br />
-3.5<br />
150<br />
149<br />
0.0<br />
0.5<br />
1.0<br />
µm<br />
1.5<br />
0.0<br />
0.5<br />
1.0<br />
µm<br />
1.5<br />
Figure 11.5.2G.5: Force map of a molded polymeric particle:<br />
A) force map parameter settings for B); B) force map<br />
calculated Height using extension portion of the curves; C)<br />
Force Map calculated Adhesion using retract portion of the<br />
curves; D) Z sensors height image rendered in 3D (ARgyle;<br />
Chapter 13).<br />
D<br />
11.5.2H: The Spot subtab-<br />
The Spot subtab links force curves (or other<br />
SPM spectroscopy curves) acquired at user<br />
defined locations on a previously acquired<br />
image via the ‘Point and Click’ feature from the<br />
‘Go There’ subtab (see Section 11.2.4).<br />
<br />
<br />
Features of the subtab-<br />
Force plots loaded into memory.<br />
Images loaded into memory<br />
Link Force Spots checkbox: check to have<br />
locations of force curves to be displayed on<br />
<br />
image.<br />
Auto Make Force Graph checkbox:<br />
<br />
Markers pull down menu: lets the user label<br />
full filename, or just curve suffices under<br />
location markers.<br />
‘Color by Display’ checkbox: this<br />
correlates the color of the curve in the Force<br />
Review graph the same on the markers on the<br />
image. If not checked, it just is the color designated in the ‘Spot Color’ pull down.<br />
Figure 11.3.2H1: Spot subTab links point and click SPM<br />
spectroscopy curves to the image.<br />
The author’s example is with some data courtesy of Dr. Schlenoff (FSU Chemistry) collected by Keith Jones.<br />
It’s a cardiac cell collected with AC mode in fluid, then subsequent force curves were collected to look at the
Ryan’s MFP-3D Procedural Operation ‘Manualette’ Version 10 (v080501; Igor 6.04A); 11.53<br />
compliance of the different areas. The files and parameters in Figure 11.3.2H1 at different user defined<br />
locations were used for Figure 11.3.2H2.<br />
Load the images (see Section 12.1).<br />
Load the ‘Point and Click’ Force curves that correlate to the image(s).<br />
Highlight the image taken just before the force curves were acquired.<br />
Check the ‘Link Spots’ checkbox.<br />
Check the ‘Auto Make Force Plot’ checkbox<br />
Select the force curves desired to be linked on image. Zero them in X&Y if needed (Figure 11.3.2H2B). this<br />
will put the spots at the XY locations on the images.<br />
• Clicking the ‘Color by display’ checkbox will make the markers on the images the same color as the force<br />
curves in the Force Review Graph. Not essential, but nice for presentation.<br />
A<br />
B<br />
Figure 11.3.2H2: Plotting the locations ‘point and click’ force curves obtained at user defined locations in offline analysis:<br />
A) the stored AC mode image with force curve location labels; B) the respective force curves.
Ryan’s MFP-3D Procedural Operation ‘Manualette’ Version 10 (v080501; Igor 6.04A); 11.54<br />
What if you can’t remember which image belongs to the force curve(s)??? that happens.<br />
If the image is the same XY area and same offsets, it will put the markers up without a problem. If the<br />
image is the same size, but different offsets, OR if the images are different sizes, then it’s pretty easy<br />
to spot that it’s the incorrect image: Often the image will be rescale (unfavorably) and something like<br />
Figure 11.5.2H3 will occur. This rescaling issue will also occur if the image is a ‘Partial Save’.<br />
Figure 11.5.2H3: offscale images occur<br />
when attempting to correlate point and click<br />
force curves with images that they don’t<br />
belong to.
Ryan’s MFP-3D Procedural Operation ‘Manualette’ Version 10 (v080501; Igor 6.04A); 11.55<br />
11.5.2I: The Elastic subtab-<br />
This section is not yet complete<br />
This section is currently under construction and will be completed by the time the official version 10<br />
operational manualette is complete. The author is gearing up to familiarize himself with<br />
nanoindentation instrumentation and the literature, and plans to complete this section in mid fall<br />
2008.<br />
This is where Hertzian mechanics and Oliver-Pharr<br />
type indentation data are fit.<br />
For now, the author grabbed this from a support<br />
email from one of the inmates:<br />
To fit with the Hertz model.<br />
Load up your force curve<br />
Click on indent View checkbox on the Display<br />
SubTab of the force review panel.<br />
This is mostly going through all the force plots in<br />
memory and offset them in X and Y so that the 0,0<br />
(hopefully) means something.<br />
Figure 15.2I.1: Elastic subtab.<br />
Select the force curve to be fit.<br />
Hold down shift and click at the beginning and end of the region you want to fit.<br />
This can be pretty slow if you have a large number of force plots (~1k). I still need to look into speeding up<br />
that part.<br />
Go to the elastic tab (I normally make the elastic panel from the button in the lower left corner, so I don't<br />
have to constantly jump back and forth on the tabs).<br />
Go to the hertz sub tab.<br />
Click on ‘Get F vs. H scaling law’ button<br />
This sets the tip geometry parameter and the f-h power m<br />
The f-h power m is the slope of the log(force) vs Log(indentation). It should be between 1 and 2, and tells us<br />
about the geometry of the tip (if the hertz model applies). If it is out of range of 1 to 2, or is telling you a<br />
geometry that is clearly not true, you need to ask if your data can be described by the hertz model.<br />
Make sure the tip parameter (1/2 angle for cones, radius for sphere), is correct.<br />
Make sure the fit describes the data.<br />
Set the indenter material<br />
if your indenter material is not listed, then enter it's young s modulus and Poisson ratio in V2 and E2.<br />
Enter the sample's estimated Poisson ratio for V1. If unknown, enter 0.33<br />
E1 is your samples Young's modules.
Ryan’s MFP-3D Procedural Operation ‘Manualette’ Version 10 (v080501; Igor 6.04A); 11.56<br />
30nN<br />
Force (nN)<br />
20<br />
10<br />
0<br />
-400nm -300 -200 -100 0 100 200<br />
indentation(nm)<br />
30nN<br />
Force (nN)<br />
20<br />
10<br />
0<br />
-150<br />
-100<br />
-50<br />
0<br />
50<br />
indentation(nm)<br />
100<br />
150<br />
200nm<br />
To fit via Oliver-Pharr:<br />
To be completed in mid October 2008<br />
Figure 11.5.2I.X: Elastic sub tab with Oliver-Pharr fitting:
Ryan’s MFP-3D Procedural Operation ‘Manualette’ Version 10 (v080501; Igor 6.04A); 11.57<br />
11.6: Miscellaneous items:<br />
11.6.1: Crosslinking/ tip functionalization/ sample prep:<br />
this is incomplete at this but will be complete at the final version; thhe author includes it for novices.<br />
Many force adhesion or receptor-ligand experiments call for some functionalization of the tip. There is a great<br />
deal of chemistry that can be done at the end of a tip, although careful characterization should be performed<br />
on bulk surfaces before making any claims in publications.<br />
That being said, there have been numerous reports of tip functionalization- many of which come from the<br />
AFM literature, based largely in part from the self-assembly and ELISA chemical linking literature. There are<br />
many companies that provide molecules, proteins and antibodies of interest, websites listed below. Typically<br />
molecular concentrations are in the millimolar (mM) range, with incubation times ranging from 10 mins to<br />
hours.<br />
Some nice tutorials on sample prep and tip cleaning prior to functionalization:<br />
http://www.jpk.com/tutorial/afm_sample_preparation1.htm<br />
http://www.cma.fcen.uba.ar/files/prepmuestras.pdf<br />
http://www.chem.duke.edu/~boris/research/force_spectroscopy/sample_preparation.htm
Ryan’s MFP-3D Procedural Operation ‘Manualette’ Version 10 (v080501; Igor 6.04A); 11.58<br />
Vezenov, et al has a nice review about Chemical Force Spectroscopy (CFM), including a useful table describing<br />
tip functionalization – see Table 1 (p 319): Vezenov, D., Noy, A., Ashby, P., J. Adhesion Sci Technology 2005 19<br />
(3-5) p313 – 364.<br />
Functionalizing tips-<br />
Tips generally have to be cleaned out of the box- many do this by gentle rinsing with a variety of solvents<br />
ranging in polarity, or with a UVO or Ozone cleaner, or both. <strong>St</strong>rong acid solutions like Piranha (be careful- the<br />
literature is not kidding with the obligatory statement describing violent reaction with organic material- the<br />
author has experienced this first hand, Read up on the handling and use of piranha solutions before ever<br />
using it). Anyway , piranha can make cantilevers brittle, and cause the reflective backside coating to flake off.<br />
The author has placed the tips to be functionalized either in a<br />
small vial cap when using organic solvents (put probe in vial cap<br />
already filled with functionalization solution, and then place a<br />
larger vessel over it to prevent immediate evaporation- this<br />
works well for attaching a thiol to a gold coated probe; typically<br />
in 100% EtOH, commonly incubated overnight. The probes are<br />
held with a firm pair of tweezers (not fine pointed tweezers<br />
because they often scissor, launching the probe), and run a<br />
gentle stream of the solvent down the tweezers- avoid direct<br />
solvent stream on probe.<br />
If using aqueous solvents, the author has found that putting the<br />
probe onto the underside of a small weigh boat with a thin layer<br />
of PDMS works great (this is a similar material that is used in a tip<br />
box- it’s compliant and the probe substrate sticks to it very well).<br />
Drops of aqueous solvent (containing the molecular linker<br />
concentration of interest) create large contact angles, and generally stay put on the cantilever area of the<br />
probe. After incubation is complete, pick up entire weigh boat, and gently rinse- have solvent stream hit<br />
somewhere on the weigh boat so the probe doesn’t take a direct hit.<br />
To dry, the author generally wicks the bulk of the fluid away from the probe with the corner of a ChemWipe,<br />
then gently dries in a weak stream of N2.<br />
Functionalizing substrates-<br />
The chemistry can be similar here, but the author urges careful consideration on how to attach substrate into<br />
the AFM (glass slide, fluid cell, etc.). considerations involve when to secure the substrate- epoxies and<br />
superglues (cyanoacrylates) have VOCs in them, and can contaminate the surface during curing. Also, if the<br />
substrate has to stay wet after the chemistry is complete, this will also be an issue.<br />
Surprisingly, dow corning vacuum grease works very well, and doesn’t contaminate that many aqueous<br />
systems (see Figure 6.2.9).<br />
Some places to get chemical linkers, and some useful tutorials as well:<br />
•Pierce biotechnology:<br />
http://www.piercenet.com/Objects/View.cfm?Type=Page&ID=FE7F690D-58AE-4342-AE85-BA94DCA642F8<br />
•high quality bi functional PEGs: Pricey but worth it; also do custom stuff. My wife says they're great. they are<br />
an alternative to the now debunk Nektar.<br />
http://www.laysanbio.com/index.php?src=gendocs&link=Products_new&category=Main
Ryan’s MFP-3D Procedural Operation ‘Manualette’ Version 10 (v080501; Igor 6.04A); 11.59<br />
• polysciences have cheaper PEGS, but I’ve been told they are an unreliable company unless you have an<br />
established relationship with them ( I am told)<br />
• exoitic thiols company –<br />
Prochimia from poland<br />
http://www.prochimia.com/products.php<br />
Assemblon from Washinton state, USA.<br />
http://assemblon.net/<br />
http://www.quantabiodesign.com/
Ryan’s MFP-3D Procedural Operation ‘Manualette’ Version 10 (v080501; Igor 6.04A); 12.1<br />
This Section discusses how to perform basic image<br />
analysis on stored MFP-3D image (.ibw) files. It is<br />
presented based on how the author goes about<br />
processing image files. Keep in mind, there are not<br />
necessarily hard and fast rules / sequences<br />
regarding image processing, it depends on the data,<br />
and can be a trial and error process. For this reason,<br />
the processing techniques are broken into sections,<br />
and some examples given.<br />
12.1: Opening <strong>St</strong>ored images:<br />
Click on the ‘Browse’ button on the Main tab of<br />
the Master panel; the ARPath dialogue will appear<br />
asking where to retrieve the file from (Figure 12.1A).<br />
▪ During image loading, a progress meter will<br />
appear (Figure 12.1B), and concomitant smart -<br />
mouthed comment (Figure 12.1C).<br />
• Once the images have loaded, the Browse window<br />
(containing thumbnails of the images/ data; Figure<br />
12.1.1), and the List Panel (contains just the files<br />
names; Figure 12.1.2) will appear.<br />
Section Topic Page<br />
12.1 Opening <strong>St</strong>ored Images 12.1<br />
12.1.1 Browse Panel 12.2<br />
12.1.2 List Panel 12.3<br />
12.1.3 Display Window 12.3<br />
12.1.4 AR thumbnail Viewer 12.5<br />
12.2 The Modify Panel 12.5<br />
12.2.1 Flatten tab 12.6<br />
12.2.2 Planefit tab 12.7<br />
12.2.3 Mask tab 12.8<br />
12.2.4 Erase tab 12.12<br />
12.2.5 Filter tab 12.13<br />
12.2.6 FFT tab 12.14<br />
12.2.7 History tab 12.15<br />
12.3 Saving Modifications 12.15<br />
12.4 Misc. Operations 12.15<br />
12.4.1 Extracting Layers 12.15<br />
12.4.2 Inserting Layers 12.16<br />
12.4.3 Subtracting Images 12.17<br />
12.4.4 Rotating Images 12.18<br />
12.4.5 Cropping Images 12.19<br />
12.5 The Analyze Panel 12.20<br />
12.5.1 Roughness tab 12.20<br />
12.5.2 Section (Analysis) tab 12.22<br />
12.5.3 Histogram tab 12.26<br />
12.6 Particle Analysis 12.27<br />
A<br />
B<br />
C<br />
Figure 12.1: Opening stored images: A) Select where stored files are with the ARPathDialogue; B) the progress meter counts<br />
down the file loading time; C) concomitant silly message when loading large folders of data.
Ryan’s MFP-3D Procedural Operation ‘Manualette’ Version 10 (v080501; Igor 6.04A); 12.2<br />
12.1.1: The Browse Panel-<br />
• The Browse panel displays the data as thumbnails (Figure 12.1.1). This window can be resized to be grabbing<br />
the corner and dragging to desired size- the author finds this helps with he screen real estate.<br />
3<br />
1 2<br />
6<br />
4<br />
5<br />
Figure 12.1.1: The Browse Panel allows images to be organized as thumbnails and opened with a mouse click.<br />
Specific data channels (i.e., Height, Phase, etc.) can be selected in the ‘Show Data Type’. This is convenient<br />
if looking for specific image data in a folder containing many images- an example would be to choose<br />
NapPhase if a MFM image was being searched for- among many non NAP images.<br />
The Trace or Retrace data can be displayed using the ‘Which Image’ pull-down menu.<br />
Thumbnail display array can be selected using the Vertical and Horizontal setvar values.<br />
The ‘NextPage’ button advances to the next page of thumbnails, much like using the Igor scroll<br />
bar on the right side of Browse panel<br />
The Layout button will place a snap shot of the Browse panel and dump it into an MFP-3D layout window<br />
(see Sections 7.7E; 14.13).<br />
The ‘Show Force Data’ pull-down menu is useful to show the different deflection data when viewing forcedistance<br />
curves.<br />
To OPEN AN IMAGE FILE, place the cursor over the thumbnail and double click the mouse button. The<br />
image will open a Display Window (Figure 12.1.3), as described in Section 12.1.3.
Ryan’s MFP-3D Procedural Operation ‘Manualette’ Version 10 (v080501; Igor 6.04A); 12.3<br />
12.1.2: The List Panel-<br />
• Images can also be opened in the List Panel (Figure<br />
12.1.2). It consists of two columns- ‘Images on Disk’ which<br />
are the files stored in the folder; and ‘Images in Memory’<br />
which display the images that have already been opened in<br />
the experiment.<br />
To open an image file, double click on the file name. The<br />
image will open in something called a Display Window<br />
(Figure 12.1.3), as described in Section 12.1.3.<br />
To open multiple images, hold the Shift key while<br />
selecting images; double mouse click on selected file<br />
names, or click the ‘Open Files’ button.<br />
▪ Most of the function buttons are self explanatory, so only<br />
a few will be discussed- The Help menu offers concise<br />
descriptions of these functions.<br />
▪ The ‘Refresh List’ button updates a list of images in the<br />
same path. This is great if images are being acquired while<br />
previous images are subsequently being processed<br />
/analyzed.<br />
Figure 12.1.2: The List Panel<br />
▪ The ‘Change Directory’ folder allows different data folders to be employed.<br />
▪ The ‘Save to Disk’ button allows modifications to be automatically overwritten.<br />
NOTE: this will overwrite the filename with the<br />
added modified tabs, but the raw data will still<br />
be preserved.<br />
12.1.3: The Display Window:<br />
When an image is recalled, it is displayed in the<br />
‘Display Window’. Figure 12.1.3 shows an<br />
example of a Display Window image that will be<br />
used throughout this section.<br />
1<br />
2<br />
4<br />
3<br />
5<br />
7<br />
6<br />
Notice the top of the window has some setvar<br />
values, pull-down menus and function buttons:<br />
Range- adjusts Z scale (see Section 7.1).<br />
Offset- adjusts where the center of the Z<br />
range is relative to the color table; this allows<br />
more flexibility with image contrasts.<br />
Color Bar checkbox allows the Z range<br />
color table gradient to be viewed.<br />
The ‘Auto’ button auto-scales the Z range and<br />
offset.<br />
The ‘ColorMap’ pull-down menu offers many<br />
Figure 12.1.3: Display Window; B) Command functions in pulldown<br />
menu.
Ryan’s MFP-3D Procedural Operation ‘Manualette’ Version 10 (v080501; Igor 6.04A); 12.4<br />
color tables to display the image data with.<br />
<strong>St</strong>ored data channels.<br />
ARgyle 3D rendering- described in Section 13.<br />
Command Functions<br />
The ‘Commands’ pull-down menu offers a large variety of functions, most of<br />
which will be described below. Some of the more frequently used functions<br />
are also presented as buttons to the right of the Command pull-down menu-<br />
• Display Panel: this is where images can be more easily managed<br />
when there are many open in the software. The author doesn’t typically<br />
employ this because it would be a far too organized approach.<br />
• Modify Panel: this is where flattening, planefit, masking, filtering, FFT<br />
etc. is performed; See Section 12.2.<br />
• Analyze Panel: This is where roughness measurements, line sections<br />
and histograms of pixel data are created/ displayed /generated. See<br />
Section 12.5 for in-depth description of this.<br />
• List panel: Open images, change directories, save images, rename<br />
extract images. See Figure 12.1.2.<br />
• Extract Layer- this function can remove an image channel tab (the<br />
‘layer’ ) out of the display window to be renamed and saved as a smaller file, OR do math / further<br />
processing. see Section 12.4.1.<br />
• Insert Layer- this function installs a layer back into the display window- see Sections 12.4.2 for<br />
examples.<br />
• Delete Layer- self explanatory.<br />
• Show Note- This is where every conceivable imaging/ system parameter can be viewed.<br />
• Change User Names- the author really have no idea what this does; maybe someday …<br />
• Save Image-This will save any modifications to the display window (e.g. Modified data or inserted<br />
layers in new tabs). See Section 12.3 for protocols.<br />
• Save then Kill Image- This saves the image, then closes the file<br />
•Export to Layout- This is a feature that lets electronic notebook style pages be prepared. Described in<br />
Sections 7.7E & 14.13.<br />
• Tiff exports: The number is the resolution of the Tiff, 1, 2, or 4 times the number of pixels in the image.<br />
These files can get very large, but are great for graphics that need to be displayed at larger scales (posters).<br />
• Set Layout Fields- This brings up a list of parameters to show when the export to Layout function is<br />
executed.<br />
• Crop Image- this throws away the cropped data if saved (i.e., you won’t get your won’t get the full image<br />
data back)- so make a copy of the raw data before you perform this; See Section 12.4.5 for protocol.
Ryan’s MFP-3D Procedural Operation ‘Manualette’ Version 10 (v080501; Igor 6.04A); 12.5<br />
• Setup- selecting this function will bring up the ‘DisplayGraphBitControlPanel’, which is a control panel that<br />
allows selection of which panel shortcut buttons and image channel tabs to be displayed in the Display<br />
Window. The author prefers to have all options available out of habit.<br />
• Help- the help menus are very informative.<br />
• For Display Windows with many image<br />
channel tabs, small arrow buttons to the left of<br />
the image channel tabs allow the user to move<br />
left or right through the tabs (see red circle,<br />
image right).<br />
ARgyle 3D rendering- described in Chapter 13.<br />
12.1.4: AR Thumbnail Viewer-<br />
On the non Igor/ MFP-3D software side, the AR thumbnail<br />
viewer is a nice feature if you need to dig through a lot of files<br />
looking for something specific in Windows XP file manager.<br />
Right click on an image file, and choose Properties.<br />
A panel similar to Figure 12.1.4 will appear. The Asylum<br />
Research tab will have a larger thumbnail of the stored image<br />
(you can choose what channel to display), and the lower portion<br />
of the panel has the pertinent scan parameters.<br />
12.2: The Modify Panel-<br />
Figure 12.1.4: the AR thumbnail view lets<br />
users find pertinent information about stored<br />
data in what ever file manager you’re using.<br />
Properly processed images generally involve multiple steps: flattening (to some order), a plane-fit, masking<br />
features, proceeded by a final flatten. A brief description of these processes are described below in this<br />
Section (12.2).
Ryan’s MFP-3D Procedural Operation ‘Manualette’ Version 10 (v080501; Igor 6.04A); 12.6<br />
12.2.1: Flatten Tab:<br />
With a Display Window image open and desired image channel to modify as forward most<br />
tab (for example, Height Trace (HtT) in Figure 12.1.3), click the ‘M’ button to open the Modify<br />
Panel (Figure 12.2.1.1). This panel contains many of the tools needed for image processing.<br />
Just as the default parameters show in Figure 12.2.1.1, start with a Flatten Order of 0 and the ‘All’ Radio<br />
button selected.<br />
A<br />
B<br />
Figure 12.2.1.1: The Flatten tab of<br />
the Modify Panel; B) different<br />
flattening order options.<br />
Click the ‘Flatten’ button; after a brief moment of Igor calculation, the image will be flattened.<br />
•Also notice there is a new tab in the Display window: a suffix *0 indicates the image channel has been<br />
modified in some way.<br />
• Depending on the complexity of the surface, different flatten orders can be performed on the surface. Figure<br />
12.1.1.2 shows some different examples of the flattening order options in Figure 12.1.1.1B on a moth eye<br />
image.<br />
raw<br />
0 th<br />
1 st<br />
3 rd Magic Mask<br />
2 n<br />
d<br />
Figure 12.1.1.2: Different Flatten order results on an AC mode image of a<br />
moth eye. Notice the subtle differences in the surface features.
Ryan’s MFP-3D Procedural Operation ‘Manualette’ Version 10 (v080501; Igor 6.04A); 12.7<br />
Click the ‘Auto’ Button at the top of the Display Window; the image will be autoscaled, allowing a better<br />
look at the topography. Note that in some instances, the autoscale may actually make the image look less<br />
appealing- this is when the Range and/or Offset setvars can/should be adjusted.<br />
▪ Figure 12.2.1.2 shows a series of an AC mode image of a moth eye (35μm, Z scale 2.5μm) flattened with the<br />
different flatten order algorithms. Notice the ‘Magic mask’ appears to be similar to a first order flatten. Magic<br />
Mask is a new feature, and very convenient, especially for more complex surfaces.<br />
• Depending on the data features in the flattened data, their may be flattening artifacts (streaks) around the<br />
surface features/ asperities. To remove these features a planefit and image Mask are most likely needed: see<br />
Sections 12.2.2 & 12.2.3. A sequence of removing such features (via flattening, planefit & masking) can be seen<br />
in Figure 12.2.3.4.<br />
12.2.2: Planefit Tab:<br />
Go to the Plane tab of the Modify panel (Figure 12.2.2.1).<br />
Confirm the planefitting order is set to 1 in the pulldown<br />
menu. This is the most common plane fit order for<br />
data processing. More or less extreme order examples area<br />
seen in Figure 12.2.2.2.<br />
Click the ‘XY’ button; this will planefit the image in the<br />
X&Y plane with respect to Z.<br />
Alternatively, if the plane fit can also be performed on<br />
solely on the X (fast scan axis) or Y planes (slow scan axis).<br />
• Figure 12.2.2.2 shows a series of AC mode Z sensor<br />
images of a human hair (40 μm; Z: 4μm) Plane fit at 0, 1 th ,<br />
2 nd & 3 rd order plane fits.<br />
Figure 12.2.2.1: Planefit tab of Modify Panel
Ryan’s MFP-3D Procedural Operation ‘Manualette’ Version 10 (v080501; Igor 6.04A); 12.8<br />
Raw<br />
1st<br />
2 nd<br />
6µm<br />
4<br />
2<br />
0<br />
2<br />
0<br />
-2<br />
-4µm<br />
0 th 0<br />
-2<br />
-4µm<br />
ZSensor<br />
400<br />
0<br />
-400nm<br />
0<br />
5<br />
10<br />
15<br />
µm<br />
20<br />
25<br />
30<br />
0<br />
5<br />
10<br />
15<br />
µm<br />
20<br />
25<br />
30<br />
0<br />
5<br />
10<br />
15<br />
µm<br />
20<br />
25<br />
30<br />
0<br />
5<br />
10<br />
15<br />
µm<br />
20<br />
25<br />
30<br />
3rd<br />
Histogram<br />
Figure 12.2.2.2: A series of 30µm Z sensors images of<br />
human hair XY Planefit to different orders that are<br />
available in the Planefit order pulldown. Line section<br />
analysis below each image to show effects of plane fit.<br />
Data courtesy of Jason Li, Asylum Research.<br />
ZSensor<br />
400<br />
0<br />
-400nm<br />
ZSensor<br />
4<br />
0<br />
-4<br />
-8µm<br />
0<br />
5<br />
10<br />
15<br />
µm<br />
20<br />
25<br />
30<br />
0<br />
5<br />
10<br />
15<br />
µm<br />
20<br />
25<br />
30<br />
12.2.3: Mask Tab:<br />
Image masks save a great deal of time when omitting<br />
features from images that would otherwise create<br />
flattening artifacts (Figure 12.2.3.4A). Essentially, what<br />
the mask does is pick a defined plane / threshold in the<br />
Z axis and omit anything above, or below that threshold<br />
value.<br />
• The mask can also be used to do image processing<br />
exclusively within or outside of the mask (see Sections<br />
12.5). They sometimes require some trial and error Z<br />
threshold searching.<br />
Go to the Mask tab of the Modify Panel (Figure<br />
12.2.3.1).<br />
Confirm that ‘Iterative’ is chosen in the ‘Calc Method’<br />
pull-down menu. This mask type is a good mask to start<br />
with to ultimately find the proper threshold value.<br />
Figure 12.2.3.1: Mask tab of the Modify Panel<br />
▪The author generally starts by activating the Inverse checkbox - which will effectively exclude the points<br />
contained within the mask during the subsequent re-flattening (see below), or other calculation.
Ryan’s MFP-3D Procedural Operation ‘Manualette’ Version 10 (v080501; Igor 6.04A); 12.9<br />
Click the ‘Calc Mask’ button; Igor will determine a Z range that is generally close to the Z range that is<br />
needed to help clean up the image (to human perception; Figure 12.2.3.2B). Notice the ‘Calc Method’ has<br />
change to Manual- because a Z threshold value has been determined by the software.<br />
• At this point, you may or may not be happy with the Z range the calculation picked- there are many ways to<br />
combat this:<br />
Manually enter a threshold range, and re-calculate the mask; the author generally does this to get a precise<br />
(yet subjective) position of the mask.<br />
Click the ‘Erode Mask’ button- this will make the mask a little smaller (Figure 12.2.3.2C).<br />
Click the ‘Dilate Mask’ button- this will make the mask a little larger. (Figure 12.2.3.2D).<br />
A B C D<br />
0<br />
2<br />
4<br />
µm<br />
6<br />
8<br />
0<br />
2<br />
4<br />
µm<br />
6<br />
8<br />
Figure 12.2.3.2: Creating image masks: A) after zero order flatten (i.e., no mask); B) after Iterative mask<br />
result; C) Panel B) after Erode mask button click; D) Panel B) after Dilate Mask button click.<br />
0<br />
2<br />
4<br />
µm<br />
6<br />
8<br />
0<br />
2<br />
4<br />
µm<br />
6<br />
8<br />
•The image can be re-flattened at this point to clean up any flattening artifacts (dark horizontal streaks in<br />
Figure 12.2.3.2- See Figure 12.2.3.4 for an example incorporating flattening, plane-fitting and image masks.<br />
Mask Calculation Methods-there are many different mask algorithms to choose from:<br />
-Manual: allows the user to enter a value into the Threshold range- this will put the mask at that value above,<br />
or below (inverse box checked)<br />
-Iterative: this calculation automatically picks a Z threshold range using an iterative method.<br />
The author doesn’t generally use the latter menu selections due to lack of understanding-<br />
-Bimodal: Mask calculated based on image histogram is a simple bimodal distribution.<br />
-Adaptive: apparently this method evaluates threshold based on the last 8 pixels in each row, using<br />
alternating rows. Presumably these last 8 pixels are for the substrate. The author doesn’t have much<br />
experience with this method.<br />
-Fuzzy Entropy: not really sure what this does<br />
-Fuzzy-Mean Gray: measures the mean gray level in the object and background; seems to do something<br />
similar to iterative method<br />
• The author usually sticks with ‘Iterative’ and ‘Manual’ calculations.
Ryan’s MFP-3D Procedural Operation ‘Manualette’ Version 10 (v080501; Igor 6.04A); 12.10<br />
Copying Masks-<br />
In some instances, performing two separate iterative mask calculations on two separate image channels in a<br />
data file can give different results (for example, the height and phase channels), especially when wanting to<br />
overlay two channels in ARgyle (Section 13). In these instances, it’s a good idea to copy the mask from one<br />
channel, and paste it into another channel.<br />
Another reason to Copy Mask is when trial and error approaches are being employed with plane fit or finding<br />
a flattening order in which pasting a Mask saves processing time.<br />
Click the ‘Reset Mask’ button to remove the mask.<br />
• Additionally, Masks can be created using the Exclude Points feature-<br />
Click the ‘Exclude Points’ button in the Flatten, Planefit, or Mask tabs of the Modify Panel. This will bring up<br />
the Igor tool box (Figure 12.2.3.3). Lines, circles and the free hand tool can be used to make shapes on the<br />
image.<br />
Click the ‘Make Mask’ Button; this will create the mask (Figure 12.2.3.3C- red lines).<br />
• For additional shapes, choose from the Igor tool box; (ctrl + T, upper left box Figure 12.2.3.3A).<br />
With the shape drawn, it can be moved while its still blue- use arrow keys for this (Figure 12.2.3.3C).<br />
Click the ‘Make Mask’ Button (Figure 12.2.3.3D).<br />
Image masks can also be used in the Roughness tab of the Analyze Panel to omit data from the<br />
roughness measurement (i.e., some spurious asperity that will compromise an otherwise candidate<br />
data set). This area is the surface area- it takes into account the XY&Z values in the image data. See<br />
Section 12.5.1 for a brief description of this.<br />
Make the whatever shape is needed- the Igor tool breaks them down into points- (Figure 12.2.3.3B)<br />
• Figure 12.2.3.4 shows a typical sequence the author frequently uses to process most images-<br />
1) <strong>St</strong>art with a zero order flatten and 1 st order XY Planefit (Figure 12.2.3.4A).<br />
2) Make an Iterative mask, fine tune with Manual mask setvar if not quite where it needs to be- quite often, the<br />
author places the mask on what is perceived to be the substrate (Figure 12.2.3.4B).<br />
3) Reflatten (Figure 12.2.3.4C).
Ryan’s MFP-3D Procedural Operation ‘Manualette’ Version 10 (v080501; Igor 6.04A); 12.11<br />
A<br />
B<br />
C<br />
D<br />
80<br />
60<br />
40<br />
20<br />
0<br />
0 20 40 60 80<br />
µm<br />
Figure 12.2.3.3: Using Exclude points masking feature: A) Igor tool box to make custom<br />
shape; B) free hand tool used to make shape on image; C) Addition ellipse shape made- blue<br />
shape indicated it can be moved on image with arrow keys; D) finished mask. Data courtesy of<br />
Keith Jones, Asylum Research; sample courtesy J. Schlenoff, FSU Chemistry.<br />
Figure 12.2.3.4: Typical processing sequence of a Height image with surface features of raw data found in Figure 12.1.3: A)<br />
Zero order Flattening; B) First order XY PlaneFit; & Iterative Mask calculation; C) Subsequent zero Order Re-flattening;<br />
Mask is still present.
Ryan’s MFP-3D Procedural Operation ‘Manualette’ Version 10 (v080501; Igor 6.04A); 12.12<br />
12.2.4: Erase Tab:<br />
Erasing aberrant scan lines is easily done with the<br />
MFP-3D software. Note that erasing too many lines<br />
for a publication can work against you- Experienced<br />
SPMers expect an aberrant noise line here and there<br />
in publication images. Please use this feature with<br />
discretion.<br />
Expand small area around line(s) to be erased.<br />
Go to the Erase tab of the Modify Panel.<br />
Click the ‘Draw Lines’ button.<br />
Figure 12.2.4.1: The Erase (scan lines) tab of the<br />
Modify Panel.<br />
While holding the left mouse cursor down, place the pointing finger cursor (Figure 12.2.4.1C) over the scan<br />
line you wish to remove, and release. Notice the line goes from red while positioning, and blue when set. In<br />
this example, one didn’t seem enough, so it was increased to two using the ‘Line Width’ setvar window. If<br />
placement of line is dissatisfactory, click the ‘Clear Lines’ button to remove and repeat attempt.<br />
Click ‘Erase Line’ button.<br />
With the cursor over the image, click Ctrl + A to restore to original size to assess results.<br />
• Figure 12.2.4.2 shows a very noticeable aberrant scan line in the ARgyle 3D rendering (Figure 12.2.4.2A). To<br />
erase scan lines precisely, the author finds it easier to expand on a small area(s) containing the aberrant scan<br />
line (Figure 12.2.4.2B), giving more control over placement or cursor before erasing it (Figure 12.2.4.2C).<br />
A<br />
B<br />
C<br />
Figure 12.2.4.2: ARgyle 3D rendering showing highlighting aberrant scan line; B) Expand on area where scan line<br />
is to be erased; C) Place ‘Draw line’ cursor on scan line and erase.<br />
• To increase the number of scan lines to erase, increase the ‘Line Width’ setvar value.
Ryan’s MFP-3D Procedural Operation ‘Manualette’ Version 10 (v080501; Igor 6.04A); 12.13<br />
12.2.5 Filter Tab<br />
This tab performs various images filtering. The author<br />
doesn’t claim to have a great knowledge of image<br />
processing and filtering algorithms, but just<br />
experimenting with some of the parameters yielded the<br />
examples described below.<br />
The two filters that are mainly used are the NxN and 3x3<br />
matirx filter widths. At each pixel of the image, they look<br />
at the nearest neighbors of that pixel, and apply an<br />
operation on those neighboring pixels to calculate the<br />
new pixel. A description of these matrix filters can be<br />
defined better in the software help menus.<br />
NxN filter pull-down: this matrix filter has various filter<br />
method types including: Median, Average, Gauss, min,<br />
max, NaNZapmedian (whatever that is…).<br />
The Size setvar defines the size of the NxN matrix; the<br />
larger the number, the longer the calculation time. The<br />
author looks at it similar to a smoothing function.<br />
Figure 12.2.5.1: Filter tab offers various matrix filter<br />
with respective image filter types and user defined<br />
processing intereations.<br />
The Passes setvar defines the number of iterations that filtering process undergoes.<br />
The 3x3 Filter pull-down (seems to) performs a 3x3 matrix filter on the image; filter<br />
types here include: Surface edges, Find edges, point, sharpen, sharpen more, and<br />
the gradient filters in each direction (N,S,E,W).<br />
• Figure 12.2.5.2 shows some examples of what the filter type methods do- the<br />
author choose to use a 10x10 matirx filter so the changes are (more or less) obvious<br />
relative to the raw unfiltered data. Respective line sections below images also show<br />
differences between filter processing.<br />
The author recommends experimenting with these parameters if image processing is needed on your data,<br />
but cannot offer much practical advice due to lack of experience filtering images.
Ryan’s MFP-3D Procedural Operation ‘Manualette’ Version 10 (v080501; Igor 6.04A); 12.14<br />
Raw, unfiltered<br />
10x10 Median<br />
10x10 average<br />
10x10 Gauss<br />
Height<br />
2<br />
0<br />
-2<br />
-4nm<br />
0.0<br />
1.0<br />
µm<br />
2.0<br />
3.00.0<br />
1<br />
0<br />
-1<br />
-2<br />
-3<br />
-4nm<br />
1.0<br />
µm<br />
2.0<br />
3.0.0<br />
1<br />
0<br />
-1<br />
-2<br />
-3<br />
-4nm<br />
1.0<br />
µm<br />
2.0<br />
3.00.0<br />
1<br />
0<br />
-1<br />
-2<br />
-3<br />
-4nm<br />
1.0<br />
µm<br />
2.0<br />
3.0<br />
0.0<br />
0.2<br />
0.4<br />
0.6<br />
0.8<br />
1.0<br />
1.2<br />
1.4<br />
0.0<br />
0.2<br />
0.4<br />
0.6<br />
0.8<br />
1.0<br />
1.2<br />
1.4<br />
0.0<br />
0.2<br />
0.4<br />
0.6<br />
0.8<br />
1.0<br />
1.2<br />
1.4<br />
0.0<br />
0.2<br />
0.4<br />
0.6<br />
0.8<br />
1.0<br />
1.2<br />
1.4<br />
µm<br />
µm<br />
µm<br />
µm<br />
10x10 Min<br />
10x10 Max<br />
10x10 NaNZapMedian<br />
g<br />
0<br />
-1<br />
-2<br />
0.0<br />
1.0<br />
µm<br />
2.0<br />
3.0 0.0<br />
2nm<br />
1<br />
1.0<br />
µm<br />
2.0<br />
3.0<br />
2<br />
1<br />
0<br />
0.0<br />
1.0<br />
µm<br />
2.0<br />
3.0<br />
-3<br />
0<br />
-1<br />
-4<br />
-1<br />
-2<br />
-5nm<br />
-2<br />
-3nm<br />
0.0<br />
0.2<br />
0.4<br />
0.6<br />
0.8<br />
1.0<br />
1.2<br />
1.4<br />
0.0<br />
0.2<br />
0.4<br />
0.6<br />
0.8<br />
1.0<br />
1.2<br />
1.4<br />
0.0<br />
0.2<br />
0.4<br />
0.6<br />
0.8<br />
1.0<br />
1.2<br />
1.4<br />
µm<br />
12.2.5.2: Examples of NxN filter method types: Matrix is 10x10; z scale 7nm.<br />
µm<br />
µm<br />
12.2.6 FFT Tab<br />
The author cannot competently describe this at this time.
Ryan’s MFP-3D Procedural Operation ‘Manualette’ Version 10 (v080501; Igor 6.04A); 12.15<br />
12.2.7 History Tab<br />
This tab will show what modifications have been done to the<br />
image that is being processed (Figure 12.2.7).<br />
•If the image have been killed and reopened, the history<br />
window will not show what modifications were made.<br />
12.3: Saving Modifications to Display Window<br />
Figure 12.2.7: The History tab of the Modify<br />
Panel- This example shows the modifications<br />
that have occurred.<br />
Any image modification can be saved by going into the Commands pull-down menu, and select ‘Save Image’,<br />
or ‘Save then Kill Images’. This will save the modifications, which will be present when the image is killed and<br />
reopened. Any additional changes made and saved will overwrite the modified data (* tabs), but the raw data<br />
will be preserved.<br />
12.4: Misc. Operations: Below are some useful operations for image processing.<br />
12.4.1: Extracting layers:<br />
Layers (i.e., channel tabs) can be extracted from the display window into their own file containing just that<br />
image. Math can then be done on these individual layers, or is a way to package individual image channel<br />
tabs to reduce file size for emailing an ibw.<br />
With the desired channel as the forward most tab, select ‘Extract Layer’ in the Command pull-down menu;<br />
this will create a (single tab) image in Memory called ‘Layer Data’.<br />
To view this file, click the ‘Open Images’ button.<br />
• This new image can be renamed and saved, or have math performed on it and reinserted back into the<br />
display window.
Ryan’s MFP-3D Procedural Operation ‘Manualette’ Version 10 (v080501; Igor 6.04A); 12.16<br />
Figure 12.4.1: A) Extracting a layer from<br />
the display window; B) the new extracted<br />
layer is dumped into the ‘Images in<br />
Memory’ in the List panel as ‘Layer Data’<br />
(orange arrow).<br />
12.4.2: Inserting layers:<br />
Once an image has had some math or some other function performed on it, it can be reinserted into the<br />
Display Window it came from, or another display window. An example of the latter is perhaps a force volume<br />
map image layer was created, and you wanted to insert it into an AFM image of the same area- an example of<br />
this can be seen in Figure 13.12 in Chapter 13 (Argyle 3D Rendering).<br />
If the layer is called something other than LayerData, change it back so it can be inserted (Figure 12.4.2A).<br />
Select ‘Insert Layer’ from the Commands pull-down menu.<br />
The Insert Layer dialogue appears, allowing the modification suffix* of the tab should be changed (Figure<br />
12.4.2B).<br />
Click the ‘Do It’ button.<br />
• The layer will be inserted into the display window (Figure 12.4.2C).
Ryan’s MFP-3D Procedural Operation ‘Manualette’ Version 10 (v080501; Igor 6.04A); 12.17<br />
A<br />
B<br />
C<br />
Figure 12.4.2: Inserting layers; A) modified image renamed to ‘LayerData’; B) Insert Layer panel allows<br />
modification suffix to be changed; C) Inserted layer.<br />
12.4.3: Subtracting images:<br />
Want to get Height images that appear super sharp like a JPK, or some Veeco marketing crap? It’s easywhat<br />
you have to do is subtract the amplitude image from the height image. That being said, use this with<br />
discretion- If you present this among your peers, the ethical thing to do is state that it’s a subtracted image-<br />
• In this example (Figure 12.4.3), the amplitude of an AC mode image of pseudomonas aeruginosa is going to<br />
be subtracted from the Height image.<br />
In the display window of the image you wish to perform the subtraction on, select ‘Extract Layer’ from the<br />
commands pull-down menu. The ‘Images in Memory’ column of the List panel will now have ‘LayerData’ as a<br />
choice. In this example, the modified amplitude image was extracted first.<br />
Click the ‘Rename Images’ button- the New Name dialogue will appear- rename the file to what ever you<br />
want<br />
-OR-<br />
In the command line, rename that extracted layer to what ever you want<br />
example -type: Rename layerdata PAAmt<br />
Do the same for the other image (in this example the modified Height trace), but you don’t have to rename<br />
it if you don’t want. If you do rename second extracted layer, use this name instead of layerdata in next step<br />
In the command line, subtract one channel from another;<br />
type: Layerdata = Layerdata -PAAmT<br />
Alternatively, you can type: layerdata -=PAAmt<br />
(Does the same operation)<br />
Then type: Newimage /F(imagename) - to create the subtracted image (Figure 12.6.3C).<br />
Re-insert the Layer into the Display Window so it can be viewed as a modified tab, allowing masking, section<br />
analysis or ARgyle to be performed on this new image tab. see Section 12.4.2.
Ryan’s MFP-3D Procedural Operation ‘Manualette’ Version 10 (v080501; Igor 6.04A); 12.18<br />
• Figure 12.4.3 shows the sequence of subtracting a modified Amplitude form a modified Height image-<br />
A<br />
B<br />
C<br />
E<br />
D<br />
Figure 12.4.3: Subtracting images: A) extracted height layer; B)<br />
Extracted Amplitude layer; C) amplitude subtracted from Height image<br />
result; D) Layer reinserted into Display Window (HtT*1 tab); E) History<br />
window shows command line sequence of this example.<br />
12.4.4: Rotating images:<br />
In some rare instances, an image must be rotated.<br />
Extract the layer of the image desired to be rotated.<br />
In the command line type: duplicate layerdata, filename -i.e., rename that layer<br />
In the command line type: layerdata = filename [q][# of image pixels-p]<br />
• In the example shown in Figure 12.4.2, the filename was PA bac, and it was a 640 x 640 image<br />
resolution.<br />
At this point, the author has only be taught how to rotate 90 degree CCW.<br />
• For an additional example, see Section 14.23.
Ryan’s MFP-3D Procedural Operation ‘Manualette’ Version 10 (v080501; Igor 6.04A); 12.19<br />
A<br />
5<br />
B<br />
4<br />
3<br />
2<br />
1<br />
0<br />
0<br />
1<br />
2<br />
3<br />
4<br />
5<br />
0<br />
1<br />
2<br />
3<br />
4<br />
5<br />
µm<br />
µm<br />
C<br />
Figure 12.4.2: Rotating a stored image; A) Extract desired layer to rotate; B) With a<br />
couple of command line executions, the image is rotated.<br />
12.4.5: Cropping Images:<br />
Cropping images is straight forward- basic image cropping will be discussed first, then precision cropping<br />
Copy the .ibw file before cropping an image- this process will cut the image data, which will be lost- so its<br />
best to crop the copied file.<br />
Expand or ‘Square Expand’ on the area you want to crop.<br />
NOTE: Square expand only works for offline data- not real time imaging.<br />
Go to commands pull-down and select ‘Crop Image’.<br />
Go to commands pull-down and select ‘Save Image’.<br />
•Notice the scale is not a nice ‘round number’ (Figure 12.4.5B)<br />
Extract layer; this fixes the scale (Figure 12.4.5C).<br />
Precision cropping-<br />
There is a way to crop more precisely-<br />
Open the Modify Axis Panel and manually enter the range under the ‘Axis Range’ tab to suit need.<br />
Crop image.<br />
Save Image.
Ryan’s MFP-3D Procedural Operation ‘Manualette’ Version 10 (v080501; Igor 6.04A); 12.20<br />
A<br />
26<br />
B<br />
10<br />
C<br />
24<br />
8<br />
22<br />
6<br />
20<br />
4<br />
18<br />
2<br />
0<br />
4 6 8 10 12 0 2 4 6 8<br />
µm<br />
µm<br />
Figure 12.4.5: Cropping stored images: A) expand on the area desired to be cropped; B) result (notice axis scale<br />
relates to where it was expanded from in raw data); C) extract layer to rescale image axis.<br />
10<br />
Notice the resolution of the cropped image decreases because of the data loss- cropping from large pixel<br />
images suffer less data loss.<br />
12.5: Analyze Panel<br />
The Analyze panel is where roughness, area calculations, line sections<br />
& histograms of image pixels can be viewed.<br />
There are various ways to open the panel-<br />
Click the ‘A’ button in the Display Window<br />
Go to MFP IP Analyze Panel.<br />
The Analyze panel will appear (Figure 12.5.1.1).<br />
12.5.1: Roughness Analysis<br />
Open the Roughness tab on the Analyze Panel.<br />
• The most recent image will have its ‘<strong>St</strong>ats’ (presented in the<br />
Roughness tab) displayed. See help button for descriptions of <strong>St</strong>ats.<br />
• If the image is masked, then the ‘Masked Image’ column will have<br />
the <strong>St</strong>ats for the mask.<br />
NOTE: If inverse check in Mask tab of Modify Panel has a<br />
direct effect over what is being masked (thus the calculation)<br />
in the image.<br />
• If the Inverse in the Mask tab of the Modify is NOT activated, then<br />
space inside the mask is what’s contained by the mask.<br />
• If the Inverse is activated, then space outside the mask is what’s<br />
contained by the mask.<br />
NOTES ON THE ROUGHNESS STATS:<br />
•RMS roughness is Z scale data that must be centered around 0- and<br />
Figure 12.5.1.1: Roughness tab in<br />
the Analyze Panel.
Ryan’s MFP-3D Procedural Operation ‘Manualette’ Version 10 (v080501; Igor 6.04A); 12.21<br />
must be raw data. On flattened / processed data, the RMS value then becomes the <strong>St</strong>andard Deviation data.<br />
Unfortunately, RMS roughness data has been erroneously used by the AFM community for years, probably<br />
due to a precedent set by Digital Instruments/ Veeco that has been propagated throughout the years<br />
• <strong>St</strong>andard Deviation (SDev): removes any offsets in the Z data and looks for the points between minima and<br />
maxima. This is a better roughness parameter to use because it works with processed data, as well as data not<br />
centered around zero (what ever that dimension might be (distance, phase, current, etc.)<br />
• Average Deviation (ADev): this is an average of the Z data points in the image data matrix. This typically is a<br />
smaller value than the SDev.<br />
• Min: minimum data point in the image matrix<br />
• Max: Maximum data point in the image matrix<br />
• Skew: this is short for skewness- a measure of the asymmetry of the distribution peak. With negative skew,<br />
the left tail is longer; the mass of the distribution is concentrated on the right of the figure. Vice Versa with<br />
positive skew.<br />
• Kurt: this is short for Kurtosis- a statistical term that defines the ‘peakedness’ of the distribution peak; A high<br />
kurtosis distribution has a sharper peak and longer, fatter tails, while a low kurtosis distribution has a more<br />
rounded peak and shorter thinner tails.<br />
• Average:<br />
• Percent: percentage of area in image- useful when using a image mask – see below.<br />
• Volume: calculates volume from individual Z points per XY area.<br />
• Area %: calculates the actual area of the surface, taking into account the Z position per XY, not a projected<br />
area value).<br />
50<br />
40<br />
A<br />
50<br />
40<br />
B<br />
50<br />
40<br />
C<br />
30<br />
30<br />
30<br />
20<br />
20<br />
20<br />
10<br />
10<br />
10<br />
0<br />
0<br />
10<br />
20 30<br />
µm<br />
40<br />
50<br />
0<br />
0<br />
10<br />
20 30<br />
µm<br />
40<br />
50<br />
0<br />
0<br />
10<br />
20 30<br />
µm<br />
40<br />
50<br />
Figure 12.5.1.2: Roughness panel <strong>St</strong>ats: A) unmasked image; B) iterative mask results; C) manually<br />
adjusted mask to mask smaller features at top of pattern.
Ryan’s MFP-3D Procedural Operation ‘Manualette’ Version 10 (v080501; Igor 6.04A); 12.22<br />
• An example of image roughness measurements relative to surface features contained by the mask is shown<br />
in Figure 12.5.1.2. Panel (A) shows an image of a elastomeric mold that contains no image mask- Notice the<br />
‘Masked Image’ column of the Roughness tab shows ‘Nan N’ which effectively is Igor speak for not a real<br />
number (i.e., no data) in the dimension of meters; Panel B shows the result of an ‘iterative mask’ with inverse<br />
checkbox NOT activated (see Figure12.2.3.1)- the values in the ‘Masked Image’ column represent the areas<br />
outside the mask (i.e., the lighter areas of the image). Finally, in Panel C), the masked was manually set to<br />
include the smaller features of the mold above the plane of its main surface- these ‘<strong>St</strong>ats’ numbers represent<br />
the image with inverse checkbox activated.<br />
.<br />
The way the author figures out what area is inside or outside the mask relative to the status of the<br />
inverse checkbox activation in the Mask tab is to look at the ‘Percent’ stat. If the data in question is<br />
too close to tell, it may be a good idea to go back to compare some data that is more intuitive- like<br />
a calibration grid, to get a good sense of what how the calculation works.<br />
50<br />
40<br />
A<br />
50<br />
40<br />
B<br />
50<br />
40<br />
C<br />
30<br />
30<br />
30<br />
20<br />
20<br />
20<br />
10<br />
10<br />
10<br />
0<br />
0<br />
10<br />
20 30<br />
µm<br />
40<br />
50<br />
0<br />
0<br />
10<br />
20 30<br />
µm<br />
40<br />
50<br />
0<br />
0<br />
10<br />
20 30<br />
µm<br />
40<br />
50<br />
Figure 12.5.1.2: Roughness panel <strong>St</strong>ats: A) unmasked image; B) iterative mask results; C) manually<br />
adjusted mask to mask smaller features at top of pattern.<br />
FYI: AREA is the actual area (i.e. Z position per XY is factored in; not a projected area value).
Ryan’s MFP-3D Procedural Operation ‘Manualette’ Version 10 (v080501; Igor 6.04A); 12.23<br />
• Click the ‘Export Roughness’ button to create a text file<br />
of the <strong>St</strong>ats, and dump it wherever the stored image is<br />
saved. An example of exported data can be seen in Figure<br />
12.5.1.3.<br />
12.5.2: Section Analysis:<br />
The Section tab (Figure 12.5.2.1) is where to perform line sections- lines<br />
can be of user defined lengths, full vectors across the image, free hand,<br />
or averages of scan lines. The lower portion of the panel will show the<br />
<strong>St</strong>ats on the Igor cursors (,), relative to each other in three<br />
dimensions.<br />
12.5.2A: Basic Line Sections:<br />
Open the Analyze Panel by clicking the ‘A’ button in the Display<br />
window; or MFP IP Analyze Panel.<br />
Open the Section tab.<br />
• The Mode pull-down menu offers vector type lines or free hand lines<br />
to be drawn . The first example will be line; a free hand example is<br />
shown in Figure 12.5.2.2.<br />
Select ’Line‘ from the Mode pull-down menu.<br />
Click the ‘Draw’ button.<br />
Figure 12.5.1.3: An exported <strong>St</strong>ats text file.<br />
Pull cursor over to image feature to draw a line on the feature of<br />
interest in the image (Figure 12.5.2.2A).<br />
Figure 12.5.2.1: the Section tab of<br />
the Analyze Panel.<br />
▪ Select Full Width checkbox if it is desired for the line section to traverse to the edge of scan areas along<br />
the line vector drawn.<br />
▪ Multiple scan lines can be averaged to eliminate noise or give more statistical relevance to the sectioned line<br />
(see Figure 12.5.2.6).<br />
▪ Once the line is drawn, a Section plot similar to Figure 12.5.2.2B will appear. The Igor cursors (Ctrl + I (,))<br />
can be placed on the curve to measure points on the line (notice blue cursors on the features in image<br />
correspond to cursors on the line section Figure 12.7.2.2B); and their respective cursor location <strong>St</strong>ats are<br />
displayed in the lower half of the Analyze panel (Figure 12.5.2.2C).
Ryan’s MFP-3D Procedural Operation ‘Manualette’ Version 10 (v080501; Igor 6.04A); 12.24<br />
A B C<br />
0.0<br />
1.0<br />
2.0<br />
3.0<br />
µm<br />
Figure 12.5.2.2: Line Section analysis: draw the line vector on the image; B)<br />
corresponding line vector; C) Section tab shows <strong>St</strong>ats of , cursors relative to each<br />
other in three dimensions. (SEBS triblock polymer sample courtesy of the Kramer lab).<br />
Click the ‘Export Table’ button to get these cursor stats.<br />
These can be saved as a text file, or dumped into various<br />
types of software for further organization (Figure 12.5.2.3).<br />
Figure 12.5.2.3: Exported cursor data <strong>St</strong>ats.<br />
12.5.2B: Leveling Line Sections:<br />
▪ If the image happens to possess some tilt, it won’t be intuitive to get a proper height from the cursors. There<br />
are two ways to get around this:<br />
Perform a 1 st order XY plane fit on the image. Most times that helps get around this. See section 12.2.2 for<br />
further description.<br />
Hold Crtl key over curve to be ‘leveled’; a cursor will appear; right or left mouse click over line, and move<br />
to make image flat. From here, the Igor Crtl + I cursors can be put on to measure a more accurate height<br />
differentials. See Figure 12.5.2.4 for an example.
Ryan’s MFP-3D Procedural Operation ‘Manualette’ Version 10 (v080501; Igor 6.04A); 12.25<br />
ZSensor<br />
-80<br />
-100<br />
-120<br />
-140<br />
-160<br />
-180nm<br />
ZSensor<br />
-80<br />
-90<br />
-100<br />
-110<br />
-120<br />
-130nm<br />
0<br />
10<br />
20<br />
30<br />
µm<br />
40<br />
50<br />
60<br />
Figure 12.5.2.4: Leveling line section waves: A) over the sloped line section, hold Ctrl button and left mouse<br />
over wave- a cursor will appear; move cursor up or down level wave; B) Result allows quick height<br />
differentials to be measured more accurately- Notice Y axis rescaled in B).<br />
0<br />
10<br />
20<br />
30<br />
µm<br />
40<br />
50<br />
60<br />
12.5.2C: Adjust the Angle of the<br />
Section Line-<br />
There are multiple ways to adjust line section<br />
angles:<br />
Click the ‘Clear’ button in the Analyze panel<br />
and redraw a new line over feature of interest.<br />
Grab one of the end Igor cursors on the<br />
section line in the image by left click & hold<br />
while dragging cursor to new point (orange<br />
arrow, Figure 12.5.2.5A).<br />
Use the Angle check box to manually<br />
adjust with the Angle setvar window.<br />
12.5.2D: Averaging multiple section<br />
lines:<br />
Enter the desired amount of scan lines to be averaged in the<br />
Width setvar window in the Analyze panel. The line will be<br />
displayed with solid center indicating center, and dotted lines<br />
represent the averaging scan line width (Figure12.5.2.6- a 25 line<br />
average in a 512 x 512 image resolution)<br />
Figure 12.5.2.5: Adjusting line section angles: A) drag one of<br />
the Igor cursors to a new area; B) result.<br />
Figure 12.5.2.6: Averaging multiple scan<br />
lines.
Ryan’s MFP-3D Procedural Operation ‘Manualette’ Version 10 (v080501; Igor 6.04A); 12.26<br />
12.5.2F: ‘Free Hand’ lines:<br />
Free hand line section can be made in the offline section analysis:<br />
Select ‘Free Hand’ from the Mode pull-down menu (Figure 12.5.2.7A).<br />
Click the ‘Draw’ Button.<br />
Draw the cursor path through the surface features desired to be incorporated into the Free Hand line<br />
section; (Figure 12.5.2.7B).<br />
• Once the mouse button is let go, the line becomes a series of square points (Figure 12.5.2.7C).<br />
Move the mouse cursor back into the image, and double click- this initiates the section to be calculated.<br />
• Notice the line changes back to a thin red line (Figure 12.5.2.7D), and the line section appears in the<br />
‘Sections’ plot (Figure 12.5.2.7E).<br />
5<br />
A B<br />
C D<br />
4<br />
3<br />
2<br />
1<br />
0<br />
Figure 12.5.2.7: ‘Free hand’ line sections: A) activate free hand<br />
from Mode pull-down menu; B) draw line on image; C) turns to<br />
points once mouse button released; D) double click mouse on<br />
image to activate line; E) resulting line section.<br />
ZSensor<br />
60nm<br />
40<br />
E<br />
0<br />
1<br />
2<br />
µm<br />
3<br />
4<br />
5<br />
20<br />
0<br />
0.0<br />
0.5<br />
1.0<br />
1.5<br />
2.0<br />
2.5<br />
3.0<br />
12.5.2G: Plotting multiple line sections displayed on one section plot-<br />
µm<br />
Create a section line as described above.<br />
Click the ‘Take a “Snap Snot” of active trace and append to upper graph’ Button.<br />
Create additional section line.<br />
Click the ‘Take a “Snap Snot” of active trace and append to upper graph’ Button.<br />
▪ Figure 12.5.2.8 shows an example of this.
Ryan’s MFP-3D Procedural Operation ‘Manualette’ Version 10 (v080501; Igor 6.04A); 12.27<br />
A<br />
C<br />
D<br />
B<br />
Figure 12.5.2.8: Plotting multiple section on one section plot: A) create first section plot; B) click “Snap<br />
Shot” button in Sections window; C) Create additional Section plot; B) click “Snap Shot” button in<br />
Sections window again; D) resulting multiple sections plot(s). Sample: Collagen in air.<br />
12.5.2H: Exporting line sections as XY data:<br />
Click the ‘Edit’ button in the Section plot- this will bring up a table with a Y value, relative to the points in<br />
the Igor Wave (see Igor ‘Getting <strong>St</strong>arted’ manual to understand the definition of a wave), and the points where<br />
the blue cursors are- kind of meaningless for use with another spreadsheet.<br />
What the author would then do upon this inquiry is:<br />
Go to Windows New Table…:<br />
Select SectionWaveX & SectionWaveY;<br />
Click ‘Do It’- this will create an X,Y delimited table from which can be cut and pasted.<br />
None of the Asylum Research inmates will verbally condone the use of programs other than Igor Pro.<br />
12.5.3: Histogram tab<br />
The histogram tab (Figure 12.5.3.1) allows image pixels to be counted<br />
and presented- this is analogous to ‘Bearing’ analysis found in other<br />
commercial AFM software.<br />
With an image open, select ‘New’ from the Make Histogram pulldown<br />
menu.<br />
Figure 12.5.3.1: Histogram tab of<br />
the Analyze Panel.
Ryan’s MFP-3D Procedural Operation ‘Manualette’ Version 10 (v080501; Igor 6.04A); 12.28<br />
• The Histogram Graph (Figure 12.5.3.2) will<br />
appear with pixel count (Y) relative to Z scale<br />
(X). This panel has a fair amount of features-<br />
•Figure 12.5.3.3 shows two histograms<br />
excluding masked area (A), and including<br />
Masked area (B). Notice the pixels counts are<br />
much different.<br />
Figure 12.5.3.2: Histogram Graph-<br />
A<br />
6000<br />
5000<br />
4000<br />
3000<br />
2000<br />
1000<br />
B<br />
400<br />
300<br />
200<br />
100<br />
0<br />
0<br />
-3.0 -2.5 -2.0 -1.5 -1.0 -0.5 0.0<br />
-3.0 -2.8 -2.6 -2.4 -2.2 -2.0 -1.8 -1.6 -1.4<br />
µm<br />
µm<br />
Figure 12.5.3.3: Creating pixel histograms from the image in Figure 12.5.2: A) unmasked image; B) masked image.<br />
12.6: Particle analysis<br />
This particles2.ipf program was written by <strong>St</strong>efan Vinzelberg (Atomic Force F&E GmbH-an AR affiliate; long<br />
time Asylum Research technical representative in Europe) as a way to determine volume of particles, but it<br />
works well to determine area, volume or perimeter of masked regions in an image. <strong>St</strong>efan describes it as an<br />
extension of Igor’s particle analysis protocol. <strong>St</strong>efan has posted it to the AR forum, and can be found at:<br />
http://asylumforum.com/forum/showthread.php?p=1224#post1224<br />
The particle definition is based on a mask that must be generated from image analysis (see Section 12.2.3).<br />
Use the mask tool in the modify panel to define the particles. The mask must completely cover the particles<br />
of interest.<br />
Significant errors can arise from a bad definition of the surface. In order to ensure accuracy of the data my<br />
procedure uses the surrounding of each particle (defined as all pixels that lie adjacent to the particle<br />
boundary) and calculates its average height. This serves as a "local" reference plane for the volume. The<br />
integration is then simply done by summing up all the "little volumes" under each pixel. The data is<br />
exported to a table that contains also all other particle statistics from the particle analysis feature.
Ryan’s MFP-3D Procedural Operation ‘Manualette’ Version 10 (v080501; Igor 6.04A); 12.29<br />
Instructions:<br />
Go to File Open Procedure, particles2.ipf;<br />
Compile the ipf; then minimize the window.<br />
Open the image file you want to do particle analysis on; flatten and plane fit if necessary<br />
Mask it to the desired threshold- the mask must completely cover the particle(s) of interest<br />
Go to the MFP IP menu, and choose ‘Particles’; a new window appears (Figure 12.6.1).<br />
Set up the panel such that the desired parameters will be calculated.<br />
Panel parameters:<br />
Min. Pixels: determines the minimum number of pixels<br />
that are detected as a particle; helps exclude very small<br />
objects due to image ‘noise’<br />
Mask: Pull down menu to choose what image channel<br />
provides the mask that identifies the particles. Note:<br />
image must be masked first. If multiple images are open,<br />
select the proper image.<br />
Volume checkbox: if this is checked BEFORE initiating<br />
‘Do It’, two additional parameters are calculated- volume<br />
(of particle) and base height (average height level of the<br />
area right around the particle). The base height is a<br />
reference height for the volume calculation.<br />
Figure 12.6.1: Particle analysis panel:<br />
Sort by pull down: what ever value you are interested in, this will be listed in the<br />
‘Results’ table from largest to smallest. For example, Figure 12.6.2 used index as the<br />
sort by; the results table lists the index from largest to smallest.<br />
Data pull down: this pull down will be the X axis for the histogram.<br />
Reverse checkbox: this will reverse the order in the table for the ‘Sort by’ and ‘Data’<br />
pull down selections- instead of largest to smallest, it will make it smallest to largest.<br />
Excl. bound. If this checkbox is checked, all boundary particles will be excluded from the histogram<br />
‘Do It’ button: does the calculation on the data in the displayed data channel using the selected mask to<br />
identify the particles; tells you how many particles it finds shown as a log text in the history window.<br />
‘Results’ button: this function generates a table showing parameters: index, center coordinates, area (in m 2 )<br />
of each particle, and a flag called IsBoundary (which is set to 1 if the particle touches the image boundary<br />
and therefore may be incomplete, set as 0 if not touching). All these parameters can be plotted in the<br />
histogram function.<br />
‘Histogram’ button: Use Histogram Data pull down menu to choose what data is used to generate a<br />
histogram. Click Histogram button to give counts (y –axis) of what ever parameters (x-axis) you choose.<br />
Note: Surface is not yet implemented as of 7/2006.
Ryan’s MFP-3D Procedural Operation ‘Manualette’ Version 10 (v080501; Igor 6.04A); 12.30<br />
‘Values’ button: opens a table where the analysis values for a single particle are displayed. You can click on<br />
the respective particle in the image (the corresponding label will increase its size) and the table will be<br />
updated with its values.<br />
Click the ‘Do It’ button- Igor will crunch the numbers and report how many particles were found,<br />
including how many happened to be on the boundary of the scan range- reported in the History window.<br />
Also, the particles will be labeled with blue indexes on the masked image (Figure 12.6.2C).<br />
60<br />
A<br />
50<br />
B<br />
60<br />
C<br />
50<br />
2<br />
5<br />
7<br />
9<br />
40<br />
40<br />
3<br />
8<br />
12<br />
15<br />
30<br />
20<br />
30<br />
20<br />
1<br />
6<br />
11<br />
14<br />
10<br />
10<br />
0<br />
4<br />
10<br />
13<br />
0<br />
0<br />
0<br />
10<br />
20<br />
30<br />
µm<br />
40<br />
50<br />
60<br />
0<br />
10<br />
20<br />
30<br />
µm<br />
40<br />
50<br />
60<br />
D<br />
Figure 12.6.2: Particle analysis example: A) masked<br />
image; B) Panel parameters; C) labeled masked<br />
image; D) results table- Area column being listed<br />
from smallest to largest; E) histogram showing<br />
volume distribution.<br />
E<br />
• An example is seen in Figure 12.6.2: The sample is some sort of lithographically prepared circles of varying<br />
diameter. After the image is processed (planefit, flattened), a mask threshold was fit to surround each<br />
pattern (Figure 12.6.2A). With the parameters set in panel B (specifically the ‘Sort by’ pull-down set to Area<br />
and the ‘Data’ pull down set to ‘Volume’, the results are seen in Figure 12.6.2C&D. Notice the indexes are
Ryan’s MFP-3D Procedural Operation ‘Manualette’ Version 10 (v080501; Igor 6.04A); 12.31<br />
labeled according to the ‘Sort by’ and ‘Data’ pull down selections: the largest index value is for the largest<br />
area/volume; the smallest index labels the smallest area/ volume. Also notice any masked feature at the<br />
perimeter of the scan range is labeled with a blue index (Figure 12.6.2C), indicating the program is aware the<br />
feature is not fully contained in the image. This can also be seen in the results table as a ‘1’ under the<br />
IsBoundary; fully contained features are represented as a ‘0’ (Figure 12.6.2D). Figure 12.6.2E shows the<br />
resulting histogram, with the X axis as volume (because that is what the ‘Data’ pull down is set to.<br />
• Another example can be seen in Figure 12.6.3- a NSL sample from the Van Duyne lab. This example shows<br />
a better particle distribution in the histogram, relative to the example shown in Figure 12.6.2.<br />
Figure 12.6.3: Particle analysis of NSL sample: A) Masked, labeled<br />
imaged; B) corresponding volume histogram (X axis).
Ryan’s MFP-3D Procedural Operation ‘Manualette’ Version 10 (v080501; Igor 6.04A); 13.1<br />
3D Image Rendering<br />
ARgyle is the MFP-3D’s 3D image rendering<br />
software that uses open GL source code. It can<br />
produce some remarkable AFM data<br />
representations in real-time or with offline<br />
analysis with custom colors & specular lighting. It<br />
also allows multiple data channel overlay as a<br />
fourth color dimension to correlate with surface<br />
topography.<br />
Section Topic page<br />
13.1 Activating Real Time ARgyle 13.1<br />
13.2 Activating ARgyle Offline 13.2<br />
13.3 Adjusting ARgyle Parameters 13.2<br />
13.4 Other ARgyle Features 13.4<br />
13.5 Multiple Channel Overlay 13.5<br />
13.6 Exporting ARgyle Images 13.6<br />
13.7 Misc. Operations 13.7<br />
▪ There are two ways to get started using ARgyle depending on if you are imaging in real time or doing<br />
offline analysis. Turning on Real Time ARgyle will be presented first; then basic ARgyle protocol for image<br />
adjustment discussed in Section 13.2 applies whether viewing a real time image collection or an offline image.<br />
13.1: Activating Real time ARgyle:<br />
In the main toolbar of Igor, Go to MFP IP 3D surface plots. The Master ArGL Panel will come up (Figure<br />
13.1). It contains 7 tabs that are all useful in producing a fine presentation.<br />
Figure 13.1: A) New Tab of Master ArGL<br />
Panel; B) choosing the real time channel to<br />
display as an ARgyle image.<br />
In the New tab, select RealTime from the Surface pull-down menu (Figure 13.1).<br />
From the data type pull-down menu, select the channel you wish to display (Figure 13.2).<br />
For multiple channel overlay:<br />
Click the color check box to the right of the<br />
surface pull down menu.<br />
Figure 13.2: Choosing data channel to display in ARgyle.
Ryan’s MFP-3D Procedural Operation ‘Manualette’ Version 10 (v080501; Igor 6.04A); 13.2<br />
Select what channel you want to color the topography with. Channels that are open in the Master Channel<br />
tab will be available in the Data pull-down menu. See Section 13.5 for further description.<br />
Useful ARgyle Hotkeys:<br />
Crtl + left mouse button zooms the size of the image.<br />
Shift + mouse does moves the image within the ARgyle window.<br />
13.2: Activating ARgyle offline:<br />
For more about processing images in the MFP-3D software, see Section 12.<br />
Click the 3D button at the top of the<br />
display window tab that has the (processed)<br />
data that you wish to display in ARgyle<br />
(Figure 13.3). This will bring up the Master<br />
ArGL Panel (Figure 13.1A) and the ARgyle<br />
3D rendered image.<br />
If this is the first activation of the 3D image in a new MFP-3D template, it will have certain default<br />
parameters (i.e. a Zoom factor of 1 & Z scale of 0.33 in Zoom tab) that may appear off-scale (in Z) if<br />
the surface features are large relative to the XY scan area, or close to scale (in Z) if the feature are<br />
large; if you have already processed a 3D window in the current experiment, the new ARgyle<br />
image will have the same rotation, zoom, etc as the previous; it will have the same Z data scale as<br />
the 2D image in the display window.<br />
13.3: Adjusting ARgyle parameters:<br />
The author usually follows the same protocol to get a handle on the off-scale default parameter:<br />
Click on the 3D rendered image, left mouse click and rotate it to an orientation you are happy with. The<br />
author usually rotates it to a top down view.<br />
In the Prefs tab, choose the background color you prefer.<br />
Figure 13.3: selecting 3D button calls up ARgyle windows.<br />
In the View tab, select ‘None’ from the Clip pull-down menu; choose Zoom from the View Mode pull-down<br />
menu.<br />
A<br />
B<br />
C<br />
Figure 13.4: Re-scaling the Z axis in Argyle images.
Ryan’s MFP-3D Procedural Operation ‘Manualette’ Version 10 (v080501; Igor 6.04A); 13.3<br />
Check the ‘Aspect 1’ checkbox (Figure 13.4A), this will scale the Z data to the XY data (Figure 13.4B). If this<br />
isn’t enough Z scaling, adjust the Z scale parameter to larger value (Figure 13.4C). A Z scale of 0 will effectively<br />
create a 2D image.<br />
• Activating the ‘All’ checkbox in the upper left corner of most tabs, applies the ARgyle parameter settings to<br />
all open images.<br />
A B C<br />
Figure 13.5: Examples of adjusting the Data offset in an ARgyle image: B) -61.nm ; C) 206.6 nm. Color ‘Cold Warm’.<br />
In the View tab, select ‘Data Scale’ from the View Mode pull-down menu. Here you can adjust the Z scale of<br />
the data just as you can in the display window – use left vertical slider bar, or data scale ‘setvar’. The ‘Data<br />
Offset’ – essentially where the plane of the image sits within the color scale (color bar). Figure 13.5 B & C<br />
shows an example of changing the Data Offset.<br />
COLOR TABLES-<br />
In the Display tab, choose an appealing color from the ColorMap pull-down menu; Notice you can invert the<br />
Z scale or color. Custom colors tables can also be generated by choosing ‘Define Custom’. The author has little<br />
mastery of this process, but it’s fun to try.<br />
Adjust other values such as the Data scale values, light rotation, zoom and offset. Background colors are<br />
found under the ‘Prefs’ tab.<br />
To add Specular lighting, go to the Lights tab, click the shiny check box (Figure 13.6). The percent of<br />
specular light can also be defined in the ‘Factor’ setvar.<br />
▪ Lighting (either normal or specular) can be adjusted by holding the right mouse over the 3D rendered<br />
image, and moving it around the image until an appealing angle is achieved. Adjust light to hide scan<br />
lines for better presentation.<br />
▪The light rotation and pitch setvar values can be viewed in the Light Rotation sub-tab of the View tab
Ryan’s MFP-3D Procedural Operation ‘Manualette’ Version 10 (v080501; Igor 6.04A); 13.4<br />
A<br />
B<br />
Figure 13.6: Adding Specular lighting to the ARgyle image in the Lights tab. A) Click ‘Shiny’ checkbox ; Color of<br />
Specular lighting can be selected (in Color pull down menu), as well as ‘Percent’ intensity; B) Specular light can be<br />
seen as sheen in image- allows visualization of small feature shadows on the surface not readily apparent without<br />
light.<br />
▪To render ARgyle image as an anaglyph (for use with 3D glasses), the back ground of the image must be<br />
black (choose in Prefs tab), or an error message will come up; then in command line-<br />
To turn ON Anaglyph in ARgyle window type: Argl_WriteValue(“”,”anaglyph”,1)<br />
To turn OFF Anaglyph in ARgyle window type: Argl_WriteValue(“”,”anaglyph”,0)<br />
13.4: Other ARgyle features:<br />
▪The image can be set to spin automatically.<br />
Select Spin from the View Mode pull down menu in the View tab (Figure 13.7).<br />
▪ ARgyle image axes, and ticks can be adjusted in the Axes tab.<br />
▪ Axis fonts, font sizes and background colors are can be adjusted in the Prefs tab.<br />
Rotates image<br />
about this axis<br />
Rotates image<br />
about this axis<br />
Figure 13.7: Setting automatic spin of ARgyle image: Lower slide bar spins about the image plane; slider bar sets the<br />
speed; Vertical bar spins
Ryan’s MFP-3D Procedural Operation ‘Manualette’ Version 10 (v080501; Igor 6.04A); 13.5<br />
Clip Mode: The author finds this function difficult to describe- this is typically set to ‘None’ during use,<br />
adjusting the Zoom scale and /or data scale instead. That being said, this feature can come in handy for<br />
presentation. It’s best to experiment with it to figure out what it does, but here’s the author’s attempt to<br />
visually describe the functions.<br />
• Figure 13.8 shows an image of a nanosphere lithography (NSL) pattern with an exaggerated Z scale. Panel<br />
A) shows the ‘Clip’ pull-down set to ‘None’; Panel B) shows the ‘Clip’ pull-down set to ‘Clip’- the higher asperity<br />
features are clipped set to some limit such that the ARgyle image appears to have holes where the NSL<br />
asperities are; Panel C) shows the ‘Clip’ pull-down set to ‘Clamp’- the higher asperity features are clamped set<br />
to some limit such that the ARgyle image appears to have plateaus where the NSL asperities are.<br />
A<br />
B<br />
C<br />
Figure 13.8: Clip mode function: A) none: B) clipped; C) clamped; Nanosphere lithography sample courtesy R. Van<br />
Duyne, Northwestern <strong>University</strong>.<br />
Windows tab: This tab just manages the ARgyle windows when they are up. The author typically doesn’t<br />
use this tab because it would be too organized.<br />
▪ Movies can be made with ARgyle image. Contact Support@AsylumResearch for this instruction file.<br />
Essentially this program takes defined ARgyle angles, rotations and zoom factors and strings these values<br />
together to make a continuous movie that seamlessly changes the user defined selections. Contact<br />
Support@AsylumResearch for this instruction file.<br />
13.5: Multiple Channel Overlay:<br />
Overlaying channels in ARgyle is as simple as a<br />
couple mouse clicks-<br />
In the New tab of the Master ArGL Panel, choose<br />
the image and image channel you want the<br />
topography to be displayed (i.e. the image that<br />
will have 3D rendering to it).<br />
Click the color checkbox , and then choose<br />
the same image file, and the other data channel<br />
that you want to over lay (Figure 13.9). Make sure<br />
to keep the same direction in the overlay for<br />
proper registration (i.e. Trace with Trace).<br />
Figure 13.9: Overlaying image channels in ARgyle.
Ryan’s MFP-3D Procedural Operation ‘Manualette’ Version 10 (v080501; Igor 6.04A); 13.6<br />
▪Figure 13.10 shows an example of overlaying the phase channel onto topography. The sample is a polymer<br />
material imaged in air with AC mode- notice the interesting phase data doesn’t necessarily correlate with the<br />
topography data.<br />
1.0<br />
Height Trace<br />
0.8<br />
0.6<br />
µm<br />
0.4<br />
0.2<br />
10<br />
5<br />
0<br />
-5<br />
-10<br />
nm<br />
0.0<br />
0.0 0.2 0.4 0.6<br />
µm<br />
1.0<br />
Phase Trace<br />
0.8<br />
1.0<br />
0.8<br />
0.6<br />
µm<br />
0.4<br />
0.2<br />
6<br />
4<br />
2<br />
0<br />
-2<br />
-4<br />
-6<br />
Deg<br />
Figure 13.10: Example of Phase Channel (color) overlay on height<br />
channel (topography). Color ‘Desert Solitude’<br />
0.0<br />
0.0<br />
0.2<br />
0.4 0.6<br />
µm<br />
0.8<br />
1.0<br />
▪ The old school way to accomplish channel overlay is to use the command lines: If your MFP-3D has older<br />
software on it….<br />
Process your two channels to your liking (i.e flatten, mask, pick colors). Create an ARgyle image for each<br />
image channel. One of the channels needs to be grayscale (height), while the other is some color (phase).<br />
Adjust the z scale to 0 for the color channel<br />
In the command line, type: argl_bindmesh(“filename/suffix”,”filename/suffix”)<br />
Its best to type exactly what the window is called in the title bar- if something is wrong, Igor will let you know.<br />
13.6: Exporting Images-<br />
The are many ways to export images from the ARgyle window:<br />
Make the 3D image window the forward-most image (active window), Copy to clipboard, and dump into<br />
another program (Paint, Photoshop, PowerPoint, etc.)<br />
-OR-<br />
Go to the Edit menu of the Main Igor tool bar; select ‘Export Graphics…’ select type of file you want to<br />
export it as (TIFFs are larger files than JPEGs, but they are lossless)<br />
-OR-<br />
Click ‘Export to Layout’ button in New tab of the Master ArGL Panel. Learn more about Igor Layout<br />
windows in Section 14- Misc. Procedures.<br />
Command line export: export a 2x, 3x, 4x by typing argl_export2("", "outfile path", 0, 0, cx, cy) into the<br />
command line. The max of cx and cy are 4k x 4k.
Ryan’s MFP-3D Procedural Operation ‘Manualette’ Version 10 (v080501; Igor 6.04A); 13.7<br />
13.7: Misc. Operations-<br />
Scott MacLaren (UIUC- Materials Research Lab) taught me this trick: Say you want to do have a 3D rendering<br />
of some material that has smaller features some larger curvature of radius (i.e., large spheres or hair are great<br />
examples). Problem is that the finer details topography features don’t get colored well in ARgyle due to the<br />
extreme changes in Z scale of the material.<br />
What you want to do is flatten a height image channel with a second order flatten to take out large scale<br />
the curvature of the material, and then overlay onto a non-flattened (or zero order flattened) Z sensor or<br />
copied height channel.<br />
40<br />
40<br />
µm<br />
30<br />
20<br />
µm<br />
30<br />
20<br />
10<br />
10<br />
0<br />
0<br />
10<br />
20<br />
µm<br />
30<br />
40<br />
0<br />
Figure 13.11: Using ARgyle to accentuate smaller surface<br />
features onto materials with large radii of curvature: A) Non<br />
flattened Z sensor image, painted with B) 2 nd order flattened height<br />
channel; resulting in C) 4D rendering of overlaid images.<br />
0<br />
10<br />
20<br />
µm<br />
30<br />
40<br />
Using ARgyle, overlay the 2 nd ordered flatted onto the other, such that the 2 nd order flattened is the colored<br />
layer- it will bring out the smaller features much better than without. Figure 13.11 shows an example of this<br />
technique.<br />
Cell Images-<br />
Another trick to display cells is to paint the error signal over the height. For example, amplitude painted onto<br />
Height/ Z sensor; or Deflection onto Height/ Z sensor.<br />
Figure 13.12: A) Fibroblasts on glass; B) Amplitude painted onto Z sensor channel, with some<br />
blue colored specular lighting added.
Ryan’s MFP-3D Procedural Operation ‘Manualette’ Version 10 (v080501; Igor 6.04A); 13.8<br />
Force Map on AFM channel-<br />
Force maps can also be overlaid onto another AFM channel. Here’s an example of adding a force array overlay<br />
onto a lateral image, shown in Figure 13.13. The sample is a micro contact printed mercapto undecanoic acid<br />
(-COOH terminus), back filled with dodecanethiol (-CH 3 terminus). The Au coated SiN x tip had the acid thiol on<br />
it is well, and was acquired in a pH 4 buffer standard. The example was done in moderate haste to show this<br />
can be done, and seems to correlate reasonably well.<br />
The array map was analyzed in the Analysis tab of the Force Display Panel. See Section 11.2. for further<br />
description.<br />
40<br />
30<br />
10<br />
5<br />
µm<br />
20<br />
0<br />
mV<br />
10<br />
-5<br />
-10<br />
0<br />
0<br />
10<br />
20<br />
30<br />
40<br />
µm<br />
µm<br />
30<br />
20<br />
10<br />
0<br />
25<br />
20<br />
15<br />
10<br />
5<br />
0<br />
nN<br />
Figure 13.13: Overlaying a force array image onto a<br />
lateral force microscopy image.<br />
0<br />
10<br />
20<br />
30<br />
µm
Ryan’s MFP-3D Procedural Operation ‘Manualette’ Version 10 (v080501; Igor 6.04A); 14.1<br />
This section has some stuff in it that the author finds valuable to exercise<br />
while using the MFP-3D. Some are commonly used, some are transparent,<br />
and others are rarely used, but hopefully this collection can help someone<br />
out.<br />
Section Topic Page<br />
14.1 Lifting the tip off the surface: 14.1<br />
14.2 Saving Graphics 14.2<br />
14.3 Exporting waves to .txt format 14.2<br />
14.4 Exporting Waves in Igor 14.3<br />
14.5 Engaging on reflective surfaces 14.3<br />
14.6 AR video window 14.4<br />
14.7 Guess-timating scan area 14.6<br />
14.7b Centering tip in center of scan area 14.6<br />
14.8 Video Calibration Panel 14.7<br />
14.9 Tip NudgerXYZ 14.8<br />
14.10 Adjusting Mis-Aligned Mirror to View Cantilever 14.8<br />
14.11 Smart <strong>St</strong>art 14.9<br />
14.12 Igor Electronic Notebooks 14.10<br />
14.13 Igor/ MFP-3D Layouts 14.10<br />
14.14 Creating User Panels 14.11<br />
14.15 Running MFP-3D on laptop 14.12<br />
14.16 Installing multiple copies of MFP-3D software 14.13<br />
14.17 Determining the MFP-3D software version of a saved expt 14.15<br />
14.18 Installing a grid on image screen 14.16<br />
14.19 Deactivating Closed Loop Scanner 14.17<br />
14.20 Sum & Deflection Meter Freeze 14.17<br />
14.21 Rescan Bus 14.17<br />
14.22 Igor Hot keys 14.18<br />
14.23 User Profiles 14.18<br />
14.24 COMMON (Command line) COMMANDS 14.19<br />
14.1: Lifting the tip off the surface:<br />
Anytime you need to adjust something where it’d be a good idea to lift the tip off the surface BUT don’t want<br />
to disengage (i.e., withdraw the tip), just adjust the Set Point voltage to the false engaged side of the free air<br />
voltage to lift the tip off the surface. This can be done with the Hamster wheel or manually typing in the setvar<br />
parameter window. Why would one want to do this???<br />
When shutting the door on the acoustic enclosure<br />
Changing image resolution<br />
Adjusting PD deflection: CAUTION will likely move tip position up to a couple μm’s just by touching the head-<br />
Adjusting thumbwheel position<br />
▪ If in AC mode, increase the Set Point voltage to above the ‘free air’ amplitude- notice the Z Piezo voltage will<br />
decrease.
Ryan’s MFP-3D Procedural Operation ‘Manualette’ Version 10 (v080501; Igor 6.04A); 14.2<br />
▪ If in Contact mode, lower the Set Point voltage to a value more negative than the ‘free air’ deflection.<br />
14.2: Saving Graphics:<br />
First you must ‘Create a path’ in Igor: (see Figure 7.2.3 for more detailed description).<br />
Go to Misc → New Path… ; create name, and then choose a path (the folder you are going to want stuff<br />
dumped when you save it).<br />
Bring the window you want to save an image of as the forward-most window.<br />
Go to File → Save Graphics …: a dialogue appears offering choice of what kind of file you want to save<br />
image as, actual dimensions & filename. Also, this is where to choose the path that was just created in the<br />
‘path’ pull down menu. Otherwise, it gets dumped deep within the bowels of the Wavemetrics folder in the<br />
program files. See Section 7.2 for a more complete description of this.<br />
14.3: Exporting waves to .txt format:<br />
-Create a place to dump the curves for them → i.e., create a Path in Igor- someplace that will show up in the<br />
path box in the ‘Save Delimited Text’ dialogue box, described above.<br />
Go to Misc → New Path .<br />
Make Filename of your choice.<br />
Click ‘Path’ → choose where you want to dump it;<br />
Click ‘Do it’.<br />
1) Exporting single waves-<br />
Note: go to data folders → click review force curve checkbox.<br />
Go to data → load waves → Igor binary: brings up browsing dialog.<br />
Select the curve you want, then a new dialogue asking if you want to copy: Click the ‘OK’ button.<br />
Go to Data → SaveWaves → Save delimited text.<br />
Find wave name in Wave(s) menu & choose path in ‘Path’ box pull down; click the ‘Do It’ button.<br />
Check to see if the wave is installed where asked to be (and if tab delimited) by going to the place where<br />
you dumped it. Open it w/ Notepad to make sure it’s tab delimited<br />
2) Exporting as Batch file:<br />
The easiest way the author knows how to export as a Batch file is to use Chad Ray’s Force Volume Mapping<br />
macro. The name of the program is Chad0. Contact support@asylumresearch.com for the package of .ipf files.<br />
Ask for v060404.<br />
It’s easy to install, just click on the executable file, tell it where to install (which Igor Pro Folder, if that applies)<br />
and it installs the files where they need to be in the MFP-3D files to work.<br />
Go to MFP controls → Force Mapping.
Ryan’s MFP-3D Procedural Operation ‘Manualette’ Version 10 (v080501; Igor 6.04A); 14.3<br />
This brings up a small, busy dialogue with a Duke logo.<br />
Click on ‘Export‘, choose place where you want curves to get dumped.<br />
Confirm the ‘Single Note’ checked - this gives only one file with parameter info.<br />
Click on ‘Export’ button; look for the Igor processing quadrant circle (lower left tray) processing thing in the<br />
lower left of the MFP3D window.<br />
▪ This batch export feature automatically creates an ‘Export Folder’ in the same folder where the Force curve<br />
data is (.ibw files) filled with converted tab delimited files. This way is much easier, only flaw of the program is<br />
that it doesn’t put name of individual curve at top, like you can in single export protocol.<br />
14.4: Exporting Waves in Igor-<br />
You can export any wave in Igor. 90% of the battle is finding the wave.<br />
For any wave displayed on a graph:<br />
Double click on the wave. The ‘Modify Trace’ dialog will appear.<br />
*Hold Down* the left mouse button on the name of the wave that looks like the correct wave. The box<br />
below then shows the data folder that is holding that wave.<br />
Go to the Data → Data Browser menu.<br />
Locate the data folder that was shown by the dialog.<br />
Alt + left mouse click to the left of that data folder. There should now be a red arrow pointing at that folder<br />
and letting you know that you are sitting in that folder.<br />
Go to the Data→ Save Waves→ Save Delimited Text menu.<br />
Select the wave from the list of waves in that data folder.<br />
Click ‘Do it’. Then select where you want to save that .dat file.<br />
14.5: Engaging on reflective surfaces:<br />
Aside from monitoring the ‘free air’ amplitude in the S&D meter while engaging (as described in Section<br />
6.1.2), the CCD camera can also be used when engaging on reflective surfaces to monitor relative tip substrate<br />
separation based on the cantilever shadow distance from actual cantilever. Focus CCD onto cantilever, then<br />
focus just slightly beyond that- this will allow surface to come into focus when tip nears it. Figure 14.5.1<br />
shows this sequence- A) tip is far away- notice no reflection of cantilever on surface, and calibration grid<br />
feature no well resolved; B) after wheeling down, the reflection of the cantilever can be seen, and grids<br />
features start to come into focus; C) Cantilever very near surface, reflection and image of cantilever almost<br />
overlapping; grid also in better focus. When the tip is engaged, the cantilever reflection should not be seen.
Ryan’s MFP-3D Procedural Operation ‘Manualette’ Version 10 (v080501; Igor 6.04A); 14.4<br />
A B C<br />
Figure 14.5.1: Engaging on reflective surfaces-focus on tip: A) No cantilever shadow is visible because the tip is too far<br />
away from the surface; B) moving tip towards surface, cantilever shadow becomes present, surface coming into focus;<br />
C) moving tip closer to surface- cantilever shadow almost eclipses cantilever- surface is in focus (it’s a calibration grid).,<br />
Another tip Scott MacLaren taught the author: If using a ‘<strong>St</strong>and Alone’ base, you can change the aperture to<br />
slightly closed, so you get a bit of shadow around the edges of the video window. As the tip approaches the<br />
surface, the image of the surface will come into sharp focus. This process allows the tip to be brought towards<br />
the surface quickly with the thumbwheel for a coarse approach, then slowed for engagement.<br />
14.6: AR Video Panel<br />
To capture images (or acquire movies) from the CCD camera, the AR video panel is needed.<br />
Go to MFP-Controls→Video Panel; the AR Video Panel appears (Figure 14.6.1A).<br />
Click on top view or Bottom view if you have a Dual View <strong>St</strong>and Alone base.<br />
Have the Scale Image checkbox checked if you have calibrated the image (See Section 14.8); if the image<br />
hasn’t been calibrated, the scale on the axis isn’t accurate.<br />
Confirm the image is in the desired focus.<br />
To save images, click the ‘Save to Disk’ checkbox, or ‘Save to Memory’ checkbox, its best to save as .tiff<br />
or .ibw file.<br />
Click the ‘Capture’ button; the new image should be displayed immediately (Figure 14.6.1B).
Ryan’s MFP-3D Procedural Operation ‘Manualette’ Version 10 (v080501; Igor 6.04A); 14.5<br />
A<br />
B<br />
Figure 14.6.1: A) AR video panel- use this panel to capture images from the CCD camera; capture movies of the<br />
CCD, or to show the scan box (see Section 14.X); B) example ‘magnified’ top view image of cantilever.<br />
To get an assessment of the scan area relative to the cantilever position, click the Show Scan Box <br />
checkbox.<br />
On the displayed image, place cursor towards end of cantilever, right click mouse and select Set Tip<br />
Location (Figure 14.6.2A); this will present a red circle indicating tip location (just as in the ‘Point and Click’<br />
functions in ‘Go There’ subtab (See Section 11.X).<br />
Activate the Show Scan Box checkbox; two squares will appear on the displayed image- the outer square<br />
shows the entire XY range (90μm) ; while the inner square shows the Scan Area relative to the XY offsets.<br />
A<br />
B<br />
C<br />
D<br />
Figure 14.6.2: Scan range box in AR Video Panel: A) setting tip location; B),C), D)- different scan areas and XY offsets<br />
(indicated below CCD image).<br />
▪ As the scan area and or XY offsets are changed, this is immediately updated in the display window (Figure<br />
14.6.2 B-D).
Ryan’s MFP-3D Procedural Operation ‘Manualette’ Version 10 (v080501; Igor 6.04A); 14.6<br />
Capturing movies:<br />
Movies of the CCD images can also be captured with the AR Video panel.<br />
Select a capture rate of no more than a couple Hz- more than that, Igor will have trouble with collected a lot<br />
of frames per second.<br />
Choose file type to save as (it’s recommended to choose .ibw or .tiff as the file type).<br />
Give it a filename.<br />
Click the ‘<strong>St</strong>art Background Capture’ button- this will start collecting at the specified rate.<br />
When finished, click the ‘<strong>St</strong>op Background Capture’ button.<br />
Once complete, click the ‘Make Movie’ button designate a frame rate for the movie; the movie will be strung<br />
together into a movie file.<br />
14.7: Guess-timating scan area:<br />
Here’s how to roughly determine if the selected scan area will contain a feature of interest as seen in the Top<br />
View CCD camera- this method is a quick and easy way to figure out if the scan area will reach the sample area<br />
of interest in the CCD image without calibrating the Video Panel (see Section 14.8).<br />
Increase the Set Point voltage (if in AC mode) past the ‘Free Air’ amplitude voltage so the tip comes off the<br />
surface (See Figure 6.1.5); if in Contact mode, decrease the Set Point voltage past the free air deflection<br />
voltage so the tip comes off the surface (See Figure 8.3).<br />
Click ‘Frame Up’ button, watch are where tip scans over in the CCD camera; the orange lines in Figure<br />
14.7A (installed by the author for demonstration purposes) give an example of where the tip traced over the<br />
sample<br />
Click ‘Frame Down’ button and watch where this scans over.<br />
A<br />
Figure 14.7: Guess-timating scan area relative to CCD camera image<br />
• Make adjustments to coarse XY position micrometers, or XY scan area if necessary<br />
14.7B: Centering tip in center of scan area in CCD image<br />
Go to Force tab in the Master Panel; with no spots selected, have suffix on zero, click ‘Go There’ buttonthis<br />
will put tip in center of scan area.<br />
• The tip will now be in the center of its scan range
Ryan’s MFP-3D Procedural Operation ‘Manualette’ Version 10 (v080501; Igor 6.04A); 14.7<br />
14.8: Video Calibration Panel:<br />
The CCD image can be calibrated such that the scale bar along the<br />
X&Y axis of captured / displayed CCD images is accurate. This process<br />
is very easy to do, and it’s described in full detailed in a User Panel. It’s<br />
best to use a diving board cantilever for this.<br />
Go to Programming → <strong>St</strong>art user panel;<br />
Double click on Video Calibration, which brings up the AR video<br />
calibration panel (Figure 14.8), and a Help menu that walks you<br />
through it. This protocol is very easy to follow along with.<br />
Confirm that CCD camera is on, and cantilever is in focus- the tip<br />
doesn’t have to be engaged with sample.<br />
Confirm that the probe is oriented in its pocket such that the<br />
cantilever length is parallel to the X axis of the CCD window.<br />
Enter nominal dimensions of cantilever into ‘Lever Length’ and<br />
‘Lever Width’ setvar windows. The default cantilever in the panel is for<br />
a Olympus AC 240 (i.e., 240 μm long, about 30 μm wide)<br />
Turn off Scale Image checkbox<br />
Figure 14.8: the AR Video Calibration<br />
Panel<br />
Click ‘Capture’ button<br />
Click ‘Display’ button<br />
On the new display image, call up the Igor cursors (Crtl + i)<br />
Place the cursor at the end of the cantilever, place the cursor at the base<br />
Click the ‘Calibrate Length (X)’ button<br />
Place the two cursors at each side of the cantilever to measure its width<br />
Click the ‘Calibrate Length (Y)’ button<br />
Click the ‘Video Parms’ button<br />
▪The Pixel Size setvar should now be updated- it’s not a bad idea to jot that down somewhere in case you’ll be<br />
using multiple CCDs (i.e., top and bottom views) during the experiment.<br />
Now when the Capture button is clicked, the Displayed images should be to proper scale-<br />
If more precision is needed for the calibration, reticle calibration grids can be sued to calibrate the X&Y<br />
lengths.
Ryan’s MFP-3D Procedural Operation ‘Manualette’ Version 10 (v080501; Igor 6.04A); 14.8<br />
14.9: Tip NudgerXYZ:<br />
This is something very useful if the tip must be moved to a surface feature (in closed or open loop) that is<br />
resolvable in the CCD camera. It’s also very intuitive to use-<br />
In the main menu, go to Programming <strong>St</strong>art user Panels.<br />
Double click on ‘NudgerXYZ’; the panel resembling Figure 14.9 will appear.<br />
Enter a desired step size that you wish to step the tip with in the ‘<strong>St</strong>ep Size’ setvar window.<br />
Activate the X, Y or Z axis checkboxes if you want the nudge to occur under Closed Loop control or Open<br />
Loop.<br />
Click the desired axis direction- depending on the step size, the tip’s movement can be seen visually, and<br />
there is typically a concomitant scanner noise.<br />
A<br />
B<br />
C<br />
Figure 14.9: NudgerXYZ panel with X&Y closed loop movement<br />
activated; step size of 20µm; B) CCD image of tip near some debris<br />
on surface (as reference); C) one downward Y click moves<br />
cantilever 20µm.<br />
14.10: Adjusting Mis-Aligned Mirror to View Cantilever-<br />
Sometimes the previous user can mis-align the X&Y knobs on the top view optics mirror so much that the<br />
cantilever can’t readily be found in the top view CCD- this problem becomes compounded if the focus is also<br />
screwed up.<br />
-Instead of blindly manually rastering the mirror looking for the tip, here’s a quick way to fix this problem:<br />
make sure a probe is in the tip holder to give a correct target for you.<br />
Look straight down into the mirror housing (i.e., plumb), just as the light path does (see Figure 14.10A)<br />
Look for crisp clear trapezoid shape of quartz window. To assist this, wave your finger in front of the<br />
window and look for the fleshy color of your finger in the mirror (Figure 14.10B); also notice the opaque area<br />
of cantilever holder. The author looks for the crisp line between the opaque area and the clear quartz window.<br />
Move the XY mirror positioning knobs to bring cantilever into middle of trapezoidal window.<br />
Once the mirror is positioned correctly, the cantilever should be easily viewed (Figure 14.10C)
Ryan’s MFP-3D Procedural Operation ‘Manualette’ Version 10 (v080501; Igor 6.04A); 14.9<br />
Place the head back over the sample, and focus to suit needs.<br />
A<br />
B<br />
C<br />
Figure 14.10: Re-aligning a misaligned top view optics mirror to view the tip.<br />
14.11: Smart <strong>St</strong>art:<br />
Sometimes when switching between software versions (old<br />
vs. newer), or if there has been a repair performed on some<br />
hardware, there are calibration files that change, highlighted<br />
in red in the far left. Smart<strong>St</strong>art will catch this, and bring up<br />
the ParmPanel window (Figure 14.11.1) asking the user to<br />
change the calibration in the software so the measurements<br />
are precise.<br />
This panel can seem a bit of a sensory overload initially, but<br />
it’s relatively easy to deal with-<br />
Look at the ‘Use This’ column (far right, Figure 14.11.1) and<br />
read the value for any row that is highlighted in red.<br />
In that same row, compare the ‘Software’ and ‘Harware’<br />
column values and ‘move->’ the value that is different from<br />
the ‘Use This’ column. In the case of Figure 14.11.1, the<br />
author would move all the ‘Software’ values to the ‘Use This’<br />
column, easily executed by clicking the ‘Move All->’ button<br />
at the top of the column.<br />
Click the ‘Use the ‘Use This’ Values’ button at the bottom<br />
of the panel. This will activate the button below it.<br />
Click the ‘Save the ‘Use This’ Values to Software’ button.<br />
The process is now complete and the window can be killed.<br />
Figure 14.11.1: Parm Panel
Ryan’s MFP-3D Procedural Operation ‘Manualette’ Version 10 (v080501; Igor 6.04A); 14.10<br />
14.12: IGOR ELECTRONIC<br />
NOTEBOOKS:<br />
Igor has a great feature in it that allows electronic<br />
Notebooks to be generated.<br />
Go to to Windows New Notebook; a dialogue<br />
will come up asking if you want plain text or<br />
formatted text – choose formatted.<br />
Click the ‘New’ button.<br />
• A window like the one in Figure 14.12 will come up that you can type in, or paste images from copying any<br />
of the image in the Igor or MFP-3D software windows. Use the Ctrl + T shortcut to bring up the Igor Tool box.<br />
Figure 14.12: Igor Notebook offer convenience for monitoring the progression of an imaging or experiment<br />
session.<br />
▪The notebook can be saved as any number of Igor based file extensions (*.ifn, *.ipf, *.ihf), a text file (.txt), a<br />
windows rich text file (.rtf), or HTML file.<br />
To save, go to File Save Notebook, or Save Notebook As…<br />
14.13: Igor/ MFP-3D Layouts:<br />
Additionally, the MFP-3D software has these items<br />
called ‘Layouts’ , and they’re not kidding when the say<br />
they are awesome!<br />
Any data you have worked up in the offline analysis<br />
can be dumped into one of these layouts by click the<br />
layout button. See section 7.7E.<br />
Figure 14.13: A) Saving Graphics file: choose filename, type and Path; B) Igor layout
Ryan’s MFP-3D Procedural Operation ‘Manualette’ Version 10 (v080501; Igor 6.04A); 14.11<br />
Using the Igor tool box (Crtl + T), lines, text and nudgers can be applied to the Layout.<br />
Copies of most panels can be pasted into the<br />
Layout.<br />
A<br />
To save the layout, go to File Save Graphics.<br />
The Save Graphics File dialogue comes up- here you<br />
can determine what file type to save the file as; the<br />
name; and the Path (see Section 14.2)<br />
• The layout can then be called up promptly as an<br />
image- similar to a page in a notebook.<br />
14.14: Creating User Panels<br />
This has to be one of the most useful things I have<br />
seen to customize your own imaging parameter<br />
panels, such that all the imaging parameter setvars<br />
and buttons are all located in one place.<br />
In the main menu of the MFP-3D software- Go to<br />
Programming <strong>St</strong>art User Panel. The ARUP manager<br />
panel will come up (Figure 14.14.1A). There are<br />
already some canned panels in here that you may or<br />
may not be familiar with.<br />
Type what you would like your panel to be called in<br />
the empty ‘New Panel Name’ window at the top.<br />
B<br />
Figure 14.14.1: Creating custom panels with the<br />
AR User Panel. B) new panel to paste parameters<br />
in..<br />
Click the ‘<strong>St</strong>art’ button. A window similar to the one<br />
in Figure 14.14.1B will appear.<br />
• Notice it is empty (awaiting functions to be pasted<br />
in), and that the standard Igor tool box (Crtl + T) is<br />
present in all MFP-3D panels. For more on Igor tool<br />
box, see the Igor ‘Getting <strong>St</strong>arted’ manual that comes<br />
with Igor Pro.<br />
• At this point parameters/ function setvars/ buttons/<br />
radio buttons can be copied and pasted from other<br />
MFP-3D software panels.<br />
Here’s an example of making a very simple panel for<br />
scan control-<br />
In the open title box at the top of the ARUP Manager<br />
Panel, type the desire file name (Figure 14.14.1A).<br />
Figure 14.14.2: Imaging panel created by the author<br />
Click the ‘<strong>St</strong>art’ button; the new blank user panel will appear (Figure 14.14.1B).
Ryan’s MFP-3D Procedural Operation ‘Manualette’ Version 10 (v080501; Igor 6.04A); 14.12<br />
• An example of a custom panel the author made for imaging is presented in Figure 14.14.2.<br />
• Figure 14.14.3 shows a sequence of preparing a custom user panel-<br />
Copy desired parameter controls for other MFP-3D software panels (Figure 14.14.3A).<br />
Paste in New User Panel (Figure 14.14.3B).<br />
Rearrange highlighted parameters with the mouse, or keyboard arrows (Figure 14.14.3C).<br />
▪ Background color or text can be added using the Igor Tool Box and clicking on feature of interest desired to<br />
be changed. For example, the color in Figure 14.14.2, 14.14.3D was created by drawing a rectangle around<br />
the new parameters bank, then double clicking inside that rectangle to bring up the modify dialogue.<br />
To make the new user panel become effective, it must be closed, then re-opened. This process helps link the<br />
newly copied parameter banks make the proper links with the XOP in the software.<br />
A<br />
B<br />
C<br />
D<br />
Figure 14.14.3: Constructing a simple custom User Panel: A) copying parameters from existing<br />
MFP-3D panel; B) Pasting in New User Panel; C) Rearranging in New user Panel; D) adding<br />
background color for finished user panel: Look Familiar?<br />
14.15: Running MFP-3D on laptop computer-<br />
The MFP-3D can easily be run off a laptop computer- it helps to have a<br />
good video card and plenty of RAM to do this- so you can do the<br />
ARgyle stuff with no perceivable delay. There are some considerations<br />
that must be made before using a laptop computer to run the MFP-3D:
Ryan’s MFP-3D Procedural Operation ‘Manualette’ Version 10 (v080501; Igor 6.04A); 14.13<br />
Make sure you have the MFP-3D drivers (contact support@asylumreseach.com).<br />
• Since many laptop computers don’t have video ports, you must run the CCD camera output to spare<br />
monitor via S-video (MFP-3D Bio top view) or composite (MFP-3D SA) jack from the CCD to the monitor.<br />
Because of this, the AR video panel capturing protocol is not of much use in this configuration.<br />
For an additional monitor, use the 9 pin serial port on the laptop computer to run second flat panel. If your<br />
laptop happens to have a digital port, that works too.<br />
S-Video<br />
Composite<br />
Serial<br />
USBs<br />
14.16: INSTALLING MULTIPLE COPIES OF MFP-3D<br />
SOFTWARE-<br />
Having multiple copies (i.e., different versions) of the MFP-3D software<br />
can be very useful, especially when you put a cutting edge (Beta)<br />
version to use some new feature, while having a ‘stable’ version that<br />
isn’t buggy with other features that the beta version may possess/ offer<br />
conflict.<br />
Download the new executable from the AR Forum, or email<br />
support@asylumresearch.com for this link, or what version you may be<br />
interested in.<br />
Copy the Igor Pro folder in the Wavemetrics folder; this usually lives in<br />
the program files folder in Windows XP (see Figure 14.16.1); as you can<br />
see from the file manager, the author has more than one.<br />
Rename this ‘Copy of Igor Pro Folder’ to the software version;<br />
example ‘071217 Igor Pro Folder’.<br />
Double click on the new software version executable file. Dialogues<br />
that come up during this process are:<br />
-Welcome;<br />
-Important notes; bug fixes listed here- a useful read for the power user<br />
-Software License agreement; click Yes<br />
Figure 14.16.1: copying Igor Pro<br />
folder<br />
-Choose Destination location- this one is important- you want to choose the folder you just created- the<br />
default is<br />
C:\Program Files\WaveMetrics\Igor Pro Folder<br />
…But don’t put it there! Click the ‘Browse’ button to bring up the Choose Directory dialogue; find the newly<br />
created Igor Pro folder copy. It kind of has that Windows 3.0 look and feel, so often you have to double click<br />
on the Wavemetrics folder to see all the copies of Igor Pro folder.
Ryan’s MFP-3D Procedural Operation ‘Manualette’ Version 10 (v080501; Igor 6.04A); 14.14<br />
Make sure to double click on the desired copied folder<br />
and that this path appears in the ‘Path’ window before<br />
you continue to the next step (Figure 14.16.2). If not, it<br />
will seriously confuse Igor and the experiment crashes<br />
(speaking from experience…).<br />
Click ‘OK’; this will take you back to the ‘Choose<br />
Destination Location’ dialogue.<br />
Click ‘Next’; this will bring up the ‘Select Components’<br />
dialogue.<br />
Click the Igor Windows IBW thumbnail extensions <br />
checkbox- this is useful for looking at image parameters<br />
in windows explorer or my computer. (See Section 12.1.4<br />
for more on thumbnail viewer extensions).<br />
Figure 14.16.2: Choosing proper location in Choose<br />
Directory dialogue.<br />
Click ‘Next’ button- this will bring up the ‘Ready to Install’ dialogue.<br />
Click ‘Next’ button to start the software loading process.<br />
Once the process is finished, click the ‘Close’ button: Typically, the computer must be restarted for these<br />
changes to be accessible.<br />
Now there are two ways to access this new software….<br />
Go into Program Files, open the Igor Pro Folder with the MFP-3D software version you<br />
wish to open.<br />
Click on the Igor.exe icon to launch Igor Pro. (this can also be made as a renamed short<br />
cut to the desktop). This will only open Igor Pro. Once loaded, go to File New MFP-3D<br />
template<br />
This will launch the new version of the MFP-3D software.<br />
An icon can be linked such that one click gets you to the<br />
new MFP-3D software version.<br />
From the Igor.exe executable from the new copied folder<br />
you just created, create a shortcut and put it on the<br />
desktop (or wherever it will reside)<br />
Right click on the shortcut icon, choose properties- the<br />
following ‘Properties’ dialogue with come up (Figure<br />
14.16.3A).<br />
Choose the Shortcut tab. In the Target window (which<br />
should already be highlighted), copy all the text in there.<br />
Open notepad, or something you can dump text into and<br />
paste.<br />
Figure 14.16.3: copy the target path; paste into<br />
notepad and re-paste- designate copied folder path<br />
as described in text.
Ryan’s MFP-3D Procedural Operation ‘Manualette’ Version 10 (v080501; Igor 6.04A); 14.15<br />
Make one space, paste again.<br />
In the second set of text, replace the Igor.exe with Asylum Research/ Code 3D/ MFP-3D template.pxp<br />
OR just copy the text below and replace the red text with what ever you called the copied folder.<br />
"C:\Program Files\WaveMetrics\COPIED FOLDER PATH NAME\Igor.exe" "C:\Program<br />
Files\WaveMetrics\COPIED FOLDER PATH NAME\AsylumResearch\Code3D\MFP3D template.pxt"<br />
Here’s the text for the example that the author did to create for this software version for this section-<br />
"C:\Program Files\WaveMetrics\071217 Igor Pro Folder\Igor.exe" "C:\Program<br />
Files\WaveMetrics\071217 Igor Pro Folder\AsylumResearch\Code3D\MFP3D template.pxt"<br />
• If there is an issue with it loading all the way to the MFP-3D template, there is probably an extra space in this<br />
line of text screwing it up-<br />
▪ It’s a great idea to name the icon for the new MF-3D software version.<br />
To change the icon from the Igor logo to MFP-3D-<br />
Click the icon button and choose a new icon, if you so desire. The MFP-3D icons can be<br />
found in C:/wavemetrics/copied Igor Pro Folder/Asylum Research/Code 3D/ icons folder,<br />
or make your own…<br />
14.17: Determining the MFP-3D software version of a saved expt-<br />
Say you have this saved expt, and you need to what version of software it was originally created with- the<br />
impetus of this is from trying to reload an expt offline in which errors are experienced because the version of<br />
software you are loading with is not the same as the version the data was acquired with.<br />
Go to Data Data Browser; the Igor data browser window with appear.<br />
Confirm that only Variables and Info checkboxes are selected.<br />
Click the ‘Browse Expts…’ button; this will bring up a browse dialogue- go find the saved .pxp expt needed<br />
to be found; A second column will appear on the right of the data browser<br />
Go into that column and tunnel down into root/MFP-3D/Main/variables/ VerDate- once selected, the<br />
version will appear at the bottom of the data browser.<br />
▪ Now you can match that expt for opening the expt offline. Contact support@asylumresearch.com if the<br />
software version is needed.
Ryan’s MFP-3D Procedural Operation ‘Manualette’ Version 10 (v080501; Igor 6.04A); 14.16<br />
Name of saved expt<br />
Figure 14.17: locating a MFP-3D software version in a saved experiment using the<br />
Data Browser.<br />
Another easy way to determine the version is to look at the Asylum Research tab in the properties information<br />
using windows explorer, or My Computer.
Ryan’s MFP-3D Procedural Operation ‘Manualette’ Version 10 (v080501; Igor 6.04A); 14.17<br />
14.18: Installing a grid on image screen:<br />
If it would help you to have a grid on the image window (or any Igor plot) in real time or offline, this is easy-<br />
Double click on one of the axis of the plot/ graph- this swill bring up the Igor Modify axis .<br />
Click on the ’Ticks and Grids’ tab.<br />
From the Grid pull down menu, choose ‘On’.<br />
▪Select color and line thickness, or any other aesthetic from this tab. For more on the Modify Axis panel, see<br />
the ‘Getting <strong>St</strong>arted’ manual of the Igor Pro Manual.<br />
Click ‘Do It’ button.
Ryan’s MFP-3D Procedural Operation ‘Manualette’ Version 10 (v080501; Igor 6.04A); 14.18<br />
A<br />
B<br />
Figure 14.18: Installing a grid on the image window: Click on an axis to bring up the Modify axis Panel (A); Activate grid<br />
in ‘Ticks and Grids’ tab, select other aesthetics and click ‘Do It’- example result can be seen in (B).<br />
14.19: Deactivating Closed Loop Scanner:<br />
Go to ‘Setup’ in Main tab of master panel. Towards the bottom, click on the ‘Show?’ check box next to ‘Scan<br />
Mode’ pull-down - it contains the option to turn of the closed loop feature.<br />
14.20: Sum & Deflection Meter Freeze:<br />
This can occur if the cable connection isn’t good. With time, and all that repeated cable twisting from putting<br />
the head on its back while attending to the sample, the plug can wiggle its way out enough to cause the<br />
meter to freeze. TO FIX IT, power the controller off for 10 to 20 seconds, then turn back on. While you’re<br />
waiting, wiggle the plug back in a bit more.<br />
I have noticed any time one of the levels in the S&D meter aren’t responding properly, it’s a good idea to do<br />
some variation of the above procedure.<br />
14.21: Rescan Bus:<br />
Sometimes if the system experiences a freeze, or the system is hanging because Igor has been<br />
confused, click the ‘Rescan’ button (lower left). This pings all the hardware systems to make sure<br />
they are all communicating properly with each other (as far as I know).
Ryan’s MFP-3D Procedural Operation ‘Manualette’ Version 10 (v080501; Igor 6.04A); 14.19<br />
14.22: Igor Hot keys<br />
Crtl+ I- Igor A&B cursors<br />
Crtl+ F- search in the global variables<br />
Crtl + W- closes forward most window<br />
Crtl+C- copy<br />
Crtl+ Y- window control- can rename windows<br />
Crtl+P- print<br />
Crtl+J- bring History window forwardmost<br />
Crtl+ 2- Do thermal<br />
Crtl+4- cantilever auto tune<br />
Crtl+7- open Master Channel Panel<br />
Crtl+9- open NAP panel<br />
Crtl+F2- open Mode Master<br />
Crtl+ A- Rescale<br />
Crtl+T – Igor Tool box<br />
Crtl+ D – duplicates forward-most window<br />
Crtl+V- paste<br />
Crtl+O- open experiment<br />
Crtl+L – load waves<br />
Crtl + 1- Windows Manager<br />
Crtl+3- single force pull<br />
Crtl+6- open S&D meter<br />
Crtl+8- open NAP channel stuff<br />
Crtl+ F1- Igor search panel<br />
Crtl+M – opens Igor Procedure window<br />
More to come…<br />
14.23: User Profiles:<br />
The MFP-3D software contains these predefined user panels, which when called activated, will set the panels<br />
to specific preset parameters. What’s more convenient, the user can create a custimized ‘User Profile’.<br />
•For example, the author likes to have the AC mode set point set up for 950mV in preparation for a gentle<br />
(false) engage with a 1V free air (target) amplitude; -5% of the resonance peak, Z sensor channel on, plus<br />
many other parameters pre set. Well, all this can be set up and saved as a profile-<br />
A<br />
B<br />
Figure 14.23.1: creating customized user profiles: A) with the parameter setvars already set up in<br />
the MFP-3D software, check the panels to be included in the user profile in the Prefs Tab; B) IN<br />
the Profiles tab, name the Profile, and select type; Click ‘Save’ button.
Ryan’s MFP-3D Procedural Operation ‘Manualette’ Version 10 (v080501; Igor 6.04A); 14.20<br />
In the MFP software version of choice, set up the setvar parameters as desired.<br />
In the main menu, Go to User Settings Preferences and Profiles.<br />
Go to the Prefs tab of the AR User Panel, and checkmark the panels that encompass the changes made<br />
(from default settings). For example, changes in the Force Tab are set up by clicking the Force check box<br />
(Figure 14.23.1A).<br />
Go to the Profiles tab-enter a ‘Profile Name’ in the pull-down menu;<br />
In the ‘Class’ pull-down, Choose which type of user you are- the author likes ‘User’ because it’s easy.<br />
In the ‘Type’ pull-down, choose what kind of experiment it encompasses- when changing settings across<br />
many panels, ‘The Whole Enchilada’ seems to be fitting.<br />
Click the ‘Save’ button; this will initiate the setvar and other preference changes from default settings.<br />
TO OPEN A PROFILE, go to User Settings Preferences and Profiles (in the main menu).<br />
In the Profiles tab, highlight a profile to be opened.<br />
Double mouse click on the highlighted profile, or Click the ‘Load’ button; the panels will load with the<br />
desired setvar parameters.<br />
14.24: COMMON COMMANDS:<br />
Here’s a list of some common commands that may be useful (some of these may be outdated)<br />
Bindmesh (overlay images)<br />
ArGL_BindMesh("HeightImage0HtT","PhaseImage0PhT")<br />
See section 13 for slightly more complete description of this protocol<br />
Render images in 3D (anaglyphs) using Argyle<br />
Argl_WriteValue(“”,”anaglyph”,1) //turns ON Anaglyph in Argyl window<br />
Argl_WriteValue(“”,”anaglyph”,0) //turns OFF Anaglyph in Argyl window<br />
NOTE: back ground must be black<br />
Subtracting Images<br />
Extractlayer() // extract layer of 1 st image- rename it<br />
Extractlayer() // don’t rename it if you are subtracting 1 st layer from this layer<br />
Layerdata -=renamed layer //kicks out subtracted image (but its upside down)<br />
Newimage/F = layerdata // makes it right<br />
//insert this layer back in to do modification of ARgyle on it.<br />
Rotating images (saved data) see example in Section 12.6<br />
-extract a layer from the image to be rotated, then type in the command line-<br />
duplicate layerdata, filename //what do you want to call the image
Ryan’s MFP-3D Procedural Operation ‘Manualette’ Version 10 (v080501; Igor 6.04A); 14.21<br />
•layerdata = filename[q][X-p] // where X is equal to the number of points in the image per scan lineremember<br />
Igor starts counting at zero-<br />
-insert the layer back into the initial image<br />
-perform an overlay in ARgyle<br />
Monitor system parameters<br />
print td_ReadValue("Temperature%Default@Head") //reads temp at head<br />
print td_ReadValue("Temperature%Default@scanner") //reads temp at scanner<br />
Turn ON/OFF the blinking LED at the XYlvdt board and head<br />
print td_WriteValue("LedBlinking%Default@XYLVDT", 1) //turns ON LED at XYLVDT board<br />
print td_WriteValue("LedBlinking%Default@XYLVDT", 0) //turns OFF LED at XYLVDT board<br />
print td_WriteValue("LedBlinking%Default@head", 1) //turns ON LED at head<br />
print td_WriteValue("LedBlinking%Default@head", 0) //turns OFF LED at head<br />
Set/read output voltage to XYZ piezo<br />
print td_writevalue("Z%Output@Controller", 70) //sets output to Z piezo<br />
print td_readvalue("Z%input@Controller") //reads z piezo voltage<br />
print td_wv("y%output", 70) //sets output to Y piezo<br />
print td_wv("x%output", 70) //sets output to X piezo<br />
Send voltage pulse output (OutA) using DAC (eg…2V, -2)<br />
print td_WriteValue("A%Output", 2);print td_WriteValue("A%Output", 0)<br />
print td_WriteValue("A%Output", -2);print td_WriteValue("A%Output", 0)<br />
Print out what 50 pN is in Volts for your given Spring constant and Invols. Useful for setting a<br />
trigger during force curves<br />
Variable MyForce = 50e-12 //I want 50 pN.<br />
Print MyForce/GV("SpringConstant")/GV("Invols")<br />
Display captured video image<br />
//First set the data folder to :root or create one like root:Video or root:Capture<br />
//Then click capture button<br />
NewImage capture<br />
Better way of displaying captured video image<br />
Display; AppendImage capture; ModifyGraph height={Plan, 1, left, bottom}<br />
Rename captured video image so it doesn't get overwritten (show example from data browser)<br />
In the Igor Data Browser, Rename capture pollenA<br />
Generate a piecewise continuous wave<br />
Make/N=65535 wave0, wave1, wave2, wave3<br />
wave0 = (p
Ryan’s MFP-3D Procedural Operation ‘Manualette’ Version 10 (v080501; Igor 6.04A); 14.22<br />
wave2 = (p
Ryan’s MFP-3D Procedural Operation ‘Manualette’ Version 10 (v080501; Igor 6.04A); 16.1<br />
Section Topic Page<br />
16.1 LVDT Closed Loop Sensor Noise 16.2<br />
16.2 Scanner Calibration noise 16.5<br />
16.3 ‘Fast’ Engaged Noise 16.6<br />
16.4 ‘Waterfall’ Plots 16.9<br />
16.5 Saving Noise data 16.12<br />
16.6 Troubleshooting noise 16.13<br />
16.7 Vibration table adjustments 16.14<br />
16.8 Vibration Dampening Pads 16.16<br />
WARNING: This chapter does not suggest (in any way, shape, or form) that users<br />
explore the 3D Test Panel tabs other than what is described within. This chapter<br />
was designed merely to check the noise health of an MFP-3D system- (i.e., if it<br />
has been moved or some environmental change has increased the noise). Users should<br />
NOT change any parameters in the Info Blocks, which will usually change system<br />
calibrations for the worse. If unsatisfactory noise persists in the system, DO NOT take the<br />
repair onto yourself: contact AR support to remedy the situation. The MFP-3D is a high<br />
precision instrument, and has gone through extensive post production testing and<br />
calibration- under normal circumstances there will be no need for re-calibration.<br />
NOISE MEASUREMENTS: The MFP-3D software has a testing section that can show how much noise the<br />
system is experiencing both internally (instrument) and externally (environment). Noise tests for the X, Y & Z<br />
LVDT closed loop sensors (at different input voltages) can be measured, and the 5 MHz A/D converter (ADC)<br />
on the photodetector (referred to as the ‘Fast’ ADC) can also be monitored. By placing the tip on the surface<br />
(with known InvOLS value- see Section 9) with gains OFF, the noise coupled into the tip from the surface<br />
below can be measured over a typical imaging bandwidth (0.1Hz to 1kHz) to diagnose what kinds of noise<br />
frequencies are present. Custom inputs can also be adapted to this software.<br />
This chapter will describe basic noise tests for system set up, or general diagnosis. If this chapter does not<br />
describe what your MFP3D is doing, please contact support@asylumresearch.com.<br />
Asylum Research has established specific factory specifications for the noise on the MFP-3D. Table 15.1 lists<br />
these below. Sections 16.1 – 16.3 describes how to measure these.<br />
Table 16.1: Use freshly cleaved mica or graphite surface for ‘Fast<br />
Engaged’ test<br />
‘Fast’ ADC X Y Z<br />
Engaged < 60 pm NA NA NA<br />
Free Air < 30 pm < 600 pm < 600 pm < 300 pm<br />
Typical InvOLS values used are between 20 and 80 nm/V
Ryan’s MFP-3D Procedural Operation ‘Manualette’ Version 10 (v080501; Igor 6.04A); 16.2<br />
16.1: X,Y,Z LVDT Closed Loop Sensor Noise measurements:<br />
In the Main Menu, Go to Programming → Load Test Procedures (Figure 16.1.1). This creates a new pull<br />
down menu item called ‘testing’ → test panel (Figure 16.1.1B, inset).<br />
This will bring up the 3D Test Panel (Figure 16.1.2). This panel consists of seven tabs for various<br />
measurements, many of which will not be described herein.<br />
Open the Noise tab (Figure 16.1.2).<br />
• With the tip disengaged, the noise of the closed loop sensors can be monitored at any value between -10<br />
V and 150V. Only one axis (sensor) can be tested at a time, and must be deselected before selecting another<br />
axis. Values below 600 pm meet AR’s factory specifications for the X & Y LVDTs, while values below 300 pm<br />
meet specs for the Z LVDT (Table 16.1).<br />
To measure if the LVDT noise is within factory specification, activate the desired axis ‘Input’ checkbox. In<br />
Figure 16.1.2, the X axis input is selected. AR Factory specifications are collected at 1 kHz bandwidth.<br />
• Typically, the bandwidth and offset/lever default values are suitable. A piezo voltage of -10V means the it’s<br />
starting from its fully retracted end of travel.<br />
B<br />
Figure 16.1.1: opening the test software gives hidden ‘Testing’ main menu; B) inset shows where to select 3D Test<br />
Panel.<br />
Notice the low pass filter bandwidth can be selected, as well as the offset piezo voltage to check noise at<br />
edges or center regions of piezo travel.<br />
Click the ‘<strong>St</strong>art’ button. The X (Y or Z) Sensors Noise panel will come up with two sets of axes (Amplitude vs.<br />
Frequency; and Amplitude vs. Time).<br />
• The Resolution and Averaged number of spectra can be adjusted in the respective setvars under the ‘<strong>St</strong>art’<br />
button (Figure 16.1.2).<br />
• As the spectra are being collected and averaged, the counter will indicate which count it’s on.
Ryan’s MFP-3D Procedural Operation ‘Manualette’ Version 10 (v080501; Igor 6.04A); 16.3<br />
To continually collect spectra, ensure the ‘<strong>St</strong>op ’ checkbox is unchecked in 3D Test Panel.<br />
Figure 16.1.2: Noise tab in the 3D test Panel: monitor LVDT and Fast ADC noise here.<br />
• Figure 16.1.3 shows an example of a typical X LVDT sensor noise spectrum. The lower plot (amplitude vs.<br />
frequency) is the amplitude spectrum over the typical AFM imaging bandwidth. The spectra are averaged and<br />
displayed in real time. The blue curve is the integration of the black noise spectrum. You can also see the roll<br />
off of the 1kHz low pass filter. The upper plot is a temporal plot that is updated in real time, but not averaged.<br />
The average deviation of the noise can be seen in the Noise tab (Avg. Adev).
Ryan’s MFP-3D Procedural Operation ‘Manualette’ Version 10 (v080501; Igor 6.04A); 16.4<br />
A<br />
B<br />
Figure 16.1.3: Typical X,Y LVDT Sensor noise plots. A) Typical Amplitude vs. Frequency (average of ten curves) plot of<br />
X or Y LVDT closed loop sensor; B) Measurement settings and result (Avg. Dev.) of X sensor used in this example.<br />
Noise test TROUBLESHOOTING:<br />
If the power spectrum doesn’t look something like Figure 16.1.3, something may be wrong. Either the scanner<br />
is rubbing somewhere, or perhaps the LVDTs have been compromised (aqueous media can compromise<br />
them). It’s typically a very robust system.<br />
• An example of a poor sensor signal is in<br />
Figure 16.1.4. In this particular example, the X<br />
scanner was rubbing at the end of fully<br />
retracted part of the scan- a representative<br />
scanner hysteresis plot can be seen in Figure<br />
16.3.3.<br />
•Also notice the length scale in Figure 16.1.4:<br />
it’s in zm (i.e., x10 -21 )- doesn’t make sense<br />
because that’s way too small, so there must<br />
be something not correct with the system. In<br />
this particular example, since it was<br />
constrained at the fully retracted end,<br />
adjusting the piezo range to +10 V to +150V<br />
gave a healthy noise spectrum similar to<br />
Figure 16.1.3. With some mechanical<br />
adjustment and help from AR support, the<br />
piezo was moved back into proper position.<br />
Figure 16.1.4: Improperly functioning LVDT sensor noise plot.
Ryan’s MFP-3D Procedural Operation ‘Manualette’ Version 10 (v080501; Igor 6.04A); 16.5<br />
16.2: Scanner calibration: The health of the scanners can be monitored in the Calibration tab of the<br />
3D Test Panel (Figure 16.3.1).<br />
Choose the scanner from the pull-down menu,<br />
make sure it is in the ‘Drive’ Action, and X (Y or Z) and<br />
setvars in range of –10 V to 160 V.<br />
Click ‘<strong>St</strong>art’ button. A graph similar to Figure 16.3.2<br />
will be displayed if everything is working properly. A<br />
nominal range of ~ 14 V and a hysteresis value range<br />
of 4 to 5 % or less is typical (not sure on AR’s specs on<br />
the percentage).<br />
• Choosing smaller ranges for the respective piezo to<br />
move results in smaller hysteresis values (generally).<br />
Figure 16.2.1: The Calibration tab allows noise tests on<br />
the LVDT sensors as the piezo is actuated through a<br />
voltage range.<br />
Figure 16.2.2: typical LVDT (X or Y) scanner hysteresis plot.<br />
• If the hysteresis plot bottoms out/ rails at the bottom or top (red circle, Figure 16.2.3), the flexure assembly<br />
needs to be adjusted. At this point, the author recommends calling or emailing AR support. Please treat these<br />
individuals with the same professionalism that they will treat you with.
Ryan’s MFP-3D Procedural Operation ‘Manualette’ Version 10 (v080501; Igor 6.04A); 16.6<br />
Figure 16.2.3: Piezo example where it is constrained due to improper mechanical position in the scanner housing; B)<br />
representative Sensor noise for a situation like this.<br />
• Figure 16.2.3 shows the piezo being constrained at the end of its travel- Panel A shows the LVDT sensor<br />
hysteresis loop: Notice the voltage ‘railing’ on the lower left. What has occurred is this piezo wasn’t properly<br />
centered in its housing, causing it not to be able to move in the 0V to -10V bias range applied to this particular<br />
piezo, resulting in a improper LVDT noise measurement. Panel B shows the subsequent noise measurement of<br />
this LVDT sensor- notice the noise is 6.71zm (inset), which is an unreasonable distance dimension. Incidentally,<br />
in this example, the Offset/Lever voltage was changed from -10 to a value higher (let’s say 0V because this is<br />
what the author actually did), the LVDT noise fell into factory spec, according to the values in Table 16.1.<br />
▪ When done testing, go to Programming → Remove Test Procedures; or don’t.<br />
16.3: ‘Fast Engaged’ ADC Noise:<br />
The ‘Fast’ ADC is assigned to the photodector by<br />
default for obvious reasons in most scanning<br />
applications. The ‘Fast’ ADC noise is what AR engineers<br />
use to monitor how much noise is being coupled into<br />
the system from its environment when the tip is on the<br />
surface with feedback loop gains OFF over the typical<br />
imaging bandwidth (
Ryan’s MFP-3D Procedural Operation ‘Manualette’ Version 10 (v080501; Igor 6.04A); 16.7<br />
Make sure the fiber light isn’t on- the cooling fan in the light can couple noise (~60Hz) down the<br />
fiber optic cable into the system.<br />
• AR spec tests use a 100 μm Si 3 N 4 triangular cantilever, or AC 160 (k~40N/m; f o ~335kHz). The value will<br />
automatically be updated in the ‘Sensitivity’ setvar value in the Panel. These noise numbers are sensitive to<br />
InvOLS, which in turn is sensitive to the ‘Sum’ on individual cantilevers. Don’t be sloppy with your InvOLS<br />
calibration when performing noise tests. The lower the InvOLS value, the lower the ‘Fast’ Engaged value.<br />
Check the box below the Fast column (Figure 16.1.2).<br />
The ‘Fast’ ADC noise is measured two ways:<br />
Free air (disengaged): The free air will give you a sense of how noisy the system is. Factory specification is<br />
30pm or less.<br />
Engaged: with the tip on the surface & gains off, this measurement is going to give a real sense of how<br />
noisy the MFP’s environment over the typical imaging bandwidth of 0.1Hz to 1kHz, because this fast ADC can<br />
monitor what frequencies are being coupled into the tip (i.e., seismic, acoustical, mechanical, electrical, etc.).<br />
Factory specification is 60pm or less.<br />
Free air: this checks the noise of the system; i.e., optical lever noise with tip withdrawn.<br />
Confirm the tip is withdrawn from the surface.<br />
(optional) Enter 70 V in ‘offset/lever’. This will put piezo in center of its range.<br />
Hit the ‘<strong>St</strong>art’ button; A noise plot comes up which shows the sampled noise (Figure 16.3.1). The fast input<br />
free air value should be less than 30 pm to meet AR’s specs (Table 16.1).<br />
Fast Engaged: This measurement monitors the noise at the tip-sample interface over the typical imaging<br />
bandwidth of 0.1Hz to 1kHz.<br />
Engage tip in contact mode.<br />
Confirm bandwidth is set to 1kHz.<br />
Adjust Integral gain to 0.01 (to deactivate feedback loop). This step is important! The integrity of this<br />
measurement means nothing if the gains can respond to the frequencies being coupled into the tip.<br />
Click the ‘<strong>St</strong>art’ button; This will be an inherently noisier system (than Fast free air) because the tip is in<br />
contact with the substrate, allowing environmental frequencies to couple into the system. The ‘Fast input’<br />
(the 5 MHz ADC) engage value should be less than 60 pm to meet AR’s specs Table 16.1).
Ryan’s MFP-3D Procedural Operation ‘Manualette’ Version 10 (v080501; Igor 6.04A); 16.8<br />
A<br />
B<br />
Figure 16.3.2: Typical ‘Fast’ engaged<br />
noise spectrum. Integration plot (blue)<br />
show largest contributors in the 0.1 Hz<br />
to 1kHz bandwidth; B) screen shot of<br />
3D Noise Panel Avg. Adev. of<br />
measurement.<br />
• Figure 16.3.2 shows a typical noise spectrum of a system that meets AR spec. The upper plot is time vs.<br />
Amplitude , updated at whatever interval is designated (i.e., not averaged). The low spectrum is Frequency vs.<br />
Amplitude, which is an average of all the spectra taken during that measuring period. The blue line represents<br />
the integration of the black power spectrum plot.<br />
• Figure 16.3.3A is an example of one of an MFP-3D’s Fast input ‘Engaged’ noise that is very noisy. Figure<br />
16.3.3B is an expansion of the 1Hz to ~1.2kHz range done in Igor. Regular noise with periodicity can be clearly<br />
seen in the time plot (upper temporal, red). That works out to be around 32 Hz noise, which can be seen as a<br />
broad peak (and strong noise contributor) in the frequency plot (black lines Figure 16.3.3B)- this suggests<br />
some mechanical external noise. In our case, I suspect it’s caused by some air handling equipment outside the<br />
old lab’s window. The spikes and peaks in the frequency plot show various types of external noise.<br />
A<br />
B<br />
60 Hz<br />
Figure 16.3.3: A) Typical fast engaged noise test meets spec; B) Fast Engaged spectrum showing seismic, acoustic,<br />
mechanical noise in lower frequencies (red box). Screen shot obtained before integration plot was added to software.
Ryan’s MFP-3D Procedural Operation ‘Manualette’ Version 10 (v080501; Igor 6.04A); 16.9<br />
• Another example of a system in a spectrum<br />
200<br />
with a lot of lower frequency noise (Figure 100<br />
16.3.4): the ~2Hz contribution can be seen in -100 0<br />
the spectrum (large integration<br />
-200 0.0<br />
contribution), and in the time domain, the<br />
0.5 1.0 1.5 2.0 2.5s<br />
larger sine wave is ~2Hz. Counting peaks on<br />
the small sine wave superimposed upon that<br />
is ~24Hz- this is confirmed on the spectrum 10 -12<br />
and other large integration contribution at<br />
70<br />
60<br />
50<br />
~24Hz.<br />
10 -13<br />
pm<br />
40<br />
x10 -12<br />
10 -11 1 Hz 10 Hz 100 Hz 1 kHz 10 kHz<br />
10 -14<br />
30<br />
10 -15<br />
10 -16<br />
20<br />
10<br />
Figure 16.3.4: Example of noisy low frequency Fast Engaged<br />
spectrum.<br />
16.4: ‘Waterfall’ Plots<br />
A waterfall plot is the king daddy of all ‘Fast’ engaged measurements: it can log the frequency changes over<br />
longer lengths of time than the fast engaged measurement described in Section 16.3. It plots the ‘Fast’<br />
engaged Average Deviation noise vs. time, and also plots this noise as pixels over a 1Hz to 1kHz frequency<br />
range over the temporal length scale.<br />
• The advantage of running a waterfall plot is to see what occurs over time- say over the course of a day where<br />
the building noise can be noisy during the day, and more quiet at night; or if something freakish happens<br />
somewhere along the way.<br />
To obtain a water fall plot, follow the following procedure:<br />
Note: it is assumed that a freshly cleaved piece of mica is<br />
the substrate, and the cantilever’s InvOLS is calibrated.<br />
Open the ‘Freq. Analysis’ tab in the 3D Test Panel.<br />
Choose the Time, PSD and Log Displays- these will be<br />
the noise plots that will give the important information<br />
Set the Low Frequency setvar to 500mHz; Set the High<br />
frequency setvar to 500Hz. The resolution setvar will<br />
update to be the same as the ‘Low’ setvar.<br />
Under averaging, set the Mode pull-down to ‘Log’- this<br />
will produce the image seen in the Log display.<br />
Figure 16.4.1: Frequency analysis tab<br />
parameters for waterfall plots. Follow these<br />
parameters for log setup.
Ryan’s MFP-3D Procedural Operation ‘Manualette’ Version 10 (v080501; Igor 6.04A); 16.10<br />
Also under averaging, set the number setvar to 3 or 4- this will take that many noise measurements,<br />
average them and display- because of this expect a slight delay.<br />
Under the Inputs- set Channel 0 to Fast (for fast engaged). Other inputs can be used to measure noise, but<br />
that is a more custom experiment, and this procedure should allow one to figure that out with little trouble.<br />
Confirm that the tip is on the surface, and the Integral gain at 0.01.<br />
Click the ‘<strong>St</strong>art’ button. All three Display plots will start to display their respective<br />
data.<br />
• The Log plot will be displayed in grayscale by default. Changing the color table<br />
can aid the eye in subtle temporal frequency range changes. To do this, left click on<br />
the pixilated portion, select ‘Modify Trace Appearance’ to get this Igor dialogue.<br />
Over the user defined period of time, the time and PSD plots will update per<br />
averaged measurement, while the Log plot will show the temporal frequency data.<br />
An example can be seen in Figure 16.4.2- note this figure has had its frequency<br />
range manually attenuated (recall the raw data collected 500mHz to 500Hz- but for<br />
this noise chasing application, only about 50Hz were sufficient based on previous<br />
PSD plots (data not shown). The color table was also change to planet earth to<br />
accentuate the areas of excessive noise to more easily correlate with frequency.<br />
The upper plot is the Fast Engaged PSD data vs. time. The lower plot shows the waterfall plot- features that<br />
the author would like to point out area the blue and white pixels- which are the higher frequency contributors<br />
found in the PSD plots (see Figure 16.4.3). Unfortunately, the author isn’t sure how to install a z scale color<br />
table bar- just know that yellow and green are lower frequency contributors, while blue and white are the<br />
largest contributors.<br />
Back to the plot- look at the blue& white horizontal steaks- specifically, 44, 29, 25 and 2 Hz were the major<br />
contributor frequencies, and these could also be seen as the culprits in the integration plot of the PSD vs.<br />
frequency plot (Figure 16.4.3). Additionally, over time, the 18 to 20 Hz was bleeding in: notice at the left, these<br />
frequencies were quelled because the author made some adjustments.
Ryan’s MFP-3D Procedural Operation ‘Manualette’ Version 10 (v080501; Igor 6.04A); 16.11<br />
Figure 16.4.2: Waterfall plot- Fast engaged frequency bandwidth plotted temporally (lower plot) along with Fast<br />
Engaged Average Deviation noise plotted temporally (upper plot).<br />
10 -20<br />
10 -21<br />
20<br />
Fast ( m ^2/Hz )<br />
10 -22<br />
10 -23<br />
10 -24<br />
15<br />
10<br />
Fast ( zm ^2 )<br />
10 -25<br />
5<br />
10 -26<br />
0<br />
1 10 100<br />
Hz<br />
Figure 16.4.3: Corresponding Fast Engaged noise for Log plot in Figure 16.4.2. Note that this is only one<br />
power spectrum (i.e., not averaged).
Ryan’s MFP-3D Procedural Operation ‘Manualette’ Version 10 (v080501; Igor 6.04A); 16.12<br />
16.5: Saving Noise Data:<br />
It’s a good idea to save the noise data, be it fast engaged or hysteresis data. There are essentially two ways to<br />
save the data:<br />
File save graph copy; designate the path, etc. This saves the plot as a pxp file and can be called up later<br />
on. Tricky part is that they cannot really be called up (easily) with the MFP software open.<br />
The other, better way is to click the ‘Save’ button in the any of the 3D Test Panels when the measurement is<br />
complete. This dumps the graph into the Igor Data Browser, allowing it to be called up later, or even multiple<br />
plots easily overlaid. This is useful for comparing noise environments/ situations. The AR engineers use this<br />
software extensively to prepare reports for the testing of system components after being built, or repair, or<br />
installation. This section is devoted to showing how to do this-<br />
The example used in this section is using various Fast Engaged noise spectrums from changing out different<br />
rubber pads under the hood legs in efforts to try to get the best performance out of a system in a very noisy<br />
lab (same lab as in Section 14.4).<br />
• Four different PSD noise spectrums were saved after each time different durometer rubber pads were<br />
changed.<br />
To view these PSD spectrums, open the Data Browser<br />
(data Data Browser). This will open the Igor Data Browser<br />
(Figure 16.5.1).<br />
This data gets dumped into the root Test Results Noise<br />
Path. Each PSD and Time domain plots get saved as<br />
subfolders in this folder. Figure 16.5.1 shows the expanded<br />
folder system.<br />
To view a single plot, highlight the file, and right mouse<br />
click. This display a Igor Menu.<br />
Select ‘Display’. This will create a plot with linear axes (to<br />
view as log axis, the Igor ‘Modify Axis’ panel has to be set<br />
up).<br />
To overlay multiple spectra, Crtl+ left click on the files of<br />
interest (Figure 16.5.1).<br />
Right mouse click and select ‘Display’. This will create a<br />
plot with all the selected curves- only problem is that they<br />
are all the same color, but can easily be changed in the Igor<br />
‘Modify Trace Appearance’ Panel (double click on curve).<br />
Another problem is there is no legend: to do this,<br />
Right click in some dead space on the plot and right<br />
mouse click.<br />
Select ‘Add Annotation’- this will bring up the Igor ‘Add<br />
Annotation’ Dialogue.<br />
Figure 16.5.1: Saved Noise measurement plots<br />
from the 3D Test Panel are found in the Igor Data<br />
Browser.
Ryan’s MFP-3D Procedural Operation ‘Manualette’ Version 10 (v080501; Igor 6.04A); 16.13<br />
Select ‘Legend’ from the annotation pull-down. This will install the legend in the plot.<br />
Figure 16.5.2 shows the four PSD spectra from Figure 16.5.1, properly annotated. Notice the overlay clearly<br />
shows how varying the rubber durometer sandwiches under the hood legs affects the various frequency<br />
ranges – the PSD4 has less low frequency contributions (2Hz), but much higher mid range (25 & 44 Hz); while<br />
PSD 2 has large low frequency contribution, but lower mid range contributions. These comparisons are very<br />
useful in troubleshooting noise.<br />
120<br />
100<br />
80<br />
'PSD 1'<br />
'PSD 2'<br />
'PSD 3'<br />
'PSD 4'<br />
x10 -12<br />
60<br />
40<br />
20<br />
0<br />
1 10 100<br />
Hz<br />
Figure 16.5.2: Overlay of various PSD spectra showing the affects of<br />
changing the MFP3D system environment.<br />
16.6: Trouble Shooting Noise:<br />
In most labs, rarely does a system come in under factory specifications the first time out from instrument<br />
reassembly. There are a few things to keep in mind when determining how to quell the sources of noise.<br />
The controller has a frequency converter (and audio out) built into it to allow the user to listen<br />
to noise in the system. Building noises suchs as pedestrians in nearby hallways, pumps, doors,<br />
elevators, electrical humming can be heard in the human hearing range. Even adjusting the<br />
monster cable can cause audible frequency changes that can aid in system noise reduction.<br />
Things to listen for are periodicity of the noise, where the noise might be originating from and<br />
subtle differences between adjustments (see more in Section 16.6 & 16.7.<br />
Some questions to ask if the system is not in spec:<br />
-Is the table stable on, or isolation enabled? Look for the Red LED light to be on (Figure 16.7.1).<br />
-Are there large sources of noise in the room? Including/combining, but not limited to:<br />
•Seismic (high lab floor number; subway / busy road / hallway nearby;); usually seen as low frequency noise,<br />
non periodic, variable amplitude values.<br />
•Electrical- (various motors, pumps, transformers, table gains too high (see Section 16.7); usually seen as<br />
multiples of 60Hz somehow (N. America), and sharp spikes in the noise spectrum.
Ryan’s MFP-3D Procedural Operation ‘Manualette’ Version 10 (v080501; Igor 6.04A); 16.14<br />
•Mechanical- (floor noise coupling in through acoustic chamber; cable clamp/ acoustic hood clamp<br />
NOT secured; HVAC units nearby; fume hood fans; elevator motors, fiber light fan on?); usually seen as broad,<br />
lower frequency noise in the spectrum.<br />
•Acoustic- (sonicators, pumps, music, parties, fume hoods, labmates that don’t have ‘AFM voices’).<br />
-Do any of the cables have excessive torque or tension in them or their connections? (this can mess up<br />
ground).<br />
-Excessively high InvOLS values can increase the value: typically the Olympus cantilevers used to obtain the<br />
specification values in Table 16.1, generally give InvOLS values between 20 and 80 nm/V. Cantilevers with<br />
larger InvOLS (>100 nm/V), will give a ‘Fast’<br />
Engaged Avg. ADev. value that is out of spec<br />
(60pm), but would be in spec with one of the<br />
Olympus levers.<br />
-Can the source noise be tracked with using the<br />
headphones for the Fast Engaged<br />
measurement? The headphones can be very<br />
useful for tracking noise.<br />
• Figure 16.6.1 shows an example of a noisy<br />
‘Fast’ engaged spectrum and how it was<br />
improved: It shows an example with a lot of low<br />
frequency noise: look at as the large broad peak<br />
on left in the Amplitude vs. Frequency plot, the<br />
analogous steep integration line (blue)<br />
indicating that ~2Hz is a vary large contributor<br />
of noise.<br />
Figure 16.6.1: Example of out f spec system with low frequency<br />
noise.<br />
• Also notice the noise time scale (red plot)- the<br />
periodicity of the is ~2Hz. This particular system was on an eight floor of a bldg- where the entire bldg likely<br />
swayed at a frequency of ~2Hz; this system noise was dramatically quelled by using various rubbers and<br />
polymers underneath the acoustic hood legs (see Section 16.8).<br />
HOW TO FIX IT?<br />
(hopefully)<br />
The author can’t solve all your problems, perhaps none at all. But there are some adjustments one can do to<br />
get the system operating with less noise.<br />
Seismic- rubber under table/ hood legs (see Section 16.7), table stable servo gains adjustment (see Section<br />
16.7).<br />
Acoustic- If you are using an acoustic enclosure, close the front door, or eliminate any holes that could allow<br />
noise to enter. It’s amazing how a small hole can increase the decibels in the hood.<br />
Mechanical- properly clamped cable, rubber feet under hood/ table legs (see Section 16.8).
Ryan’s MFP-3D Procedural Operation ‘Manualette’ Version 10 (v080501; Igor 6.04A); 16.15<br />
Figure 16.6.2: The cable clamps can offer protection against vibrations traveling down the<br />
monster cable, and seal up the acoustic enclosure.<br />
Electrical- There are a couple things that can easily add noise:<br />
-Improperly coupled cable into its socket- if the ground shields around the outside of those connectors don’t<br />
have good contact, noise can get in.<br />
-System cables/ wires crossing each other- this<br />
may be suspicion, but the author tries to keep<br />
things clean behind the PC and controller,<br />
especially the USB (PC to controller) cable; Also,<br />
the controller USB should be in a bank by itself<br />
on the back of the PC (keep its neighbor empty)<br />
-Perhaps the system should have a ground wire<br />
from acoustic hood to wall socket- this could be<br />
especially useful for those doing electrical<br />
techniques (Figure 16.6.3).<br />
Figure 16.6.3: ground the acoustic hood to wall socket with<br />
piece of copper wire.<br />
16.7: Active Vibration table adjustments:<br />
16.7.1: The active dampening tables (JRS/ Herzan) table stable is a very easy system to use. The basic use and<br />
some things the author uses to help get a system are described here:<br />
Is the active dampening of the table turned on? The isolation on (ISOL. ON) LED should be illumination. If not,<br />
hit the ‘E’ button.<br />
The default gains are set at 235- this is just at the edge of the servos ‘ringing’.
Ryan’s MFP-3D Procedural Operation ‘Manualette’ Version 10 (v080501; Igor 6.04A); 16.16<br />
Figure 16.7.1: Front panel of Table <strong>St</strong>able active dampening systems.<br />
The menu can be changed by clicking the arrow buttons on the face plate. The select, press the Enter sign ↵.<br />
If the table is to be moved, you must lock the servos or you<br />
can damage the table. Look for the menu that says SYSTEM<br />
UNLOCKED; press the Enter sign ↵; power table down; move it.<br />
This window will give you an idea of how hard the table is<br />
working. (V is the Z axis, H1, and H2 are the horizontal planes).<br />
NOTE: If you are working in a multiple<br />
user facility that is supervised by<br />
someone, you should ask them if you<br />
are allowed to do this next part. They<br />
could have spent a great deal of time optimizing<br />
this.<br />
A<br />
16.7.2A: Manual gains on active<br />
dampening tables:<br />
Many of these active dampening systems have a<br />
second menu that allows the user to manually<br />
change the servo gains. To do this with the<br />
Herzan (JRS) Table <strong>St</strong>able, power the table down<br />
(it doesn’t have to be locked).<br />
B<br />
Figure 16.7.2: Scan range box in AR Video Panel: A) setting tip<br />
location; B),C), D)- different scan areas and XY offsets<br />
(indicated below CCD image.
Ryan’s MFP-3D Procedural Operation ‘Manualette’ Version 10 (v080501; Igor 6.04A); 16.17<br />
While holding the Enter ↵ key down, turn power on (Figure 16.7.2A).<br />
Shuttle thru the menus until you see the Manual Gain menu, similar to the image in 16.6.2B.<br />
Using the ‣ arrow keys, enter the desired gain value. This will update the gain in real time.<br />
Make sure Isolation is enabled- Now the LED will blink, indicating it’s under manual gain control. ACTIVE is<br />
equal to 000 when isolation is not enabled (Figure 16.7.2).<br />
•Normally, when trying to tweak the tables, the author will have the tip on the surface with the gains off (Fast<br />
Engaged) while adjusting these gain values, letting the table adjust for a few seconds, then monitor the noise<br />
value in the 3D Test Panel. It can be a trial and error process.<br />
As you reduce the gain, you are decreasing the bandwidth that is isolated. So if there are 120 Hz<br />
floor vibrations, the 120 Hz peak in the On-Surface noise will get worse when the gain is reduced.<br />
However, usually the biggest problem for us is noise peaks between 15 Hz and 60 Hz. Often<br />
these are caused by three-phase motors in the air-conditioning equipment. At a gain of 215 or<br />
220, these peaks should be isolated well. If we see noise above 100 Hz, then it is often from<br />
acoustic coupling (through the air) rather than vibrational coupling (from the floor) so the acoustic enclosure<br />
is what stops it. The one case where we see vibrational coupling above 100 Hz is noise from a transformer.<br />
This is strongest at 2x the powerline frequency, i.e. 100 Hz or 120 Hz depending on location. (text courtesy of<br />
Deron Walters, Ph.D.; Asylum Research)<br />
16.7.2B: Passive dampening (Minus k) tables:<br />
Usually these are trickier to adjust due to torque on table top from microscope cables. The tables work on a<br />
negative spring system, and can be effective isolators, but also a little less user friendly.<br />
Some of the questions to ask when tracking down poor performance issues (and try to correct if maladjusted)<br />
are:<br />
-Is the weight on the table distributed properly? It’s good to have the mass centered on the table. This helps<br />
the leveling process.<br />
-Is the table top torqued at all? This can cause rubbing on the side hull / skirt and kills the efficacy of<br />
dampening.<br />
-Is the load adjustment centered for the load that will be on it during the scanning? Use the crank at the<br />
bottom to adjust the load.<br />
•Adjusting the stiffness of the spring is also tricky. Essentially you want the table top to oscillate at less than a<br />
hertz to be at all effective.<br />
16.8: Vibration dampening pads under table legs:<br />
By using different ‘soft’ materials under the hood legs, different frequencies<br />
can be dampened in floors with excessive seismic or mechanical noise.<br />
•AR ships these Shore 00 premounted polyurethane pads (glued to a steel<br />
plate) with each new system- they can be pretty effective when doubling<br />
up and placing under the legs of the acoustic hood (See Figure 16.7.1 left<br />
side). They are available thru McMaster Carr.
Ryan’s MFP-3D Procedural Operation ‘Manualette’ Version 10 (v080501; Igor 6.04A); 16.18<br />
Some notes on these Shore 00 pads:<br />
The soft polymer pads do a great job of isolating the typical ventilation noise at 25-30 Hz ("midrange") but<br />
they create a rocking mode of the whole hood at 1-3 Hz. This is normally OK because in a basement, but it's<br />
bad if you are on an upper floors where more horizontal acceleration at low frequencies occurs. Because the<br />
hood is top-heavy, acceleration of the floor has a big lever arm to drive the rocking modes. These can tend to<br />
increase low frequency noise if too many are stacked in hopes of additive dampening.<br />
• We have also been experimenting with<br />
different rubbers and polymers to offer<br />
better vibration dampening. The 1” thick<br />
neoprene rubber pads on the right side of<br />
Figure 16.8.1 are a 70 A durometer and 30 A<br />
durometer, as well as a amber polyurethane<br />
95 A durometer polymer sheet.<br />
Some notes on pads under the hood legs-<br />
-This process of quelling noise can be<br />
challenging- often it is trial and error.<br />
• Too much softer materials can amplify the<br />
lower frequency noise.<br />
Shore 00<br />
70 Shore<br />
30 Shore<br />
• Too many pads under each leg can<br />
increase the center of mass, also<br />
Figure 16.8.1: Different rubber pads used to quell floor vibration<br />
coupling into the MFP3D.<br />
contributing to the lower frequency noise if<br />
the building is noisy (i.e., higher floors can do this).<br />
•The hood leg feet are probably better off being in contact with a hard material, like the steel plate that comes<br />
with the Shore 00 pads described above.<br />
• Never put rubber pads under the table stable- it won’t know what to do, constantly over correcting.
Ryan’s MFP-3D Procedural Operation ‘Manualette’ Version 10 (v080501; Igor 6.04A);<br />
Tip loading: gently slide tip under tongue, such that tip is in middle of clear trapezoidal window; tighten screw finger<br />
tight with screwdriver. Do not overtighten! (see Chapter 2)<br />
SLD Alignment: use camera or IR card to rough align SLD on cantilever; optimize signal by maximized Sum voltage in the<br />
S&D meter. Do not over torque LDX&Y or PD thumbwheels!<br />
Set point determination in Contact mode: after SLD (laser) alignment, adjust PD to slightly negative voltage value;<br />
choose set point MORE POSITIVE than this for gentle engagement. In contact mode, higher set point (voltage) values<br />
translate to higher applied force.<br />
Spring constant, k, determination: 1) perform a Force curve (in CONTACT mode) on a clean, hard surface; 2) determine<br />
Virtual Deflection ( cursors on free air approach (red) curve), select ‘Virtual Deflection Line’ from Set Sens in Calibration<br />
subtab (Force panel); 3) determine InvOLS (use Igor cursors (Crtl+I) on the contact region → Set Sens → Deflection). 4)<br />
Disengage tip; perform Thermal tune; Fit fundamental resonance peak to get k. (Chapter 9)<br />
Auto Tune Drive frequency in AC mode: Align laser on tip; zero PD; Do thermal to get approximate resonant peak; enter<br />
frequency range that flanks this value; Click ‘Auto Tune’; Engage tip/ image. (Section 6.1)<br />
Picking Drive Frequency when imaging in fluid: Align laser; Do thermal; approximate resonant frequency of cantilever<br />
& enter in drive frequency value of Tune tab; select ‘Append Thermal’ checkbox; perform ‘One Tune’ with a ~15 kHz<br />
window; use cross cursor to select point on black frequency plot that is near the resonant peak of the thermal (red) scatter<br />
plot; select ‘set drive frequency as ‘. Drive frequency updated in Tune & Main tabs. (Section 6.2)<br />
Alternatively, perform thermal tune; manually pick frequency by placing Igor cursor on left side of peak; type this value<br />
into drive frequency; Engage tip; after engagement, use ‘Hamster’ wheel (front of controller) to fine tune drive frequency<br />
by monitoring the phase & amplitude images, and line traces. (Section 6.2)<br />
Hard Engage Set point determination in AC mode: Pick a set point that is ~ 10 to 20% of the free air amplitude (value in<br />
Sum & Deflection meter). In AC mode, lower set point (voltage) values translate into higher forces. (Section 6.1)<br />
Gentle Engagement (AC mode): Pick a set point that is ~ 5% of the free air amplitude; Click ‘Simple Engage’ to activate<br />
piezo; Thumbwheel down until tip engages (which is a false engagement). Adjust set point with Hamster to ‘hard’ engage<br />
tip; you may have to use thumbwheel to adjust piezo further, but it’s already under feedback, so you’re pretty safe.<br />
(Section 6.1)<br />
Monitoring Phase during AC mode imaging: While imaging in air, you can monitor the Phase levels (Sum & Deflection<br />
meter) to determine whether the tip is in the attractive (non-contact) or repulsive (intermittent contact) regime with<br />
respect to the sample. ATTRACTIVE > free air phase > REPULSIVE (Section 6.1.4)<br />
Saving images: click Save images checkbox in Master Panel. Alternatively, File → Save Graphics…; Filename, image size<br />
and file type of your choice, click ‘path’ → choose where you want to dump it; click ‘Do it’<br />
Saving images from ccd camera (top view optics model): Open AR Video Panel; name file; click Capture button; If images<br />
aren’t already being saved.<br />
Creating a ‘Path’ in Igor to save images: Misc → New Path; name your path; click ‘Path’; click ‘Do it’. (see page 38)<br />
Exporting Line sections: In the line section graph panel that comes up, click on ‘Edit’, which brings up a new table with<br />
one column of data in it. ‘Kill’ it. Then go to Windows → New Table. Select the four waves in ‘Columns to edit’ that end<br />
with the following suffices:<br />
(Filename-suffix)lHtT, QHtT, XHtT & _HtT; click ‘Do It’<br />
Real time Section analysis: During imaging, go to MFP IP→ Analyze Panel; Select Real Time checkbox; follow<br />
directions on. See Section 12.X.<br />
Shutdown: Withdraw tip; turn off laser; if working in fluid, clean tip holder, dry.