Graphical Analysis of Variance (Graphical ANOVA) This set of slides ...
Graphical Analysis of Variance (Graphical ANOVA) This set of slides ...
Graphical Analysis of Variance (Graphical ANOVA) This set of slides ...
SHOW LESS

You also want an ePaper? Increase the reach of your titles
YUMPU automatically turns print PDFs into web optimized ePapers that Google loves.
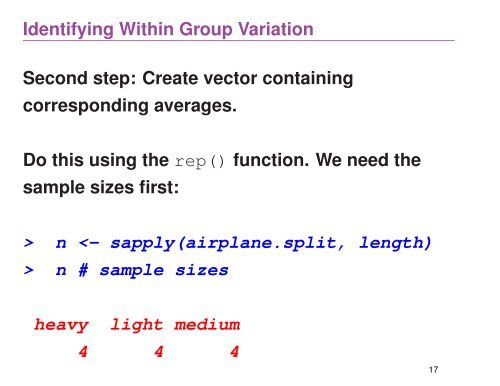
Identifying Within Group Variation<br />
Second step: Create vector containing<br />
corresponding averages.<br />
Do this using the rep() function. We need the<br />
sample sizes first:<br />
> n n # sample sizes<br />
heavy<br />
light medium<br />
4 4 4<br />
17