Graphical Analysis of Variance (Graphical ANOVA) This set of slides ...
Graphical Analysis of Variance (Graphical ANOVA) This set of slides ...
Graphical Analysis of Variance (Graphical ANOVA) This set of slides ...

You also want an ePaper? Increase the reach of your titles
YUMPU automatically turns print PDFs into web optimized ePapers that Google loves.
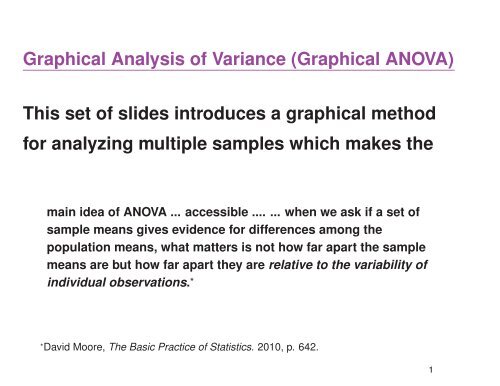
<strong>Graphical</strong> <strong>Analysis</strong> <strong>of</strong> <strong>Variance</strong> (<strong>Graphical</strong> <strong>ANOVA</strong>)<br />
<strong>This</strong> <strong>set</strong> <strong>of</strong> <strong>slides</strong> introduces a graphical method<br />
for analyzing multiple samples which makes the<br />
main idea <strong>of</strong> <strong>ANOVA</strong> ... accessible .... ... when we ask if a <strong>set</strong> <strong>of</strong><br />
sample means gives evidence for differences among the<br />
population means, what matters is not how far apart the sample<br />
means are but how far apart they are relative to the variability <strong>of</strong><br />
individual observations.*<br />
*David Moore, The Basic Practice <strong>of</strong> Statistics. 2010, p. 642.<br />
1
The Typical One Factor Layout<br />
The data consist <strong>of</strong> m samples: <strong>set</strong>s <strong>of</strong> n<br />
independent measurements taken under various<br />
conditions or treatments:<br />
Treatment 1 Treatment 2 · · · Treatment m<br />
X 11 X 21 · · · X m1<br />
X 12 X 22 · · · X m2<br />
· · · · · · · · · · · ·<br />
X 1n X 2n · · · X mn<br />
2
A Paper Airplane Experiment<br />
Does the distance travelled by a paper<br />
airplane after being thrown depend on the<br />
weight <strong>of</strong> the paper used in its construction?<br />
3
A Paper Airplane Experiment<br />
12 paper airplanes <strong>of</strong> a single design were<br />
constructed using<br />
• 20 × 27 cm sheets <strong>of</strong> paper<br />
• 3 different weights <strong>of</strong> paper (light, medium,<br />
heavy)<br />
m = 3 treatment groups with n = 4<br />
• Response: distance travelled (in m)<br />
• Factor <strong>of</strong> interest: weight <strong>of</strong> paper<br />
4
The Paper Airplane Experiment Data<br />
> airplane
Paper Airplane Data<br />
> head(airplane, n=6)<br />
paper distance<br />
1 light 3.1<br />
2 light 3.3<br />
3 light 2.1<br />
4 light 1.9<br />
5 medium 4.0<br />
6 medium 3.5<br />
6
Paper Airplane Data<br />
> tail(airplane, n=2)<br />
paper distance<br />
11 heavy 4.7<br />
12 heavy 5.3<br />
7
Displaying the Data Differently<br />
> unstack(airplane, distance ~ paper)<br />
heavy light medium<br />
1 5.1 3.1 4.0<br />
2 3.1 3.3 3.5<br />
3 4.7 2.1 4.5<br />
4 5.3 1.9 6.1<br />
8
Compare Averages for the 3 Groups<br />
First, split the data frame up by paper type:<br />
> airplane.split
Split Data Frame<br />
> airplane.split<br />
$heavy<br />
[1] 5.1 3.1 4.7 5.3<br />
$light<br />
[1] 3.1 3.3 2.1 1.9<br />
$medium<br />
[1] 4.0 3.5 4.5 6.1<br />
10
Compare Averages for the 3 Groups<br />
Now, compute the averages:<br />
> means means<br />
heavy<br />
light medium<br />
4.550 2.600 4.525<br />
11
Discussion<br />
Flight distances are different for different<br />
treatments, but they are also different within<br />
treatments<br />
What has caused the variation within each<br />
treatment?<br />
Factors other than paper weight must be having<br />
an effect: unexplained variation or error.<br />
12
Discussion<br />
Some <strong>of</strong> the possibilities are: individual airplane<br />
construction, initial throwing height, and initial<br />
thrust and direction<br />
These unmeasured factors probably vary slightly<br />
from throw to throw and thus could account for<br />
some or all <strong>of</strong> the variation observed within each<br />
treatment<br />
Is there confounding? (What is confounding?)<br />
13
Discussion<br />
The presence <strong>of</strong> unmeasured factors makes it<br />
difficult to tell if differences in paper type have an<br />
effect on flight distance<br />
Are the differences in the treatment averages due<br />
only to the unmeasured factors?<br />
14
Identifying Within Group Variation<br />
Subtract the within-group averages from each <strong>of</strong><br />
the distance values to remove any possible<br />
effects due to different types <strong>of</strong> paper.<br />
15
Identifying Within Group Variation<br />
First step: Create a vector <strong>of</strong> distances.<br />
> unlist(airplane.split)<br />
heavy1 heavy2 heavy3 heavy4 light1<br />
5.1 3.1 4.7 5.3 3.1<br />
light2 light3 light4 medium1 medium2<br />
3.3 2.1 1.9 4.0 3.5<br />
medium3 medium4<br />
4.5 6.1<br />
16
Identifying Within Group Variation<br />
Second step: Create vector containing<br />
corresponding averages.<br />
Do this using the rep() function. We need the<br />
sample sizes first:<br />
> n n # sample sizes<br />
heavy<br />
light medium<br />
4 4 4<br />
17
Identifying Within Group Variation<br />
The vector <strong>of</strong> averages:<br />
> rep(means, n)<br />
heavy heavy heavy heavy light<br />
4.550 4.550 4.550 4.550 2.600<br />
light light light medium medium<br />
2.600 2.600 2.600 4.525 4.525<br />
medium medium<br />
4.525 4.525<br />
18
Identifying Within Group Variation<br />
Subtract the averages from the original<br />
measurements.<br />
> errors
Identifying Within Group Variation<br />
Variation due to factors other than paper type:<br />
> errors<br />
heavy1 heavy2 heavy3 heavy4 light1<br />
0.550 -1.450 0.150 0.750 0.500<br />
light2 light3 light4 medium1 medium2<br />
0.700 -0.500 -0.700 -0.525 -1.025<br />
medium3 medium4<br />
-0.025 1.575<br />
20
Does paper type have an effect on mean distance?<br />
Averages <strong>of</strong> the samples vary, but maybe only<br />
because <strong>of</strong> the unmeasured factors.<br />
If this is true (and paper type does not affect mean<br />
distance), then<br />
Var( ¯X i ) = σ2<br />
n<br />
where ¯X i is the average distance in the ith<br />
sample, n is the sample size and<br />
σ 2 is the variance <strong>of</strong> the error.<br />
21
Does paper type have an effect on mean distance?<br />
Observe that, for the ith sample,<br />
Var( √ n ¯X i ) = σ 2<br />
if variability is due only to unmeasured factors.<br />
the variability <strong>of</strong> (scaled) sample averages ∼<br />
the variability in the errors, when paper type has<br />
no effect.<br />
22
Does paper type have an effect on mean distance?<br />
Let ¯X = the grand mean <strong>of</strong> the flight distances.<br />
If paper type has no effect on distance, then<br />
√ n( ¯X i − ¯X)<br />
and the errors will both have mean 0 and the same<br />
variance.<br />
(Why do we need to subtract the grand mean?)<br />
23
<strong>Graphical</strong>ly testing whether paper type has an<br />
effect on mean distance<br />
A histogram <strong>of</strong> the errors shows the variability in<br />
the errors.<br />
Since the scaled averages are supposed to have<br />
the same amount <strong>of</strong> variability when paper type<br />
has no effect, we can plot the locations <strong>of</strong> the<br />
scaled averages on the error histogram and look<br />
for any surprises.<br />
24
<strong>Graphical</strong>ly testing whether paper type has an<br />
effect on mean distance<br />
A surprising result represents evidence that paper<br />
type has an effect.<br />
In other words, look for outliers relative to the<br />
histogram.<br />
25
The <strong>Graphical</strong> Test<br />
> hist(errors, xlim=c(-3,3))<br />
> scaled.means points(scaled.means, rep(0,3),<br />
+ pch=16, col=2, cex=2.5)<br />
26
The <strong>Graphical</strong> Test<br />
Histogram <strong>of</strong> errors<br />
Frequency<br />
0.0 0.5 1.0 1.5 2.0 2.5 3.0<br />
●<br />
●<br />
−3 −2 −1 0 1 2 3<br />
errors<br />
27
The <strong>Graphical</strong> Test Result<br />
One <strong>of</strong> the scaled means is an outlier.<br />
We have strong evidence that paper type affects<br />
flight distance.<br />
28
The <strong>Graphical</strong> <strong>ANOVA</strong> Procedure<br />
1. Compute averages ¯X 1 , ¯X 2 , . . . , ¯X m and the grand average, ¯X.<br />
2. Remove treatment effects from each sample by computing errors:<br />
e ij = X ij − ¯X i ,<br />
for j = 1, . . . , n, and i = 1, . . . , m.<br />
3. Center and scale the ith treatment average by subtracting the grand<br />
average and multiplying by the sample size:<br />
√ n( ¯X i − ¯X).<br />
4. Compare the m scaled averages with a histogram <strong>of</strong> the errors.<br />
29
<strong>Graphical</strong> <strong>ANOVA</strong> Function<br />
> graphical<strong>ANOVA</strong>
Application <strong>of</strong> the function to the Airplane Data<br />
> graphical<strong>ANOVA</strong>(airplane)<br />
Frequency<br />
0.0 0.5 1.0 1.5 2.0 2.5 3.0<br />
●<br />
average heavy<br />
average light<br />
average medium<br />
●<br />
−3 −2 −1 0 1 2<br />
errors<br />
31
The <strong>Graphical</strong> <strong>ANOVA</strong> Plot<br />
The light paper average is an outlier relative to the<br />
histogram<br />
There is strong evidence that the treatment<br />
means are not all the same<br />
Otherwise, the treatment averages should be<br />
located in regions corresponding to higher<br />
histogram density<br />
32
Motor Vibration Example<br />
5 different brands <strong>of</strong> bearings are compared in<br />
terms <strong>of</strong> the amount <strong>of</strong> vibration they generate in<br />
an electric motor*<br />
*The motor vibration data can be found in the Devore5 library (Bates, 2004)<br />
33
Motor Vibration Data<br />
> motor head(motor)<br />
V1 V2 V3 V4 V5<br />
1 13.1 16.3 13.7 15.7 13.5<br />
2 15.0 15.7 13.9 13.7 13.4<br />
3 14.0 17.2 12.4 14.4 13.2<br />
4 14.4 14.9 13.8 16.0 12.7<br />
5 14.0 14.4 14.9 13.9 13.4<br />
6 11.6 17.2 13.3 14.7 12.3<br />
34
Motor Vibration Data<br />
> names(motor) motors head(motors)<br />
values ind<br />
1 13.1 Brand 1<br />
2 15.0 Brand 1<br />
3 14.0 Brand 1<br />
4 14.4 Brand 1<br />
5 14.0 Brand 1<br />
6 11.6 Brand 1<br />
35
Motor Vibration Data<br />
> tail(motors, n=2)<br />
values ind<br />
29 13.4 Brand 5<br />
30 12.3 Brand 5<br />
36
Motor Vibration Data<br />
> names(motors) head(motors, n=3)<br />
vibration bearing brand<br />
1 13.1 Brand 1<br />
2 15.0 Brand 1<br />
3 14.0 Brand 1<br />
37
Motor Vibration Data<br />
> graphical<strong>ANOVA</strong>(motors[,c(2,1)])<br />
38
Motor Vibration Data<br />
Frequency<br />
0 2 4 6 8 10<br />
●<br />
●<br />
average Brand 1<br />
average Brand 2<br />
average Brand 3<br />
average Brand 4<br />
average Brand 5<br />
●<br />
●<br />
−2 0 2 4<br />
errors<br />
39
Motor Vibration<br />
The second brand average appears in the extreme<br />
right tail.<br />
There is clear evidence that the amount <strong>of</strong><br />
vibration depends on the type <strong>of</strong> bearing.<br />
40
An Example Using Simulated Data<br />
What does this <strong>ANOVA</strong> plot look like if there really<br />
is no difference between the samples?<br />
To check, we simulate 40 independent<br />
observations from a normal distribution with<br />
mean 0 and variance 1.<br />
We pretend that the first 10 observations are from<br />
1 sample, the second <strong>set</strong> <strong>of</strong> 10 are from another<br />
sample, and so on.<br />
41
Simulated Data<br />
> <strong>set</strong>.seed(12030); pretenddata samplenumber pretend.df rm(pretenddata, samplenumber)<br />
> head(pretend.df, n=3)<br />
samplenumber pretenddata<br />
1 1 0.3752435<br />
2 1 -0.6727016<br />
3 1 0.8656027<br />
42
Simulated Data<br />
> graphical<strong>ANOVA</strong>(pretend.df)<br />
43
Simulated Data<br />
Frequency<br />
0 5 10 15<br />
●<br />
average 1<br />
average 2<br />
average 3<br />
average 4<br />
●<br />
−3 −2 −1 0 1 2 3 4<br />
errors<br />
44