

Estimation, Evaluation, and Selection of Actuarial Models
Estimation, Evaluation, and Selection of Actuarial Models
Estimation, Evaluation, and Selection of Actuarial Models

You also want an ePaper? Increase the reach of your titles
YUMPU automatically turns print PDFs into web optimized ePapers that Google loves.
2.1. INTRODUCTION 5<br />
Policyholder Time <strong>of</strong> death Time <strong>of</strong> surrender<br />
1 0.1<br />
2 4.8 0.5<br />
3 0.8<br />
4 0.8 3.9<br />
5 3.1 1.8<br />
6 1.8<br />
7 2.1<br />
8 2.5<br />
9 2.8<br />
10 2.9 4.6<br />
11 2.9 4.6<br />
12 3.9<br />
13 4.0<br />
14 4.0<br />
15 4.1<br />
16 4.8<br />
17 4.8<br />
18 4.8<br />
19-30<br />
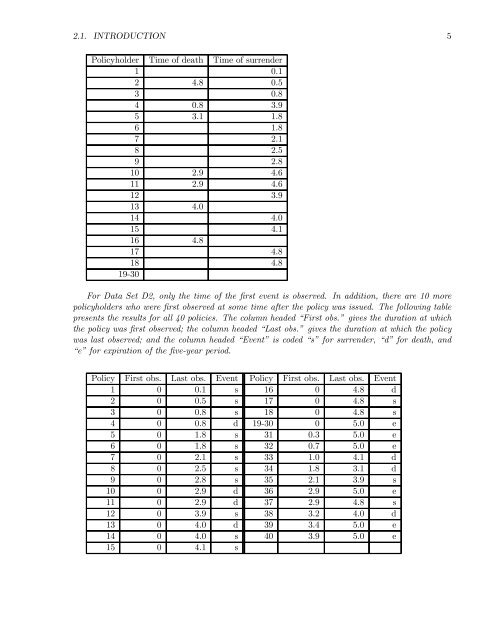
For Data Set D2, only the time <strong>of</strong> the first event is observed. In addition, there are 10 more<br />
policyholders who were first observed at some time after the policy was issued. The following table<br />
presents the results for all 40 policies. The column headed “First obs.” gives the duration at which<br />
the policy was first observed; the column headed “Last obs.” gives the duration at which the policy<br />
was last observed; <strong>and</strong> the column headed “Event” is coded “s” for surrender, “d” for death, <strong>and</strong><br />
“e” for expiration <strong>of</strong> the five-year period.<br />
Policy First obs. Last obs. Event Policy First obs. Last obs. Event<br />
1 0 0.1 s 16 0 4.8 d<br />
2 0 0.5 s 17 0 4.8 s<br />
3 0 0.8 s 18 0 4.8 s<br />
4 0 0.8 d 19-30 0 5.0 e<br />
5 0 1.8 s 31 0.3 5.0 e<br />
6 0 1.8 s 32 0.7 5.0 e<br />
7 0 2.1 s 33 1.0 4.1 d<br />
8 0 2.5 s 34 1.8 3.1 d<br />
9 0 2.8 s 35 2.1 3.9 s<br />
10 0 2.9 d 36 2.9 5.0 e<br />
11 0 2.9 d 37 2.9 4.8 s<br />
12 0 3.9 s 38 3.2 4.0 d<br />
13 0 4.0 d 39 3.4 5.0 e<br />
14 0 4.0 s 40 3.9 5.0 e<br />
15 0 4.1 s


