Estimation, Evaluation, and Selection of Actuarial Models
Estimation, Evaluation, and Selection of Actuarial Models Estimation, Evaluation, and Selection of Actuarial Models
58 CHAPTER 3. SAMPLING PROPERTIES OF ESTIMATORS Changing the signs and inverting produces the same values as in (3.4). This is a feature of the lognormal distribution that need not hold for other models. ¤ Sometimes it is not even possible to take the derivative. In that case an approximate second derivative can be used. A reasonable approximation is ∂ 2 f(θ) . 1 = [f(θ + h i e i /2+h j e j /2) − f(θ + h i e i /2 − h j e j /2) ∂θ i ∂θ j h i h j −f(θ − h i e i /2+h j e j /2) + f(θ − h i e i /2 − h j e j /2)] where e i is a vector with all zeroes except for a one in the ith position and h i = θ i /10 v where v is one-third the number of significant digits used in calculations. Example 3.32 Repeat the previous example, using approximate derivatives. Assume that there are 15 significant digits being used. Then h 1 = 6.1379/10 5 and h 2 = 1.3894/10 5 . Reasonably close values are 0.00006 and 0.00001. The first approximation is ∂ 2 l ∂µ 2 . = l(6.13796, 1.3894) − 2l(6.1379, 1.3894) + l(6.13784, 1.3894) (0.00006) 2 = −157.713893081982 − 2(−157.713893049683) + (−157.713893054682) (0.00006) 2 = −10.3604. The other two approximations are ∂ 2 l/∂σ∂µ = . 0.0003 ∂ 2 l/∂σ 2 . = −20.7208. We see that here the approximation works very well. ¤ For grouped data, the process works the same way. In Loss Models on pages 59 and 66 it is noted that the information can be obtained using only first partial derivatives. These still may need to be numerically evaluated. Exercise 67 Determine 95% confidence intervals for the parameters of exponential and gamma models for Data Set B. The likelihood function and maximum likelihood estimates were determined in Example 2.32. Exercise 68 Let X have a uniform distribution on the interval from 0 to θ. Show that the maximum likelihood estimator is ˆθ =max(X 1 ,...,X n ). Use Examples 3.7 and 3.10 to show that this estimator is asymptotically unbiased and to obtain its variance. Show that Theorem 3.29 yields a negative estimate of the variance and that item (ii) in the conditions does not hold. The information matrix provides a method for assessing the quality of the maximum likelihood estimators of a distribution’s parameters. However, we are often more interested in a quantity that
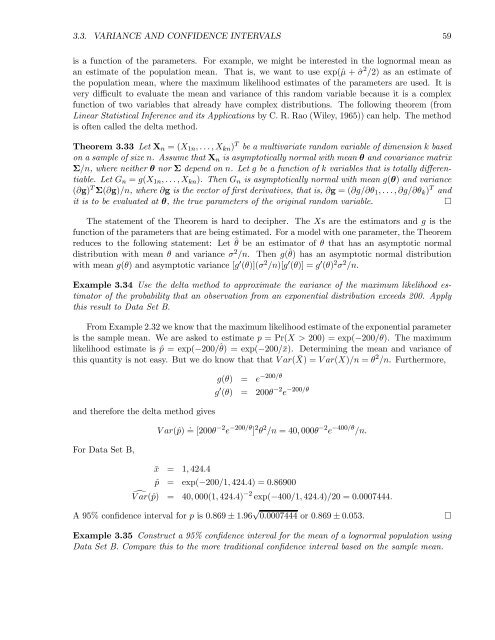
3.3. VARIANCE AND CONFIDENCE INTERVALS 59 is a function of the parameters. For example, we might be interested in the lognormal mean as an estimate of the population mean. That is, we want to use exp(ˆµ +ˆσ 2 /2) as an estimate of the population mean, where the maximum likelihood estimates of the parameters are used. It is very difficult to evaluate the mean and variance of this random variable because it is a complex function of two variables that already have complex distributions. The following theorem (from Linear Statistical Inference and its Applications by C. R. Rao (Wiley, 1965)) can help. The method is often called the delta method. Theorem 3.33 Let X n =(X 1n ,...,X kn ) T be a multivariate random variable of dimension k based on a sample of size n. Assume that X n is asymptotically normal with mean θ and covariance matrix Σ/n, where neither θ nor Σ depend on n. Letg be a function of k variables that is totally differentiable. Let G n = g(X 1n ,...,X kn ).ThenG n is asymptotically normal with mean g(θ) and variance (∂g) T Σ(∂g)/n, where∂g is the vector of first derivatives, that is, ∂g =(∂g/∂θ 1 ,...,∂g/∂θ k ) T and it is to be evaluated at θ, the true parameters of the original random variable. ¤ The statement of the Theorem is hard to decipher. The Xs are the estimators and g is the function of the parameters that are being estimated. For a model with one parameter, the Theorem reduces to the following statement: Let ˆθ be an estimator of θ that has an asymptotic normal distribution with mean θ and variance σ 2 /n. Then g(ˆθ) has an asymptotic normal distribution with mean g(θ) and asymptotic variance [g 0 (θ)](σ 2 /n)[g 0 (θ)] = g 0 (θ) 2 σ 2 /n. Example 3.34 Use the delta method to approximate the variance of the maximum likelihood estimator of the probability that an observation from an exponential distribution exceeds 200. Apply this result to Data Set B. From Example 2.32 we know that the maximum likelihood estimate of the exponential parameter is the sample mean. We are asked to estimate p =Pr(X>200) = exp(−200/θ). The maximum likelihood estimate is ˆp =exp(−200/ˆθ) =exp(−200/¯x). Determining the mean and variance of this quantity is not easy. But we do know that that Var( ¯X) =Var(X)/n = θ 2 /n. Furthermore, and therefore the delta method gives For Data Set B, g(θ) = e −200/θ g 0 (θ) = 200θ −2 e −200/θ Var(ˆp) . = [200θ −2 e −200/θ ] 2 θ 2 /n =40, 000θ −2 e −400/θ /n. ¯x = 1, 424.4 ˆp = exp(−200/1, 424.4) = 0.86900 dVar(ˆp) = 40, 000(1, 424.4) −2 exp(−400/1, 424.4)/20 = 0.0007444. A 95% confidence interval for p is 0.869 ± 1.96 √ 0.0007444 or 0.869 ± 0.053. ¤ Example 3.35 Construct a 95% confidence interval for the mean of a lognormal population using Data Set B. Compare this to the more traditional confidence interval based on the sample mean.
- Page 12 and 13: 8 CHAPTER 2. MODEL ESTIMATION and t
- Page 14 and 15: 10 CHAPTER 2. MODEL ESTIMATION of t
- Page 16 and 17: 12 CHAPTER 2. MODEL ESTIMATION Exer
- Page 18 and 19: 14 CHAPTER 2. MODEL ESTIMATION i d
- Page 20 and 21: 16 CHAPTER 2. MODEL ESTIMATION 8. C
- Page 22 and 23: 18 CHAPTER 2. MODEL ESTIMATION Exer
- Page 24 and 25: 20 CHAPTER 2. MODEL ESTIMATION In e
- Page 26 and 27: 22 CHAPTER 2. MODEL ESTIMATION Exam
- Page 28 and 29: 24 CHAPTER 2. MODEL ESTIMATION That
- Page 30 and 31: 26 CHAPTER 2. MODEL ESTIMATION Unle
- Page 32 and 33: 28 CHAPTER 2. MODEL ESTIMATION like
- Page 34 and 35: 30 CHAPTER 2. MODEL ESTIMATION For
- Page 36 and 37: 32 CHAPTER 2. MODEL ESTIMATION like
- Page 38 and 39: 34 CHAPTER 2. MODEL ESTIMATION wher
- Page 40 and 41: 36 CHAPTER 2. MODEL ESTIMATION Exer
- Page 42 and 43: 38 CHAPTER 3. SAMPLING PROPERTIES O
- Page 44 and 45: 40 CHAPTER 3. SAMPLING PROPERTIES O
- Page 46 and 47: 42 CHAPTER 3. SAMPLING PROPERTIES O
- Page 48 and 49: 44 CHAPTER 3. SAMPLING PROPERTIES O
- Page 50 and 51: 46 CHAPTER 3. SAMPLING PROPERTIES O
- Page 52 and 53: 48 CHAPTER 3. SAMPLING PROPERTIES O
- Page 54 and 55: 50 CHAPTER 3. SAMPLING PROPERTIES O
- Page 56 and 57: 52 CHAPTER 3. SAMPLING PROPERTIES O
- Page 58 and 59: 54 CHAPTER 3. SAMPLING PROPERTIES O
- Page 60 and 61: 56 CHAPTER 3. SAMPLING PROPERTIES O
- Page 64 and 65: 60 CHAPTER 3. SAMPLING PROPERTIES O
- Page 66 and 67: 62 CHAPTER 4. MODEL EVALUATION AND
- Page 68 and 69: 64 CHAPTER 4. MODEL EVALUATION AND
- Page 70 and 71: 66 CHAPTER 4. MODEL EVALUATION AND
- Page 72 and 73: 68 CHAPTER 4. MODEL EVALUATION AND
- Page 74 and 75: 70 CHAPTER 4. MODEL EVALUATION AND
- Page 76 and 77: 72 CHAPTER 4. MODEL EVALUATION AND
- Page 78 and 79: 74 CHAPTER 4. MODEL EVALUATION AND
- Page 80 and 81: 76 CHAPTER 4. MODEL EVALUATION AND
- Page 82 and 83: 78 CHAPTER 4. MODEL EVALUATION AND
- Page 84 and 85: 80 CHAPTER 4. MODEL EVALUATION AND
- Page 86 and 87: 82 CHAPTER 4. MODEL EVALUATION AND
- Page 88 and 89: 84 CHAPTER 4. MODEL EVALUATION AND
- Page 90 and 91: 86 CHAPTER 5. MODELS WITH COVARIATE
- Page 92 and 93: 88 CHAPTER 5. MODELS WITH COVARIATE
- Page 94 and 95: 90 CHAPTER 5. MODELS WITH COVARIATE
- Page 96 and 97: 92 CHAPTER 5. MODELS WITH COVARIATE
- Page 98 and 99: 94 CHAPTER 5. MODELS WITH COVARIATE
- Page 100 and 101: 96 APPENDIX A. SOLUTIONS TO EXERCIS
- Page 102 and 103: 98 APPENDIX A. SOLUTIONS TO EXERCIS
- Page 104 and 105: 100 APPENDIX A. SOLUTIONS TO EXERCI
- Page 106 and 107: 102 APPENDIX A. SOLUTIONS TO EXERCI
- Page 108 and 109: 104 APPENDIX A. SOLUTIONS TO EXERCI
- Page 110 and 111: 106 APPENDIX A. SOLUTIONS TO EXERCI
3.3. VARIANCE AND CONFIDENCE INTERVALS 59<br />
is a function <strong>of</strong> the parameters. For example, we might be interested in the lognormal mean as<br />
an estimate <strong>of</strong> the population mean. That is, we want to use exp(ˆµ +ˆσ 2 /2) as an estimate <strong>of</strong><br />
the population mean, where the maximum likelihood estimates <strong>of</strong> the parameters are used. It is<br />
very difficult to evaluate the mean <strong>and</strong> variance <strong>of</strong> this r<strong>and</strong>om variable because it is a complex<br />
function <strong>of</strong> two variables that already have complex distributions. The following theorem (from<br />
Linear Statistical Inference <strong>and</strong> its Applications by C. R. Rao (Wiley, 1965)) can help. The method<br />
is <strong>of</strong>ten called the delta method.<br />
Theorem 3.33 Let X n =(X 1n ,...,X kn ) T be a multivariate r<strong>and</strong>om variable <strong>of</strong> dimension k based<br />
on a sample <strong>of</strong> size n. Assume that X n is asymptotically normal with mean θ <strong>and</strong> covariance matrix<br />
Σ/n, where neither θ nor Σ depend on n. Letg be a function <strong>of</strong> k variables that is totally differentiable.<br />
Let G n = g(X 1n ,...,X kn ).ThenG n is asymptotically normal with mean g(θ) <strong>and</strong> variance<br />
(∂g) T Σ(∂g)/n, where∂g is the vector <strong>of</strong> first derivatives, that is, ∂g =(∂g/∂θ 1 ,...,∂g/∂θ k ) T <strong>and</strong><br />
it is to be evaluated at θ, the true parameters <strong>of</strong> the original r<strong>and</strong>om variable. ¤<br />
The statement <strong>of</strong> the Theorem is hard to decipher. The Xs are the estimators <strong>and</strong> g is the<br />
function <strong>of</strong> the parameters that are being estimated. For a model with one parameter, the Theorem<br />
reduces to the following statement: Let ˆθ be an estimator <strong>of</strong> θ that has an asymptotic normal<br />
distribution with mean θ <strong>and</strong> variance σ 2 /n. Then g(ˆθ) has an asymptotic normal distribution<br />
with mean g(θ) <strong>and</strong> asymptotic variance [g 0 (θ)](σ 2 /n)[g 0 (θ)] = g 0 (θ) 2 σ 2 /n.<br />
Example 3.34 Use the delta method to approximate the variance <strong>of</strong> the maximum likelihood estimator<br />
<strong>of</strong> the probability that an observation from an exponential distribution exceeds 200. Apply<br />
this result to Data Set B.<br />
From Example 2.32 we know that the maximum likelihood estimate <strong>of</strong> the exponential parameter<br />
is the sample mean. We are asked to estimate p =Pr(X>200) = exp(−200/θ). The maximum<br />
likelihood estimate is ˆp =exp(−200/ˆθ) =exp(−200/¯x). Determining the mean <strong>and</strong> variance <strong>of</strong><br />
this quantity is not easy. But we do know that that Var( ¯X) =Var(X)/n = θ 2 /n. Furthermore,<br />
<strong>and</strong> therefore the delta method gives<br />
For Data Set B,<br />
g(θ) = e −200/θ<br />
g 0 (θ) = 200θ −2 e −200/θ<br />
Var(ˆp) . = [200θ −2 e −200/θ ] 2 θ 2 /n =40, 000θ −2 e −400/θ /n.<br />
¯x = 1, 424.4<br />
ˆp = exp(−200/1, 424.4) = 0.86900<br />
dVar(ˆp) = 40, 000(1, 424.4) −2 exp(−400/1, 424.4)/20 = 0.0007444.<br />
A 95% confidence interval for p is 0.869 ± 1.96 √ 0.0007444 or 0.869 ± 0.053. ¤<br />
Example 3.35 Construct a 95% confidence interval for the mean <strong>of</strong> a lognormal population using<br />
Data Set B. Compare this to the more traditional confidence interval based on the sample mean.


