Discipline Opportunity Strategy - Canadian Natural Resources Ltd.
Discipline Opportunity Strategy - Canadian Natural Resources Ltd.
Discipline Opportunity Strategy - Canadian Natural Resources Ltd.

Create successful ePaper yourself
Turn your PDF publications into a flip-book with our unique Google optimized e-Paper software.
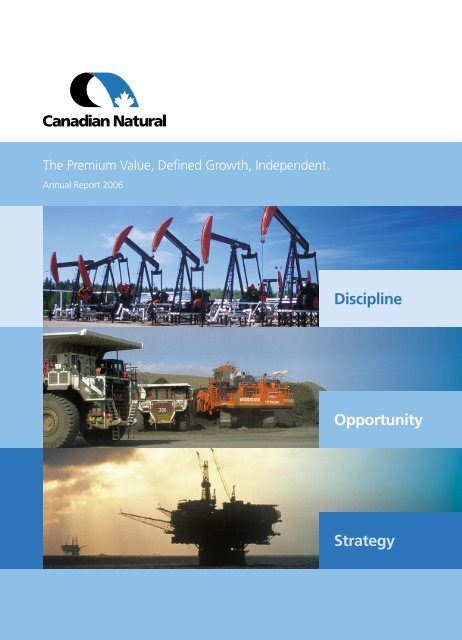
The Premium Value, Defi ned Growth, Independent.<br />
Annual Report 2006<br />
<strong>Discipline</strong><br />
<strong>Opportunity</strong><br />
<strong>Strategy</strong>
General Information<br />
COMPANY DEFINITION<br />
Throughout the annual report, <strong>Canadian</strong> <strong>Natural</strong> <strong>Resources</strong> Limited<br />
is referred to as “us”, “we”, “our”,“<strong>Canadian</strong> <strong>Natural</strong>”, or the<br />
“Company”.<br />
CURRENCY<br />
All amounts are reported in <strong>Canadian</strong> currency unless otherwise<br />
stated.<br />
ABBREVIATIONS<br />
ACC Anadarko Canada Corporation<br />
AECO Alberta natural gas reference location<br />
AIF Annual Information Form<br />
bbl barrel<br />
bbl/d barrels per day<br />
bcf billion cubic feet<br />
bcf/d billion cubic feet per day<br />
boe barrels of oil equivalent<br />
boe/d barrels of oil equivalent per day<br />
C$ <strong>Canadian</strong> dollars<br />
CBM Coal Bed Methane<br />
CNUG <strong>Canadian</strong> <strong>Natural</strong> Upgrader<br />
CO2 Carbon Dioxide<br />
CO E 2 Carbon Dioxide Equivalents<br />
CSS Cyclic Steam Stimulation<br />
EOR Enhanced Oil Recovery<br />
E&P Exploration and Production<br />
FPSO Floating Production, Storage and Offtake Vessel<br />
GHG Greenhouse Gas<br />
Horizon Project Horizon Oil Sands Project<br />
mbbl thousand barrels<br />
mbbl/d thousand barrels per day<br />
mboe thousand barrels of oil equivalent<br />
mboe/d thousand barrels of oil equivalent per day<br />
mcf thousand cubic feet<br />
mcf/d thousand cubic feet per day<br />
mmbbl million barrels<br />
mmboe million barrels of oil equivalent<br />
mmbtu million British thermal units<br />
mmcf/d million cubic feet per day<br />
NGLs <strong>Natural</strong> gas liquids<br />
NYMEX New York Mercantile Exchange<br />
NYSE New York Stock Exchange<br />
OGIP Original Gas In Place<br />
OOIP Original Oil In Place<br />
SAGD Steam Assisted Gravity Drainage<br />
SCO Synthetic light crude oil<br />
SEC Securities and Exchange Commission<br />
tcf trillion cubic feet<br />
TSX Toronto Stock Exchange<br />
UK United Kingdom<br />
US United States<br />
US$ United States dollars<br />
WCS Western <strong>Canadian</strong> Select crude oil blend<br />
WCSB Western <strong>Canadian</strong> Sedimentary Basin<br />
WTI West Texas Intermediate<br />
CAUTIONARY STATEMENTS<br />
Certain information regarding the Company contained herein may<br />
constitute forward-looking statements under applicable securities<br />
laws. Such statements are subject to known or unknown risks and<br />
uncertainties that may cause actual results to differ materially from<br />
those anticipated or implied in the forward-looking statements.<br />
Please refer to page 42 for the complete special note regarding<br />
forward-looking statements.<br />
All production and sales statistics represent <strong>Canadian</strong> <strong>Natural</strong>’s<br />
working interest amounts before deduction of royalties unless<br />
stated otherwise. Where volumes are reported in barrels of oil<br />
equivalent (“boe”), natural gas is converted to oil at six thousand<br />
cubic feet per barrel. This conversion may be misleading, particularly<br />
when used in isolation, since the 6 mcf:1 bbl ratio is based on an<br />
energy equivalency at the burner tip and does not represent the<br />
value equivalency at the well head. Methodologies for determining<br />
annual reserves are described on pages 37 to 41.<br />
This report also includes references to financial measures commonly<br />
used in the oil and gas industry that are not defined by Generally<br />
Accepted Accounting Principles (“GAAP”). The Company uses these<br />
measures to evaluate its performance, however they should not be<br />
considered an alternative to or more meaningful than net earnings.<br />
COMMON SHARE DIVIDEND<br />
The Company paid its first dividend on its common shares on<br />
April 1, 2001. Since then, dividends have been paid on the first day<br />
of every January, April, July and October.<br />
The following table, restated for the two-for-one subdivisions of the<br />
common shares that occurred in May 2004 and May 2005, shows the<br />
aggregate amount of the cash dividends declared per common share<br />
in each of its last three years ended December 31.<br />
2006 2005 2004<br />
Cash dividends declared<br />
per common share $ 0.300 $ 0.236 $ 0.200<br />
NOTICE OF ANNUAL MEETING<br />
<strong>Canadian</strong> <strong>Natural</strong>’s Annual and Special Meeting of the Shareholders<br />
will be held on Thursday, May 3, 2007 at 3:00 p.m. Mountain Daylight<br />
Time in the Ballroom of the Metropolitan Centre, Calgary, Alberta.<br />
METRIC CONVERSION CHART<br />
To convert To Multiply by<br />
barrels cubic metres 0.159<br />
thousand cubic feet cubic metres 28.174<br />
feet metres 0.305<br />
miles kilometres 1.609<br />
acres hectares 0.405<br />
tonnes tons 1.102
2 Highlights<br />
4 Letter to Shareholders<br />
8 Our World-Class Team<br />
10 Review of Operations<br />
14 Marketing<br />
17 Health & Safety, Environment & Community<br />
20 The Assets<br />
37 Year-End Reserves<br />
42 Management’s Discussion and Analysis<br />
72 Management’s Report<br />
73 Management’s Assessment of Internal<br />
Control over Financial Reporting<br />
74 Independent Auditor’s Report<br />
75 Consolidated Financial Statements<br />
78 Notes to the Consolidated Financial Statements<br />
99 Supplementary Oil & Gas Information<br />
104 Ten-Year Review<br />
106 Corporate Information<br />
Our business strategy is solid and proven. Our teams continue to<br />
demonstrate discipline in a challenging environment, capitalizing on<br />
opportunities as they arise.<br />
Maintain <strong>Discipline</strong><br />
Embrace Opportunities<br />
Operate Strategically
<strong>Canadian</strong> <strong>Natural</strong> AR2006<br />
Page 2 of 107<br />
Highlights<br />
2006 2005 2004<br />
FINANCIAL ($ millions, except per share data)<br />
Revenue, before royalties $ 11,643 $ 11,130 $ 8,269<br />
Net earnings $ 2,524 $ 1,050 $ 1,405<br />
Per common share – basic (1) $ 4.70 $ 1.96 $ 2.62<br />
– diluted (1) $ 4.70 $ 1.95 $ 2.60<br />
Adjusted net earnings from operations (2) $ 1,664 $ 2,034 $ 1,405<br />
Per common share – basic (1) $ 3.10 $ 3.79 $ 2.62<br />
– diluted (1) $ 3.10 $ 3.78 $ 2.60<br />
Cash flow from operations (2) $ 4,932 $ 5,021 $ 3,769<br />
Per common share – basic (1) $ 9.18 $ 9.36 $ 7.03<br />
– diluted (1) $ 9.18 $ 9.33 $ 6.98<br />
Capital expenditures, net of dispositions $ 12,025 $ 4,932 $ 4,633<br />
Long-term debt $ 11,043 $ 3,321 $ 3,538<br />
Shareholders’ equity $ 10,690 $ 8,237 $ 7,324<br />
OPERATING<br />
Daily production, before royalties<br />
Crude oil and NGLs (mbbl/d)<br />
North America 235 222 206<br />
North Sea 60 68 65<br />
Offshore West Africa 37 23 12<br />
<strong>Natural</strong> gas (mmcf/d)<br />
332 313 283<br />
North America 1,468 1,416 1,330<br />
North Sea 15 19 50<br />
Offshore West Africa 9 4 8<br />
1,492 1,439 1,388<br />
Barrels of oil equivalent (mboe/d)<br />
(1) Restated to reflect two-for-one share splits in May 2004 and May 2005.<br />
581 553 514<br />
(2) Adjusted net earnings from operations and cash flow from operations are non-GAAP terms that represent net earnings adjusted for certain items of a nonoperational<br />
and non-cash nature. The Company evaluates its performance based on these measures. Adjusted net earnings from operations and cash flow from<br />
operations may not be comparable to similar measures presented by other companies.<br />
Cash flow from operations (C$ millions)<br />
06<br />
05<br />
04<br />
03<br />
02<br />
4,932<br />
5,021<br />
3,769<br />
3,160<br />
2,254<br />
Total production, before royalties (mboe/d)<br />
06<br />
05<br />
04<br />
03<br />
02<br />
581<br />
553<br />
514<br />
459<br />
421
Highlights<br />
Page 3 of 107<br />
Company gross conventional proved reserves (mmboe)<br />
06<br />
05<br />
04<br />
03<br />
02<br />
Drilling activity (net wells, excluding stratigraphic test/service wells) 2006 2005 2004<br />
North America 1,351 1,617 1,099<br />
North Sea 8 13 11<br />
Offshore West Africa 4 4 3<br />
1,363 1,634 1,113<br />
Core undeveloped landholdings (thousands of net acres)<br />
North America 12,785 10,947 11,523<br />
North Sea 299 352 565<br />
Offshore West Africa 207 426 886<br />
Company gross proved reserves (before royalties)<br />
Conventional crude oil and NGLs (mmbbl)<br />
North America 1,043 785 695<br />
North Sea 299 290 303<br />
Offshore West Africa 145 148 125<br />
Conventional natural gas (bcf)<br />
1,487 1,223 1,123<br />
North America 4,507 3,378 3,202<br />
North Sea 37 29 27<br />
Offshore West Africa 69 83 81<br />
4,613 3,490 3,310<br />
Barrels of oil equivalent (mmboe) 2,256 1,804 1,674<br />
Net proved reserves (after royalties)<br />
Conventional crude oil and NGLs (mmbbl)<br />
North America 887 694 648<br />
North Sea 299 290 303<br />
Offshore West Africa 130 134 115<br />
Conventional natural gas (bcf)<br />
1,316 1,118 1,066<br />
North America 3,705 2,741 2,591<br />
North Sea 37 29 27<br />
Offshore West Africa 56 72 72<br />
3,798 2,842 2,690<br />
Barrels of oil equivalent (mmboe) 1,949 1,592 1,514<br />
Net oil sands proved mineable reserves (after royalties)<br />
Bitumen (mmbbl) 1,853 1,848 –<br />
Synthetic crude oil* (mmbbl)<br />
* SCO reserves are based upon upgrading of the bitumen reserves.<br />
The reserves shown for bitumen and SCO are not additive.<br />
1,596 1,626 –<br />
2,256<br />
1,804<br />
1,674<br />
1,526<br />
1,497<br />
Closing TSX share price<br />
(C$/share, adjusted for 2004 and 2005 share splits)<br />
06<br />
05<br />
04<br />
03<br />
02<br />
62.15<br />
57.63<br />
25.63<br />
16.34<br />
11.70
<strong>Canadian</strong> <strong>Natural</strong> AR2006<br />
Page 4 of 107<br />
Letter to Shareholders<br />
ALLAN P. MARKIN,<br />
CHAIRMAN OF THE BOARD<br />
STRATEGIES AND THE BUSINESS ENVIRONMENT<br />
Commodity prices remained strong, but volatile, during 2006<br />
with both natural gas and crude oil pricing dropping during the<br />
second half of the year due to a combination of buildup of product<br />
inventories and reduced political and weather risk.<br />
However, the robust price environment of the past two years has<br />
resulted in significant cost inflation throughout all of our basins.<br />
In particular, for our Western <strong>Canadian</strong> natural gas business, the<br />
cost increases have been excessive. High demand has resulted in<br />
increased pricing – but this was coupled with inefficiencies to create<br />
a very unfavorable cost environment for organic growth. Efficiency of<br />
many service crews were low due to a lack of trained personnel. This<br />
was combined with an unusually warm start to the 2005/6 winter<br />
drilling season and the resultant aggressive attempts by industry to<br />
complete drilling programs prior to the end of the winter operating<br />
season. The result was some of the highest finding and development<br />
costs in history for the natural gas industry in Canada.<br />
We responded by optimizing our capital allocation to only the<br />
highest return on capital projects. We significantly cut natural gas<br />
spending and shifted capital into heavy crude oil drilling.<br />
While we control an extensive asset base of heavy crude oil<br />
properties, available markets have historically precluded a large<br />
ramp up production. Our heavy crude oil marketing plan has sought<br />
to expand available markets through a combination of product<br />
blending, expansion of pipeline systems to new geographic regions<br />
and the encouragement of new conversion capacity. During 2006,<br />
<strong>Canadian</strong> <strong>Natural</strong> and industry had major success in this regard<br />
through two pipeline reversals expanding capacity into the Cushing<br />
hub and, importantly for <strong>Canadian</strong> <strong>Natural</strong>, to the US Gulf Coast<br />
as we have committed capacity on this line for a period of 5 years.<br />
As a result of these developments the market for <strong>Canadian</strong> heavy<br />
crude oil greatly expanded. As a consequence, our heavy crude<br />
oil discount to light crude oil migrated towards the higher priced<br />
Mayan heavy benchmark crude.<br />
N. MURRAY EDWARDS,<br />
VICE-CHAIRMAN OF THE BOARD<br />
For <strong>Canadian</strong> <strong>Natural</strong>, 2006 was a year of both challenges and tremendous opportunities. Higher commodity prices were<br />
accompanied by significant cost inflation throughout each of our basins, meaning that we had to be even more vigilant<br />
ensuring full cycle economics were maintained. Challenge, however, often leads to opportunities as well – and 2006 presented<br />
a compelling opportunity to acquire Anadarko Canada Corporation (“ACC”). We were well positioned to seize upon this<br />
opportunity, in the process adding tremendous upside potential into our natural gas project portfolio.<br />
While we experienced heavy crude oil differentials of 41% of the<br />
WTI benchmark price entering 2006, by April 2006 it had reduced<br />
to 28% and averaged 29% over the last nine months of the year.<br />
These reduced differentials coupled with a more controllable cost<br />
environment in heavy oil development results in exceptionally<br />
strong economics and a re-emphasis on this type of activity in 2006<br />
and 2007.<br />
<strong>Canadian</strong> <strong>Natural</strong>’s strategy allows us to allocate capital to maximize<br />
returns and remains predicated on:<br />
� Maintaining a large project portfolio in every basin we operate<br />
to enable us to continually high-grade current developments.<br />
� Maintaining balance in our product mix, project time horizons<br />
and financing strategies.<br />
� Continually balancing between acquisitions and exploration,<br />
but remain focused on low cost exploitation.<br />
� Identifying and completing opportunistic major acquisitions.<br />
� Controlling costs through area knowledge and domination of<br />
core focus regions.<br />
NORTH AMERICAN NATURAL GAS – MAINTAINING<br />
DISCIPLINE / CAPTURING OPPORTUNITY<br />
We remain a significant producer of natural gas in Canada,<br />
representing approximately 10% of western <strong>Canadian</strong> output.<br />
Further, our undeveloped land base represents the largest portfolio<br />
in the industry - meaning that we have exposure to virtually every<br />
play type found in the basin. <strong>Natural</strong> gas remains our largest single<br />
product sold at about 42% of our production mix in 2006, similar<br />
to the 43% recorded in 2005.<br />
The challenges for organic growth of natural gas were articulated<br />
earlier. In our view, the cost structure erodes gas economics<br />
considerably when compared to that achieved for heavy oil.<br />
We were one of the first in the industry to address the effects of this<br />
inflation through reallocation of capital from natural gas into heavy
Letter to Shareholders<br />
Page 5 of 107<br />
JOHN G. LANGILLE,<br />
VICE-CHAIRMAN OF THE BOARD<br />
oil during the second quarter of last year. This activity reduction was<br />
expanded throughout 2006 and carries into 2007. For example,<br />
while we drilled 975 natural gas wells in 2005, we had reduced<br />
that to 732 in 2006 with a further reduction to 423 planned<br />
for 2007.<br />
Challenges to industry often create opportunity and during the<br />
second half of 2006 we were able to seize upon the ability to<br />
acquire ACC. It was our confidence in our ability to deliver the<br />
Horizon Project coupled with our strong balance sheet that enabled<br />
us to complete this transaction.<br />
We consider the ACC assets to be high quality, long life properties<br />
with significant upside beyond the proved reserves – in fact, it<br />
may prove to be the most significant natural gas acquisition in<br />
our history. The assets provide exposure to a variety of play types<br />
and greatly complement our existing asset base. In addition to<br />
significant production and undeveloped land, a vast infrastructure<br />
and processing capacity will benefit both our heritage properties<br />
and new developments. We believe ACC’s proved reserves<br />
were acquired at an attractive price, particularly given the costs<br />
of organic growth in the basin; and, in the process we have<br />
significantly increased our project portfolio available to drive future<br />
organic growth.<br />
Integration of people and assets is now complete and we are<br />
looking forward to developing our expanded and exceptional<br />
portfolio of natural gas opportunities. The majority of the ACC<br />
team has been retained, further bolstering our own depth. We look<br />
forward to working together with each of these team members<br />
over the coming years as we maximize the value of the expanded<br />
asset base. Already, our five and ten year drilling programs are<br />
reflecting alternatives to maximizing the development plan of our<br />
expanded project portfolio.<br />
NORTH AMERICAN CRUDE OIL – DISCIPLINED USE OF<br />
TECHNOLOGY TO CREATE VALUE<br />
Success in our <strong>Canadian</strong> crude oil operations continued with<br />
production increasing 6% over 2005 levels and heavy crude oil<br />
pricing reaching record levels during the year. We remain the leading<br />
producer of heavy crude oil in Canada and with large amounts of<br />
original oil in place identified on our lands, we are in position to<br />
continue to grow this production.<br />
STEVE W. LAUT,<br />
PRESIDENT &<br />
CHIEF OPERATING OFFICER<br />
At Pelican Lake our waterflood and polymer flood enhanced oil<br />
recovery (“EOR”) schemes are adding significant reserves at low<br />
cost following a disciplined approach to optimizing results. We<br />
evaluated and tested alternative processes over the past three years<br />
and are now in the process of fully implementing our findings with<br />
the result that proved and probable net reserves at Pelican Lake<br />
increased by 97 million barrels of oil equivalent during 2006. We<br />
believe that our approach of piloting technologies in small areas<br />
of the pool afforded us the greatest flexibility to try different<br />
approaches without risking damage to the reservoir. We now<br />
believe that the waterflood / polymer flood EOR is the optimal<br />
solution for the majority of the reservoir. Further, we are actively<br />
looking for other pools in which we can leverage this knowledge.<br />
On our conventional heavy crude oil properties we have procured<br />
the services of two fully dedicated slant drilling rigs to complete our<br />
programs over the next 3.5 years. By committing to this service for<br />
an extended term we can better control efficiencies and ensure that<br />
well trained crews are available to us.<br />
At our thermal in-situ projects, Primrose North continues to<br />
outperform our expectations with production having increased by<br />
19% in 2006 over 2005. Future developments are also underway<br />
with the 40,000 barrel per day Primrose East targeted for first<br />
oil in 2009 and plans for the 30,000 barrel per day Kirby in-situ<br />
development with first oil forecast in the first half of the next<br />
decade. Resource delineation drilling continues on each of these<br />
properties along with Birch Mountain and Gregoire Lake.<br />
Here again, we continue to evaluate technologies to maximize<br />
resource potential. For example, use of geo-steering technologies<br />
for drilling of horizontal thermal wells allows us to better control<br />
and place the drill bit. This in turn expands an economically drillable<br />
resource. Examination of producing reservoirs has also expanded<br />
our knowledge of reservoir management. For example, we now<br />
believe that we can improve recovery factors on our Primrose<br />
property through narrowed well spacing and use of various follow<br />
up processes.<br />
In all, we have identified ten separate increments of in-situ<br />
developments which will seek to access our vast heavy oil resource<br />
potential over the next several years.
<strong>Canadian</strong> <strong>Natural</strong> AR2006<br />
Page 6 of 107<br />
To this end we continue to pursue our three pronged marketing<br />
strategy such that market price risk does not impair our ability<br />
to develop this portfolio. The first two elements of this strategy<br />
were previously discussed and have shown remarkable success.<br />
The third element of this strategy is the continued development of<br />
conversion capacity for heavy crude oil. To this end we reviewed the<br />
merits of building an additional upgrader outside of the Horizon<br />
Project to eliminate market risks on the majority of our planned<br />
in-situ developments. While such a plan would over time maximize<br />
the value of our heavy crude oil properties for shareholders, there<br />
is growing uncertainty relating to increased environmental costs for<br />
upgraders located in Canada and inflationary capital cost pressures.<br />
Based upon the results of the Scoping Study, which identified<br />
growing concerns relating to increased environmental costs for<br />
upgraders located in Canada, inflationary capital cost pressures and<br />
narrowing heavy oil differentials in North America, the Company<br />
has, at this point in time, deferred the DBM and EDS pending<br />
clarification on the cost of future environmental legislation and a<br />
more stable cost environment.<br />
INTERNATIONAL OPERATIONS – DISCIPLINED<br />
MANAGEMENT OF COSTS TO DRIVE CASH FLOW<br />
Our International operations represented a significant portion of<br />
2006 growth with increases in Offshore West Africa being partially<br />
offset by lower volumes in the North Sea. In 2007 the emphasis<br />
on our international assets is focused on cost control in order to<br />
maximize cash flows. However, selective growth initiatives are<br />
underway in both basins.<br />
Average light crude oil production in the North Sea decreased<br />
by about 8,500 barrels per day or 12% from the previous year,<br />
primarily the result of expanded maintenance activities. We continue<br />
to execute our strategy in the North Sea through exploitation<br />
beyond the optimization of existing facilities and waterfloods<br />
into more near pool developments and exploration such as the<br />
ongoing development at the Columba Terraces and the Lyell Field.<br />
This maximizes utilization of the common facilities and ultimately<br />
extends all fields’ economic lives.<br />
Our Offshore West Africa crude oil production volumes from Côte<br />
d’Ivoire increased by 60% to about 36,700 barrels per day. This<br />
improvement reflected better than planned production from the<br />
East Espoir development as well as a full year of production from the<br />
deep water Baobab Field and the commencement of production<br />
from the West Espoir satellite development late in the year.<br />
The year was not without its challenges, however, as sanding issues<br />
PROGRESS ON ON OUR OUR FOUR PERFORMANCE INDICATORS<br />
Cash flow from operations per share (C$/share)<br />
06<br />
05<br />
04<br />
03<br />
02<br />
9.18<br />
9.36<br />
7.03<br />
5.88<br />
4.41<br />
experienced at the Baobab field expanded - with the result that<br />
5 of 10 producer wells were shut in by the end of 2006, leaving<br />
approximately 15,500 barrels per day of production off-line. While<br />
mitigation plans have been identified they are reliant upon the<br />
procurement of a deep water rig. To date we have not been able to<br />
secure these services due to high industry demand.<br />
We expect continued growth in Offshore West Africa where the<br />
Olowi Field located offshore Gabon received local government<br />
approvals in 2006 and Board of Director sanction for development in<br />
November 2006. Development plans include a floating production,<br />
storage and offtake vessel (“FPSO”), handling production from four<br />
shallow water wellhead towers. First oil is currently targeted for late<br />
2008, with an anticipated plateau of 20,000 barrels per day.<br />
HORIZON OIL SANDS PROJECT – DISCIPLINED<br />
EXECUTION OF OUR PROJECT STRATEGY<br />
Phase 1 of this bitumen mining and integrated upgrader project<br />
made significant progress during the year, entering 2006 at 19%<br />
complete and exiting 57% complete. The Horizon Oil Sands Project<br />
(“Horizon Project”) benefited from a disciplined process in which<br />
significant front end engineering efforts afforded us the ability to<br />
obtain the majority of the Phase 1 construction costs under lump<br />
sum bids. This high degree of cost certainty was augmented by<br />
an expanded hedging program which ensured that adequate free<br />
cash flow to complete the four year construction effort would<br />
be available. While there was a cost associated with the hedging<br />
program, it was the combination of these two elements which<br />
enabled <strong>Canadian</strong> <strong>Natural</strong> to retain a 100% working interest in<br />
the Horizon Project without having to compromise on any of our<br />
conventional developments.<br />
Our emphasis on front end planning has provided <strong>Canadian</strong> <strong>Natural</strong><br />
with a strong understanding of both what we are building and,<br />
just as importantly, how we are going to build it. We have forged<br />
relationships with a variety of contractors from around the world<br />
and together have provided a strong definition of the construction<br />
execution plan. Further, this high project definition reduces the<br />
risks associated with late engineering or “scope” changes which<br />
have historically resulted in significant cost revisions for oil sands<br />
builders. Finally, we have developed a unique and creative labour<br />
strategy that has enabled workers of all labour affiliations from<br />
across Canada to participate in the construction effort as equals.<br />
This strategy is facilitated through our fly in/fly out capability from<br />
our on-site air strip. Today, workers from all across Canada regularly<br />
fly on one of 55 flights per week, direct to our site and home again,<br />
on various shifts which accommodate their lifestyles.<br />
Daily production, before royalties,<br />
per ten thousand shares (boe/d)<br />
06<br />
05<br />
04<br />
03<br />
02<br />
10.8<br />
10.3<br />
9.6<br />
8.5<br />
8.2
Letter to Shareholders<br />
Page 7 of 107<br />
With the Horizon Project 57% complete at the end of 2006 and<br />
targeted to achieve approximately 90% completion at the end<br />
of 2007, at this time we continue to expect final costs not materially<br />
different than our original $6.8 billion target cost with an onschedule<br />
commissioning in the third quarter of 2008. While there<br />
are still numerous challenges and inflationary pressures, our teams<br />
have performed very well, again highlighting a cultural focus on<br />
project execution.<br />
We are targeting to have revised cost estimates for Phases 2 and 3<br />
development in mid 2008. By that time we will better understand<br />
the impacts of cost and service inflation as well as the prospects<br />
for higher than planned commodity pricing. We are driven to<br />
ensure that full cycle economics of the prospect are not impaired<br />
and as such will consider various alternatives to the development,<br />
financing and timing of the project. Beyond this, future phases<br />
of development are realistic extensions of the plan, ultimately<br />
targeting for daily production of approximately 500,000 barrels per<br />
day of light synthetic crude oil from the leases. In total, we estimate<br />
resource potential of 6 billion barrels of mineable bitumen at the<br />
Horizon Project.<br />
FINANCIAL STRENGTH – A CORE ELEMENT OF OUR<br />
BUSINESS STRATEGY<br />
We continue to believe in strong fiscal management. In particular,<br />
we have a very strong hedge program underpinning our 2007 cash<br />
flows and this, combined with better than expected heavy crude<br />
oil differentials and continued operating and capital discipline,<br />
is expected to help facilitate our return to the mid-range of our<br />
targeted debt levels in 2008.<br />
DEFINED PLAN<br />
The <strong>Canadian</strong> <strong>Natural</strong> team is proud to be able to provide a<br />
transparent strategy and growth profile to its investors. We still<br />
target to grow, over an extended period, each of our four per-share<br />
metrics by an average of 10% per annum and believe that we have<br />
the assets to deliver on it.<br />
ALLAN P. MARKIN<br />
Chairman of the Board<br />
06<br />
05<br />
04<br />
03<br />
02<br />
N. MURRAY EDWARDS<br />
Vice-Chairman of the Board<br />
PROGRESS ON OUR FOUR PERFORMANCE INDICATORS (CONTINUED)<br />
Conventional proved and probable reserves<br />
per share, before royalties (boe)<br />
6.4<br />
4.8<br />
4.3<br />
4.0<br />
3.3<br />
In addition to the production growth aspect of the plan, the<br />
migration of the production mix from one dominated by natural gas<br />
and heavy crude oil to one dominated by light crude oil and natural<br />
gas means that the economic sustainability of the organization is<br />
enhanced throughout the business cycle. Reducing overall exposure<br />
to heavy crude oil differentials and avoiding reliance on third parties<br />
to develop the markets for our products was a key consideration<br />
in our plans.<br />
The Defined Plan, however, is not a static entity. We continually<br />
adjust and refine this Plan to ensure it optimizes returns. For example,<br />
our reaction to inflationary pressures has altered the timing of<br />
organic natural gas expansion, while the acquisition of ACC lands<br />
has increased short term production and greatly expanded the long<br />
term development potential of the organization.<br />
Similarly with respect to heavy crude oil developments and<br />
future phases of the Horizon Project we will continue to steward<br />
capital in the optimal fashion. While we have the assets and<br />
drive to significantly grow the business, this will not occur at all<br />
costs. Project timing will be accelerated or deferred to optimize<br />
development economics. While we are currently benefiting from<br />
high commodity prices we believe it to be imprudent to assume<br />
this continues for planning purposes and so we insist on more<br />
conservative price assumptions in our long-term planning models.<br />
Over that long-term we still target 10% growth but the current<br />
cost environment means that we must be even more diligent in<br />
optimizing that Plan.<br />
Management would like to again thank our entire team for<br />
continuing to deliver the Plan. We believe that <strong>Canadian</strong> <strong>Natural</strong><br />
has the people, assets and plan to continue to deliver shareholder<br />
value for years to come. As a team, we remain committed to<br />
“developing people to work together to create shareholder value<br />
by doing it right with fun and integrity”.<br />
JOHN G. LANGILLE<br />
Vice-Chairman of the Board<br />
Conventional net asset value per share<br />
SEE NOTE 5 ON<br />
(C$/share, adjusted for 2004 and 2005 share splits) PAGE 102 FOR CALCULATION<br />
06<br />
05<br />
04<br />
03<br />
02<br />
STEVE W. LAUT<br />
President &<br />
Chief Operating Officer<br />
56.41<br />
60.44<br />
33.13<br />
23.35<br />
19.57
<strong>Canadian</strong> <strong>Natural</strong> AR2006<br />
Page 8 of 107<br />
Our World-Class Team<br />
Lonnie Abadier, Walday Abeda, Hazel Aberdein-Quirie, Mona Abravesh, Libby Ackerley, Trevor Ackerman, Janine Adams, Mike<br />
Adams, Debra Addinall, Kike Aderibigbe, James Agate, Jennifer Ahern, Sarshar Ahmad, Sarah Aho, Garrisen Ailsby, Fiona Aitken,<br />
Adebayo Akinpelu, Sina Akinsanya, Joseph Albano, Chris P. Alderson, Bruce Alexander, Gregory Alexander, Elena Algazina, Mohi<br />
Alghazali, John Allan, Selena Allan, Jill Allen, John Allen, Simon Allerton, Devin Allibone, Karen Almadi, Michael Almasi, Gordon<br />
Almond, Robert Almond, Jocelyn Alonso, Nelson Alook, Cindy Alpaugh, Laurel Alston, Susan Alwood, Ulises Amador, Gregory<br />
Amalia, Joann Aman, Traore Amara, Clark Ambler, Jonah Amedu, Jonah Amedu, Donald Ames, Roxanne Amrolia, Sylvia Anaka,<br />
Eric Andersen, Jan Andersen, Troy Andersen, Allan Anderson, Barry Anderson, Bruce Anderson, Findlay Anderson, Georgina<br />
Anderson, Jeremy Anderson, Kelvin Anderson, Leonard Anderson, Linsey Anderson, Murray Anderson, Perri Anderson, Richard<br />
Anderson, Steve Anderson, Tony Anderson, Peter Andrekson, Janet Andrew, Bob Andrews, Todd Andrews, Erica Andrusiak, Sherley<br />
Angers, Carolyn Angus, Shehzad Anjum, Kathryn Anthony, Helen Antle, Kathy Antonishyn, Shelley Antonuk, John Argan, Humberto<br />
Arias, Roxcie Arkinstall, James Arkley, Anthony Armstrong, Darryl Armstrong, Randall Armstrong, Rob Armstrong, Neil Arsenault,<br />
Paul Arsenault, Bala Arunachalam, Anthony Ash, Jim Asmus,<br />
Jacqueline Asso, Sialla Assohou, Francklin Assoko-Mve, Andrew<br />
Astalos, Maguy Atheba, John Atkinson, Kyle Atkinson, Nicole<br />
Atkinson, Gordon Au, Maurice Aubin, Jason Auch, Bernard Auger,<br />
Richard Augustyn, Maria Avila, Kevin Babuik, Michael Baddeley,<br />
MaryAnn Baes, Brian Bahlieda, Dave Baier, Janice Baik, Michael<br />
Baik, Dwayne Bailer, Rod Bailer, Judy Bailey, Robert Bain, Leon<br />
Bakaas, Chris Baker, Shane Baker, Sharon Baker, Reginald<br />
Baldock, Christopher Baldwin, Mark Baldwin, Robert Baldwin,<br />
Vaughn Baldwin, Joel Balkam, Gary Ballas, Ronnie Ballas, Sheldon<br />
Ballas, Brenda Balog, Corrie Balogh, Ladji Bamba, Mamadou<br />
Bamba, Neville Banak, Darwin Banash, Junet Banawa, Rechelle<br />
Baniqued, Bob Banks, Teresa Banny, Chris Bantli, Inge Bantli,<br />
Lawrence Baraniuk, Garry Bardoel, Larry Bardoel, Pamala Bare,<br />
Sharon Barker, Steve Barker, Michael Barnes, Michael Barnes,<br />
Beata Barnett, Javier Baroja, Deborah Barr, Kenneth Barrett, Phrona Lisa Barrett, Barry Barrs, Darcy Barry, Carol Barss, Carrie<br />
Barter, Marty Bartman, Julius Bascon, Calvin Bast, Michael Batac, Cheryl Bateman, Lisa Bateman, Daphne Bates, Selena Bath,<br />
Mark Batovanja, Brenda Battyanie, Jeremy Battyanie, Jackie Bauer, Lydell Bauer, Ronnie Bauer, Kevin Bauman, Breanne Bawol,<br />
Veronica Bayley, Raymond Bazan, Denise Beairsto, Colin Beaman, Harold Beamish, Chad Beaton, Aura Beattie, Laurier<br />
Beaunoyer, David Bechtel, Brent Beck, Chris Becker, Elke Becker, Holly Becker, William Bedford, Gurpreet Bedi, Kevin Beebe,<br />
Ewan Beenham, Loren Behrens, Nawar Belah, Jeremy Belair, Guy Belanger, Kelly Belanger, Lesley Belcourt, Betty Belenky, Calvin<br />
Bell, David Bell, David Bell, Faye Bell, Jon Bell, Larry Bell, Reg Bellanger, Lorne Bellows, Remie Belmonte, Leah Belsher, Ahmed<br />
Bendahmane, Khalida Bendahmane, Brad Bendick, David Bendrey, Robert Benko, Lene Benner, Erick Bennett, Jennifer Bennett,<br />
Brad Benoit, Brad Bensmiller, Shelly Bensmiller, Chad Benson, James Bentley, Robert Bercha, Ken Berenguer, Linda Beresh,<br />
Debbie Berg, Jaimie Berg, William Berg, Jeffrey Bergeson, Becky Bergley, David Berlinguette, Henry Berlinguette, Daniel<br />
Bernardo, Joanne Berrade, Murray Bertsch, Jonathon Best, Rodney Best, Jack Besuijen, Stewart Bettinson, Ashley Bexson, Marc<br />
Bickham, Jennifer Bidlake Schroeder, Corey Bieber, Beata Biel, Douglas Bielech, Rachelle Bien-Barnard, Inge A. Biener, Monica<br />
Billings, Roger Bintz, Warren Birch, Tim Bird, Jane Birkett-Hodson, Shane Bischoff, Gillian Bishop, Hope Bishop, Jeff Bishop,<br />
Kathy Bishop, Travis Bishop, Paula Bissell, Ron Bisset, Darwin Bittner, Kevin Bjornstad, Adam Black, Chad Black, Craig Black,<br />
David Black, Kenneth Blackhall, Kerri Blackmore, Olivera Blagojevic, Michael Blair, Deana Blais, David Blake, Evan Blake,<br />
Alvaro Blanco, Chris Blatchly, Shawn Blaydes, Parrish Blizard, Judith Blomdal, Allissa Blondin, Ellen Bloomfield, Gregory<br />
Blundon, Robin Bly, Kathryn Bobye, Allan Boddy, Brad Bodnar, Dennis Boehmer, Michael Boer, Kent Boerrichter, Kyle Boerrichter,<br />
Darcy Boettger, Warren Bogelund, Marty Boggust, Gordon Bohrson, Claude Boily, Peter Boisvert, Michael Bolianatz, Greg Bolin,<br />
Marguerite Bonnet, Patricia Booklall, Jayne Booth, Charlene Boraas, Barry Borbely, Adriana Borbon, Albert Bordeleau, Michael<br />
Born, Jon Borstel, Blair Bosch, Dave Bosch, Dave Bosek, Greg Boshaw, Enrica Bosoni, Keith Bottriell, Suzanne Boudignon, Rick<br />
Bourassa, Sheldon Bourassa, Delwood Bourke, Daryl Bourque, Daniel Boutin, Mark Bowden, Jim Bowers, Slade Bowers, Clinton<br />
Bowles, Gordon Bowzaylo, Dale Boychuk, Doug Boyd, Patrick Boyd, Charline Boyer, Lorraine Boyle, Neil Bozak, John Brabec, Dave<br />
Bracey, Bryan Bradley, Hugh Bradley, Jason Bradley, Peggy Bradner, Jan Bradshaw, Marianne Brady, Mary Jane Brady, Linda<br />
Bragg, Jo-Ann Brake, Jessica Braley, Myron Brataschuk, Brad Braun, Colin Brausen, Tara Brechin, Sharon Breitkreuz, Joseph<br />
Breland, Paul Breland, Shawn Brennan, Barry Brenton, Roxane Bretzlaff, Olaf Breukel, Butch Briggs, Denis Brisebois, Robert<br />
Brisson, Donald Britton, Frances Broadfoot, Shawn Brockhoff, Kelly Broda, Brian Brodbin, Dwayne Brodziak, John Brogly, Bill<br />
Bromling, Murray Brooker, Andrew Brooks, Dennis Brooks, Tanya Brooks, Jeremy Brown, Julie Brown, Ronald Brown, Steve Brown,<br />
Tracy Brown, Tyler Brown, Leo Browne, Cathy Brownell, Robert Brownless, Christopher Bruce, Shelly Bruce, Fred Brugger, John<br />
Brule, Jason Bryant, Peter Bryenton, Sean Bryson, David Buchan, Stewart Buchan, Joseph Buchanan, Danny Buchinski, Natasha<br />
Buckland, Gordon Buckshaw, Linda Buczkowski, Bill Budd, Raymon Bueckert, Ian Bulloch, Don Bumstead, Douglas Bumstead,<br />
Alan Bunyan, Clarence Bur, Rick Burchby, Trevor Burchenski, Ian Burchette, Jeffrey Burdett, David Burdziuk, Brent Bureau, Keith<br />
Bureau, Grant Burgess, Alastair Burke, Crystal Burke, Lyle Burke, Gayle Burnett, Ken Burnham, J. Rick Burns, Sharon L. Burns,<br />
Barry Burt, Gerald Burtch, Corinne Burton, Lisa Bush, Rosemary Bussi, Terry Butchart, Bob Butterworth, Ronald Butts, Leanne<br />
Butz, Tricia Butz, Arnie Bye, Mike Byrtus, Irina Byvald, Joe Cabay, Moraima Caceres, Glennie Cadieux, Mark Cadman, James<br />
Cadrain, Simon Cains, Laura Calder, Leslie Calder, Byron Caldwell, Patrick Caldwell, Tom Callaghan, Darren Calliou, Richard E.<br />
Calliou, Dean Cameron, Mike Cameron, Brian Campbell, Catherine Campbell, Clayton Campbell, Dean Campbell, Doug<br />
Campbell, Earl Campbell, Nancy Campbell, Robert J. Campbell, Shawn Campbell, Valerie Campbell, Andre Campeau, Wayne<br />
Campeau, Gregory Cane, Brad Canning, James M. Capjack, Barry Carabin, Kathleen Carbury, Fred Cardinal, Lee Cardinal, Myles<br />
Cardinal, Sharon Cardinal, Wayne Cardinal, Suzie Careless, Jim Carey, Joey Carifelle, Ian Carleton, Stephanie Carlson, Wes<br />
Carlson, Albert Caron, Rochelle Caron, Michael Carr, Diego Carrera, Kim Carrol, Ian Carroll, Shayne Carroll, Robert Carson,<br />
Eduardo Cartaya, Marilyn Carter, Gary Case, Mary-Jo Case, Trevor Cassidy, Lance Casson, Mike Catley, Steve Caven, Richard<br />
Cawaling, Chris Cawley, Ciara Celis, Marco Celis, Samuel Cervantes, Andrew Chaisson, Sachi Chakravarty, Erin Chamberlain,<br />
Lise Champagne, Alan Chan, Anly Chan, Jack Chan, Jik Chan, Sarah Chan, Tim Chan, Wayne Chandler, Koh Chang, Calvin<br />
Chapman, Melody Chapman, Todd Chapman, Deon Chappell, Harry Chappell, Darryl Charabin, Cynthia Chartrand, Roger<br />
Chartrand, Susan Y. Chase, Leon Chateauneuf, Arundhati Chatterjee, Sumit Chatterjee, Teecy Chau, Siddique Chaudhry, Dawn<br />
Chau-Lam, Gary Chaulk, Jackson Chaves, Rinet Maria Chaves-Thissen, Carl Cheeseman, Brian Chen, Mike Chernichen, Bill<br />
Chernish, James Cheung, Ricardo Chiang, Gloria Chick, Patricia Childs, Al Chin, Melaine Chin, Sharon Chin, Jamie Chisholm,<br />
William Chiverton, Randall Chodzicki, Jessica Choi, Raymond Chong, Brett Chorney, Wayne Chorney, Lynn Chotowetz, Sherry<br />
Chow, Shayela Chowdhury, Alphonse Chretien, Mark Christensen, Ruth Christensen, Heidi Christensen Brown, Marianne<br />
Christianson, David Christie, Shawn Christie, Steven Christie, Rob Christopher, Andy Chu, Ken Chudleigh, John Chuiko, Sharon<br />
Chung, Heather Church, Ronni Church, Kadidiatou Cisse, Magda-Christina Ciulavu, Michael Clapham, Bryan Clapperton,<br />
William Clapperton, Amanda Clark, Andrea M. Clark, Brent Clark, Evan Clark, Janice Clark, John Clark, Ken Clarke, Martha<br />
Clarke, Olivia Clarke, Sanja Clarke, Shandon Clarke, William J. Clarke, Walter Clarkson, Greg Clegg, Cory Clement, Leah Clewes,<br />
Brooke Coburn, Dale Coburn, Judith Cochran, John Coers, Charles Coffey, Rob Coles, Marc Collie, Grant Collier, Curtis S. Collins,<br />
Richard Collins, Robert Collins, Rod Collins, Roy Collison, Adam Collyer, John Coloso, George Coman, Ron Compton, Rebecca<br />
Conacher, Mark Connellan, David Conybeare, Brad Cook, Chris Cook, Anna Cooke, Lori Cookson, Rob Coolen, Gary Coombe, Kent<br />
Cooper, Jason Copeland, David Coppard, Robert Coppard, Jean Corbiere, Mark Corell, Elaine Coreman, Rosetta Cormier, Rosario<br />
Corral, Luis Correal, Jim Corson, Lorenzo Cortes, Neil Cortmann, Harry Costello, Neil Costeloe, Brent Cote, Sanga Coulibaly,<br />
Dougie Coull, Kim Coulter, Jack Courchene, Robert Courchesne, Kathryn Courtney, Dave A. Cousins, James Coutts, Gordon<br />
Coveney, Terry Cowan, Richard Coward, Keith Cowger, Cath Cowie, Jonathan Cox, Randy Cox, Wade R. Cox, Nigel Crabb, Harry<br />
Crabtree, Layne Craig, Bruce Crain, Allen Crawford, Marina Crawford, Michael Crawford, Paul Crawford, Beverley Creed, Donald<br />
Cretney, Roger Crichton, Terri Crockett, Shane Croft, Stefan Croft-Bednarski, Christopher Cross, Lloyd Cross, Teresa Cross,<br />
Camille Croteau, Phil Cruickshank, Linda Cruttenden, Anthony Csabay, Will Csanyi, Jeff Cullen, Corinna Culler, Darrel<br />
Cunningham, Davis Cunningham, Tara Cunningham-Canfield, Arley Currie, David Currie, Brent Curtis, Paul Curtis, Troy Curzon,<br />
Dale S. Cusack, Kenneth Cusack, Pat Cusack, Réal Cusson, Midge Cuthill, Don Cutting, Chris Cyr, Les Czernicki, Kevin d’Abadie,<br />
Victor Daboin, Greg Dacyk, Fakhry Dadashev, Gary Dahl, Hamid Dahmani, Eliane Dakaud, Brittany Dalby, Patrick Dale, Joey<br />
Daley, Layne Dalgetty-Rouse, Gary Daly, Loren Damer, Walter M. Danchak, Beth Daniel, Mike Danis, Gene Danyluk, Peter<br />
Danyluk, Alan Dar, Eric Dargis, Mark Darling, Lynne Darlington, Merl Darragh, Wigo Dascalescu, Bruce Davidson, Graham<br />
Davidson, Louise Davidson, Scott Davidson, Todd Davidson, Brian Davies, Lynne Davies, Frank Davis, Graham Davis, Greg<br />
Davis, Kenneth Davis, Randall Davis, Robert Davis, Sarah Davis, Jeffrey Davison, Peter Davison, Leonard Dawe, David Day,<br />
Robert Day, David Dean, Harry Dean, Martha Dean, Douglas DeAvila, Trevor Debler, Ryan DeBruyne, Derek Dechaine, James<br />
Dechaine, Raymond Dechaine, Roland Dechesne, Sheldon DeFord, Phil DeGagne, Mervin J. Degenstien, Barbara Deglow, Bonnie<br />
Deis, Eric deKock, Ryan DeLeeuw, Natalie Delfs, Franco Dell’Ovo, Benita DeLorenzo, Benito DeLorenzo, Brent Delorme, Michael<br />
Delorme, Minette DelosReyes, Liana Delpinto, Tom DeMaid, Charlene DeMone, Antonia Deniega, Susan Dennis, Lee Denny,<br />
Shirley Denny, Colin Derby, Edward Deren, Tom Dereniwski, Shane Derlukewich, Robbert deRuiter, Semir Dervovic, Eugenie Dery,<br />
Ajit Desai, Laurie A. Devey, Fraser Dewar, Todd Dewhurst, Debbie Dewis, Robert Dewis, Karen Deyaegher, Maldip Dhaliwal, Vikas<br />
Dhawan, Keith Diakiw, Karim Diallo, Harry Diamantopoulos, Sumara Diaz, Bob Dicken, Garry Dickie, Blair Dickson, Cameron<br />
Dickson, Stu Didyk, Sue Didyk, Aldo DiFlumeri, Irene Dikau, Anne Dillon, Mike Dingley, Greg Dingwell, Ronald Dinkel, Hubert<br />
Dinn, Issiaka Diomande, Gayle Dionne, Mamadou Diouf, Tim Ditchburn, Al Dixon, Kathleen Dixon, Robin Dixon, Trent Dixon,<br />
Angela Dobb, Derrick Dobrowski, Leanne Dobson, Linnae Dobson, Edward Dochuk, John Dodman, Erin Doepker, Kelly Doepker,<br />
Kim Doepker, Ritchie Doering, Jordy Doerksen, Patrick Dolan, Amy Dolomount, Conrad Dombowsky, Kelly Dombrosky, Brenda<br />
Dombrova, Dan Domke, Kyle Donald, Scott Donaldson, Claire Dong, Tim Donkersloot, Veronica Dooling, Tim Dootka, Allen M.<br />
Dorey, Olga Dost, Réal Doucet, Eddie Douglas, Dahl Dow, Angela Dowd, Jeff Dowd, Phil Downes, Todd Draper, Wayne Draper,<br />
Kenton Dreger, Brian Drew, Lorna Drilon, Don Drindak, Colleen Drury, John Drury, Calvin Duane, Rafael Duarte, Sean Dubelt,<br />
Jeramie Ducharme, Rick Ducharme, Ryan Duckworth, Albert Duczek, Jon Dudley, Rhonda Dudley, Alan Duffy, Morley Dufour,<br />
Simon Dugdale, Douglas Duguid, Albert Duhaime, Doug Duke, Barry Duncan, Lois Duncan, Sean Duncan, Ashley Duniece, Dale<br />
Duniece, Graham Dunlop, Jill Dunlop, Robert Dunn, Keith Dunnett, Judy Dunsmuir, Lyle Dupuis, Dariela Duran, Harvey Dutchak,<br />
Faron Duthie, Terry Dyer, Eugene A. Dyjur, Krzysztof Dzwonek, Julina Eagleson, Gary Earl, Kevin Earle, Julie Easthope, Suzanne<br />
Eaton, Sean Ebert, Jim Eby, Greg Ecker, James Edens, Robert Edgar, Josephine Edoukou, Gordon Edward, Dave Edwards, Sue<br />
Edwards, Fred Eefting, Cindy Egden, Christopher Ehresman, Brian Eitzen, Nicole Eitzen, Devin Ekdahl, Wassim ElChayati,<br />
Douglas Elder, David Eley, Craig Elies, Carole Eliuk, Anthony M. Ell, Robert Elliott, Karen Ellis, Mohamed El-Naas, Tina Emery,<br />
Jerry Enders, Rommel Engler, Joanne English, Kenny Ergang, Terry Erickson, Kresten Eriksen, Polina Ersh, Rick Estrada, Andrew<br />
Etele, Samantha Etherington, Kim Evanoff, Lee Evans, Randy Evans, Tim Evans, Leila Eveleigh, Maureen Evers-Dakers, Clayton<br />
We strive to achieve a balance of technical skills, leadership, and a strong organizational<br />
culture. These are the people that make our team. As a team, we remain committed to<br />
“developing people to work together to create shareholder value by doing it right with<br />
fun and integrity”. The growth of our business has resulted in our team growing by 620<br />
employees during the year, ending 2006 with 3,700 employees.<br />
Eves, Doug Eves, Frederick Ewen, Laura Ewen, Douglas Eynon, Kris Eyolfson, Leonard Fabes, Lawrence Facchina, Denis Fagnan,<br />
Heather Fahey, Andy Fankhauser, Chelsea Farrell-Dreger, Randy Farrer, Travis Farrer, Krista Farris, Stefa Fassina, Jayme Faszer,<br />
Arthur Faucher, Everette Fauth, Jamal Fayad, Karman Fayant, Renee Fayant, Tanya Fayant, Tyson Feairs, Brian Fehr, Darwin Feil,<br />
Ira C. Feland, Warren Feland, Andre Yves Felix Tchicaya, Kurt Fenrich, Ken Ference, Brad Ferguson, Helen Ferguson, Mark<br />
Ferguson, Neil Ferguson, Roy Ferguson, Scott Ferguson, Mario Feria-Estrada, Cory Fernets, Ron Fewer, Darren Fichter, Tiziana<br />
Ficocelli, Alan Fiddes, Jane Fielding, Sherman Fifield, Chris Filgate, Michael Filipchuk, Neil A. Findlay, Kelly Finigan, Bob<br />
Finlayson, James Finlayson, Chad Finnebraaten, Timothy Finnigan, Kristin Finot, Tanya Fir, John Fisera, Calvin Fisher, Darya<br />
Fitsko, David Fittkau, Bill Fitzgerald, John Fitzgerald, Sandra Fitzpatrick, Daniel Fitzsimmons, Colleen Flamont, Ken Fleck, Sean<br />
Fleming, Rodney Flett, Trevor Flood, Mark Flynn, Edmond Foisy, Justin Foisy, Ryan Folkerts, Gregory Fontaine, Leo Fontaine,<br />
Robert Fontaine, Roger Fontaine, Lynn Foo, Harris Foote, Adele Forcade, David Foret, Curtis Formanek, Randy Formanek, Devon<br />
N. Fornwald, Leslie Forrester, Alastair Forsyth, Chantal Fortin, Donald Foster, Dwayne Fotty, Kevin Foulds, Scott Fouracres, Jim<br />
Fowler, Donald Fox, Donna Frame, Roger France, Vicky France, Ron Frank, Richard Franken, Allan Frankiw, Blaine Franklyn,<br />
Shelley Franssen, Leonard Fraser, William Fraser, Barry Frazer, Ken Frazer, Ted Frederickson, Michael Freeman, Stacey Freidin,<br />
Peter French, Roger Frere, Jared Frese, Kurt A. Freyman, Brad Friesen, David Friesen, Kenneth Friesen, Monte Friesen, Kevin Frith,<br />
Tracy Frith, David Fritz, Andrei Frizorguer, Frank Frosini, Colin Frost, Scott Froude, Karen Fujimoto, Doug Fukushima, Jim Fung,<br />
Sarina Fung, Leonard Furlong, Ted Furuya, Josephine Gaddi, Mamta Gadhiya, Leonard Gadowski, Sharon Gaehring, Kelly Gagne,<br />
Scott Gair, Larry Galea, Jaylyne Galey, Ron Gall, Bob Gallant, Michael Gallon, AWilliam Galloway, Yoko Galvin, Andreas Gamp,<br />
Bob Gandhi, Vovel Gapaz, Isabel P. Garbin, Carlos Garcia, Daina Gardiner, Doug Gardner, Lynette Gardner, Jon Gareau, Tim<br />
Gareau, Glen Garton, Stan Garwon, Carlos Garzon, Mark Gaspich, Vanessa Gaudreau, Joseph Gaugler, Maurice Gauthier, Neil<br />
Gauthier, Klaus Gautschi, Steve Gavronsky, Melanie Gaw, David Geleta, Lesley Ann Gemmell, Neil Genge, Patricia Gentles, Devin<br />
George, William George, James Georget, Kimberley Gereluk, Jim Gergely, Matthew Gering, Grant Gerla, Michel Germain, Raymond<br />
Germain, Robert Germain, Colin Germaniuk, Albert Gervais, Karlene Gervais, Marc Gervais, Paul Gervais, Bob Gerwing, Sheldon<br />
Getson, Beryl Gettings, Clark Getz, Glen Getz, Stanley Getz, Ken Getzinger, Zoheir Ghaddar, Chad Gibson, Douglas Gibson,<br />
Charles Giddings, Shaun Giefer, Jean Giesbrecht, Todd Giesbrecht, Dwayne Giggs, Garth Gilbert, Elias Gildeh, Tamara Giles,<br />
Gladwin Gill, Ian Gill, Ralph Gill, Perry Gillam, John Gillatt, John Gillespie, Ron Gillespie, Sharen Gillett, Erin Gillis, Sandra Gillis,<br />
Vicki Gillis, Martin B. Gillund, Justin Gilmour, Scott Gilmour, Douglas Ginn, Stewart Girbav, Ben Gisby, Eugenio Giuliani, Marvin<br />
Gladue, Russell Gleed, John Glennon, Jason Glubish, Duane Goetz, Peter Goetz, David Golden, Cody Gomuwka, Elaine Gong,<br />
Brian Gonsalves, Jose Gonzalez, Yvonne Gonzalez, Ian Gordon, James Gordon, Winston Goretsky, Jennifer Gorman, Rhonda<br />
Gosse, Yvon Gosselin, Allan Gould, Todd Gould, Antonella Goulet, Sandra Goundrey, Trevor Gowman, John Graca, Tara Grace,<br />
Marah Graham, Trevor Graham, Austin Grant, Harry Grant, Ronald Gray, Sheila Gray, John Greaves, Linda Green, Shilo Green,<br />
Wayne Green, Marc Greenan, Cory Greenawalt, Shannon Greene, Theresa Greene, Richard Grieve, Edmond Griffiths, Sherisse<br />
Grillone, Robert Groenen, Leo Groenewoud, Robert Grover, Daryl Grundner, Neil Guay, Trevor Guay, Don Guglielmin, Gilbert<br />
Guigon, Aliya Gulamhusein, Karim Gulamhusein, Robert Gullion, Shane Gullion, Swarna Gunaratne, Carolyn Gunderson, Alan<br />
Gunst, Ashok Gupta, Rustam Guseynov, Edward Gushnowski, Terry Gusnowski, Graham Gustafson, Harold Gutek, Fabio<br />
Gutierrez, Bartley Haahr, Alain Habel, Rodney Haberlack, Hamid Habibi, Violet Haddad, Leisa Haddleton, Resad Hadzismajlovic,<br />
Keri Hagemann, Chad Hagstrom, Keith Hague, Wondafrash Hailu, Sam Hajar, Shemin Haji, Zohreh Hajibeygi, Dan Halaburda,<br />
Jeremy Hale, Montie Hale, Dean Halewich, Rick Halkow, Barry Hall, Charles Hall, Donald Hall, Kathy Hall, Michael Hall, Shane J.<br />
Hall, Todd Halladay, Patricia Halldorson, James Hallett, Robert D. Hallett, Charlene Halter, Larry Hamende, Darcy Hamilton,<br />
Jeremy Hamilton, Tim Hamilton, Kevin Hamm, Michael Hammel, Larry Hammell, Rick Hammond, Chrystal Hamori, Bryan<br />
Hamula, Mei Han, Zonghai Han, Brad Hancock, Anne Hand, Carol Handley, Warren Handley, Tracy Hanline, Karl Hann, James<br />
Hansen, Todd Hansen, Cheryl Hanson, Judy Hanson, Leland Hanson, Brent Harbin, Leon Harder, Carson Harding, Kent Hardisty,<br />
Ken Harke, Julia Harker, Brent Harle, Les Harley, Angela Harlos, Erik Haroldson, Ray Harper, Chad Harris, Coby Harris, Jody L.<br />
Harris, Murray Harris, Roger Harris, Ron Harris, Stephen Harris, Clayton Harrison, Dylan Harrison, Patrick Harrison, Randy<br />
Harsany, Brent Hartley, Bud Hartley, James Harty, Lorne Harty, Mike Harty, Amie Harvey, Greg Harvey, Janet Harvey, Jerry Harvey,<br />
Julie Harvey, Michael Harvey, Cory Harvie, Cheryl Hasenclever, Colin Hastings, Iain Haston, Ewen Hatchwell, Bryan Hattebuhr,<br />
Christine Hattebuhr, Dale Hattebuhr, Barret Hatton, Wayne Hatton, Dave Haub, Willow Hauber, Ross Hauger, Wayne Hausch,<br />
Betty Hayden, Cameron Hayden, Nancy Hayes, RJoey Hayward, David Haywood, Sean Head, Jay Heagy, Brad Hearn, Larry Heath,<br />
April Hecht, Terry Heck, Ken Hedstrom, Christopher Heffner, Della Hefford, Robin Hein, Mahmud Hejni, Tim Helle, Carey Hellman,<br />
Barton Henderson, Steven Hennessey, John Hennessy, Anita Hennig, Leona Hennig, David Henry, Reid Henry, Jackueline Herauf,<br />
Kim K. Herbst, Brad Herman, James Herman, Justin Herman, Judith Hermann, German Hernandez, Luis Herrera, Edwin<br />
Herrenschmidt, Coreen Herring, Michele Herron, Keith Heslop, Brian Hess, Cara Hess, Dorain Hessel, Tyson Hessler, Brenda<br />
Hetman, Tia Hickie, Kim Hicks, Rodney Higa, Andrew Higgins, Rachelle Higgins, Charlene Hill, Gordon Hill, Steve Hill, Ernie<br />
Hilland, Jesse Hillebrand, Jeff Hillier, Christie Hillis, Arnold Himschoot, Ken Hingley, Katarzyna Hinks, Jim Hlewka, Margaret Ho,<br />
Lee Hoang, Donald Hoar, Karyn Hobbs, Lee Hodder, Barry Hodgan, Gary Hodge, Barbara Hofer, Miles Hogaboam, Joanne Hogg,<br />
Kevin Hogg, Krista Hogg, Alan Hoiland, Kevin Hoium, David Hollett, Donald Holley, Doug Holman, Richard Holman, Donald<br />
Holmen, Cliff Holmerson, Chris Holmes, Ian Holmes, David Holt, Brett Holthe, Clayton Holthe, Dennis O. Holthe, Shannon Hood,<br />
Hans Hoogendam, Graham Hook, Keith Hornseth, Kimberley Horvath, Richard Horvath, Jon Horyn, Renita Hoskins, Lance Hoskyn,<br />
Tony Hou, Jeff Houck, Helena Houghton, Sherri Houle, John Howard, Trapper Howard, Kristy Howe, Shelagh Howell, Angela Hoza,<br />
Curtis Hrdlicka, Jianxin Huang, Ti Huang, Kyle Huculak, Helen Hudson, Paul Hudson, Sandy Huebner, David Huff, Jeremy Hughes,<br />
Mark Hughes, Eun Ju Huh, Bryan Huk, Riley Hull, Wendy Hum, Terry Humbke, Darren Humphries, Manpreet Hundal, Ian Hundeby,<br />
Jennifer Hunt, Kevin Hunter, Robert A. Hunter, Tom Hunter, Vivian Hunter, James Hurdal, Bradley Hurtubise, Chad Huseby, Taira<br />
Hutchings, Daniel Hutchinson, Dennis Hutchinson, Ray Hutscal, Bruce J. Hutt, Ewart Hutton, Greg Huva, Stephen Hygard,<br />
Nathan Hylton, Bonnie Hynes, David Hynes, Scott Hyrcha, Sarah Hyslop, Gerard Iannattone, Pina Iannattone, Sherry-Lynn Ibey,<br />
Matthew Ilchuk, Detlev Imorde, Dominic Ing, Alexander Inglis, Jennifer Inglis, Max Inglis, Brad Inman, Rebecca Innes, Matt<br />
Inscho, Scotty Iron, Jamie Irons, Jeff Irons, Dora Irsa, Ted Irwin, Darren Isele, Floyd Isley, Peter Iuni, Karen Ivan, Arlette Ivany, Jeff<br />
Iwanaka, Wallace Jack, Daniel Jackson, Judy Jackson, Niki Jackson, Ronald Jackson, Russel Jackson, Victoria Jackson, Ken<br />
Jacobson, Albert Jacula, Curtis Jacula, Marci Jacula, Todd Jacula, Hamid Jafari, Charu Jain, Vivek Jain, Michael Jaindl, Boris<br />
Jakulj, Annie Jalotjot, Stephen Jamam, Chris James, Jeff James, Bob Jamieson, Nigel Jamieson, Maria Jancewicz, Marc Janke,<br />
Dale Jans, Steve Jansky, Peter Janson, Kelly Janus, Leonard Janzen, Crystal Jardine, Nancy Jarman, Calvin Jarratt, Dave Jarrell,<br />
Jim Jarvis, Joanie Jarvis, Mark Jean, Wendal M. Jellison, Leslie Jenkins, Jason Jenner, Lindsay Jenner, Michael Jennings, Brent<br />
Jensen, Justin Jensen, Kevin Jensen, Parry Jensen, Mark Jespersen, Iain Jessiman, Qi Jiang, Ramon Jimeno, Terry Jocksch, Juan<br />
Joffre, Brent Johns, David Johnson, Evan Johnson, Jeffrey Johnson, Marlene Johnson, Mitzi Johnson, Neville Johnson, Stacy<br />
Johnson, Theresa Johnson, Holly Johnston, Joe Johnston, Michelle Johnston, Neil Johnston, Chris Johnstone, Janet Johnstone, Dan<br />
Johnston-Watson, Victoria Jolliffe, Brent Jones, Delbert Jones, Ed Jones, Gareth Jones, Harley Jones, Lori Jones, Mark Jones,<br />
Pamela Jones, Tammy Jones, Wayne Jones, Martyne Jongerius, Paul Joo, Damian Jordan, Jaime Juan, Albert Junco, James Jung,<br />
Sandy Jung, Chris Jungen, Miriam Juniper, James Jurome, Melanie Juurlink, Paul Kabatek, Asif Kachra, Mary Kadri, Carol<br />
Kadutski, Jonathan Kadutski, Raymond Kahanyshyn, Krista Kaiser, Myra Kalakailo, Dustin Kalinsky, Sheron Kalirai, Derek<br />
Kalynchuk, Elizabeth Kaminski, Ari Kandasamy, Larry Kane, Shari Kane, Dwayne Kaprowski, Tom Karpa, Doug Kary, Lynn Kasper,<br />
Shelina Kassam, Amy Kastelic, Beverley Katay, Myles Kathan, Deanne Katnick, Hassan Katrip, Travis Kavalec, Olga Kay,<br />
Christopher Kean, Gregory H. Keats, Philip Keele, Christopher Keim, John Keith, Joe Kelenc, Marina Keller, Rayelene Kellock,<br />
Alphonsus Kelly, Christine Kelly, David Kelly, Eileen Kelly, Jeff Kelly, Ken Kelly, Tim Kelly, Simon Kelsey, Greg Kemp, Stephen<br />
Kempton, Denise Kennedy, Wayne Kennedy, Val Kenyon, Rob Kerr, Ryan Kerr, Blair Kessler, Lori Ketchuk, Greg Ketter, Minh Kha,
Our World-Class Team<br />
Page 9 of 107<br />
Ajmal Khan, Amjad Khan, Shehnaz Khan, Shaalini Khanna, Tatiana Kharitonova, Kimberly Kielt, Leonard Kiez, Todd Kilback, Iain<br />
Kilpatrick, Heather Kim, Curtis Kimler, Douglas King, Richard King, Tasha Kingsbury, Peter Kinnear, Cam Kinniburgh, Marvin<br />
Kinsman, Sebastian Kirstine, Tony Kirtley, Cryssy Kish, Marlene Kissel, Robyn Kissel, Shane Kissel, Marlene Kissoon, Bob Kitsch,<br />
Myles Kitt, Curtis Kiyawasew, Jody Kiziak, Jim Klaffl, Cody Klatt, George Klemak, Douglas Klug, Jeff Knibbs, Allen Knight, Anita<br />
Knipe, Darcey Knoblich, Olga Knopov, William Knouse, Ernie Knowles, Tamara Knox, Dwayne Kobes, Russ Kobi, Corey Koble,<br />
Barney Kobzey, Bill Koch, Kouakou Koffi, Sylvain Koffi, Shaju Koickel, Blair Koizumi, Lutz Kolberg, Eva Komers, Cameron Komm,<br />
Hadizata Konate-Rassi, Martin Kondor, Brent Kondratowicz, Ibrahim Kone, Lacina Kone, Sergey Korchagin, Brent Korolischuk,<br />
Rick Koshman, Jennifer Koslowski, Brent Kosowan, Doug Kosowan, Vladimir Kostic, Diane Kostiuk, Kevin Kostrub, Ann Kostyshyn,<br />
Stacey Kotelniski, David Kotsibie, Marcelin Koua, Philippe Kouadio, Hermann Kouame, Randall Kovalenko, Joanne Kowalewski,<br />
Richard Kowalski, Kevin Kowbel, Trevor Kowk, Adam Kownatka, Magdalene Kownatka, Dennis Kozak, Teresa Kozina, Russell<br />
Kraeleman, Cameron Kramer, Andrew Krancz, Lyndon Krankowsky, Trevor Kratz, Bryan Krause, Gary Krause, Trevor Krause, Todd<br />
M. Kreics, Jeffrey Kreiser, Murray Kreiser, Patti Krekoski, Daniel Krentz, Blayne Kress, Connie Kriaski, Michael Krips, Udaya Kumar<br />
Krishnan, Heather Krislock, Linda Kroeker, Peter Krol, Vanja Krtolica, Gabriel Krywolt, Harriet Kubi, Chris Kubisch, George Kucy,<br />
Warren Kuefler, Wayne Kullman, Vikas Kumar, Jeff Kuntz, Tanya Kuntz, Frank Kurucz, Brian Kutash, Steve Kuzmak, Keith Kwan,<br />
Russ Kwan, Kelly Kwiatkowski, Angele Kwon, Karen Kyffin, Bob Kyllo, Robert Laboucane, Stanley LaBrash, Marc Lachambre,<br />
Gernot Lackner, Jocelan Ladner, Phillip Laflair, Philip Lafond, Anny Lafontaine, Levi Lafrance, Ronald LaFrance, Cassandra Lai,<br />
Philip Lai, Theresa Lai, Ronald Laing, David Lake, Edward G. Lalande, Munira Lalji, Elaine Lam, Sam Lam, Kurtis Lamb, Terri<br />
Lamb, Dee Lambert, Dino Lambert, Richard Lameman, Sharon Lamontagne, Dave Landers, Marc Landry, Marcel Landry, Michel<br />
Landry, Stephen Lane, Raul Lanfranchi, Marc Langford, John Langille, Carolyn Langpap, Amanda Lapointe, Krista Lapointe,<br />
Michelle Lapointe, Pamela Lapp, Melvin Lapratt, Gianni Larice, Corey Larocque, Leon LaRose, Katherine Larsen, Dave Larsh,<br />
Penni Larson, Rob Larson, Robert Larson, Bengt Larsson, Ronald Lasek, Reno Laseur, John Lasocki, Barry Lassiter, Daniel<br />
Lastiwka, William Latchuk, Joan Latter, Krista Latunski, Peter Latus, Bob Lauder, Karen Laurin, Steve Laut, Michal Lavi, Bernard<br />
Lavoie, Iris Law, Oliver Law, Ken Lawless, Darron D. Lawrence, Ewen J. Lawrence, Fred Lawrence, Lindsey Lawrence, Shareen<br />
Lawrence, Brian W. Lawson, Gordon Lawson, Martin Lawson, Dave Laycock, Chelsea Layden, Paul Layland, Sharon Layton, Greg<br />
Lazaruk, Brian Leach, Doug Leach, Trevor Leach, Albin Leaf, Rodney Leblanc, Kristopher Lechelt, Susan Leckie, Amanda Lee,<br />
Carmen Lee, Colleen Lee, Connie Lee, Fred Lee, Howard Lee, Jane Lee, John Lee, Swee Lee, Tim Lee, David Leeper, Caroline<br />
Lefebvre, Kevin Legault, Heather Leggett, Derrick LeGrow, Kris Lehocky, Thomas Lemon, Gustavo Leon, Heather Leonard, Joseph<br />
Leonard, Gary Leong, Hin Leong, Stephen Lepp, Paul Lepper, David Lesko, Gerry L. Leslie, Richard Leslie, Shane Lester, Lonnie<br />
Letawsky, Marcus Lethaby, Phil Letkeman, Don Leung, Katie Leung, Preeminence Leung, Wing-Ming Leung, Maurice Levac, Tracy<br />
Levasseur, Jean Levesque, Shelly Lewchuk, Gerald Lewis, Ryan Lewis, Katherine Leys, Larry L’Hirondelle, Guoping Li, Jun Li,<br />
Craig Liba, John Lieverse, Lori Light, Hout (Richard) Lim, Bonnie Lind, Jessica Lind, Penny Linden, Katherine Linder, Ewen<br />
Lindsay, Shari Lindsay, Trina Lineger, Janice Linehan, Yuri Lipkov, Tracy Little, Tony Littlefair, Dennis Liu, James Livingston,<br />
Michael Livingstone, Cam Lizee, Dale Lloyd, Debby Lo, Sharon Lo, Conrad Loch, Richard Lock, Fred Locke, Fred Locke, Kendall<br />
Locke, Darren Loder, Rod Loewen, Joy Lofendale, Ian Lofthouse, Charlene Logan, Randal Logelin, Rodney Logozar, Jorge<br />
Lombardi, Craig Long, Wade Longmore, Dallas Longshore, Sheldon Longson, Herb Longworth, Kai Loo, Roger Lopez, Nelson Lord,<br />
Catlin Lorenson, Darin Lorenson, Matthew Lorincz, Bob Lorinczy, Jose Lotito, Michelle Lou, Andrew Lough, Allan Loughran,<br />
Christopher Love, Larry Love, Mellodie Love, Lloyd Lovelace, Carrie Low, Dan Lowe, Darryl Lowe, Devin Lowe, Brad Lowell, Joe<br />
Lowen, Leah Loyola, Dave Lucas, Gerd Lucas, Serena Lucci, Crystal Lucier, Charlene Luk, Dana Lund, Wes Lundell, Clarence<br />
Lunzmann, Susie Luomala, Jason Lush, Rees Lusk, Kristin Lussier, Jim Lutyck, Wendy Lutzen-Askew, Brent Lydiatt, Ken Lynam,<br />
Wayne Lynch, John Lynn, Jim Lyons, Hong Ma, Michelle Ma, Nicky Maawia, Patricia MacCrimmon, Lindsey Macdearmid, Jason<br />
MacDonald, Mark MacDonald, Ray MacDonald, Raymond G. MacDonald, Anne-Marie MacDonell, Stephen MacDougall, Dorothy<br />
MacIntyre, Shawn Mack, Steve MacKay, Graeme P. MacKenzie, Ken MacKenzie, Kenneth Mackenzie, Ryan MacKenzie, Shawn<br />
MacKenzie, Allan MacKinnon, James William MacKinnon, Graham Mackintosh, Richard MacKnight, Mark MacLean, Susan<br />
MacLean, Callum MacLeod, Douglas MacLeod, Jamie MacLeod, Norma MacNaughton, E. Anne MacNeil, Bradley MacNeill,<br />
Angela MacNiven, Fred MacPhee, Heidi MacRae, Ronald MacSween, Bruce Maddex, Morgan Maddison, Hazel Madore, Ashley<br />
Madrusan, Gary D. Madsen, Markus Maennchen, Cathy Mageau, Mike Magnusson, Bill Mah, Curtis Mah, Jennifer Mah, Tony<br />
Mah, Cheryl Mahoney, Darren Mahony, Martin Mailhot, Al Majdzadeh, Ali Majid, Derek Major, Michelle Major, Anita Mak, Eduardo<br />
Malabad, John P. Malachowski, Ronald Malboeuf, Lanre Maliki, Gilbert Malo, Linda Maloney, Mike Manchen, Leonard<br />
Mandrusiak, Darcy Mandziak, Avy Mann, Darcy Mann, Don Mann, Jan Manoharan, Rachelle Mantei, Roy Marceniuk, Michael<br />
Marchi, Rodney Marcichiw, Ronald Marcichiw, Nick Margiotta, Shane Marion, David Mark, Luis Marquez, Aaron Marshall, Lynn<br />
Marshall, Stephen Marshall, Cesar Martin, Karen Martin, Leonie Martin, Lindsay Martin, Dave Marttila, John Maruszeczka, Allan<br />
Masliuk, Chad Mason, Kevin Mason, Mike Masse, Mandy Massiah, Al Massicotte, Neal Mathieson, Richard Mathieson, Davinder<br />
Mathur, Scott Matieshin, David Matthews, Demetri Mavridis, Tim Maxwell, Richard May, Lyle Mayer, Scott Mayer, Warren<br />
McAllister, Donald McAmmond, Les McAuly-Brand, Robin McBrien, Lisa McCarthy, Bruce McChesney, Lana McClenaghan, Nancy<br />
McCormick, John McCoshen, Clete McCoy, Erin McCoy-Lunn, Peter McDade, Ken McDavid, Shauna McDiarmid, Cheryl McDonald,<br />
Cynthia McDonald, Kevin McDonald, Mark McDonald, Steve McDonald, Rod McDougall, Mary McElroy, Laurie McEwen, K. Tracy<br />
McFadyen, Jason McFarlane, Mark McFarlane, Bruce McFaul, Allan McGann, Frances McGlynn, Terry McGovern, Grant McGowan,<br />
Robert McGowan, Brandy McGrath, Bruce E. McGrath, Paije McGrath, Stephen McGregor, Steve McGregor, Dwain McGuire, Tom<br />
McHale, Gordon McHattie, Marianne McInnis, Alan McIntosh, Eric McIntosh, Sandra McIntosh, Kelvin McKay, KimI McKay,<br />
Lindsey McKay, Robert McKay, Roxana McKay, Tim McKay, Dennis McKee, Robert McKendry, Tammy McKenney, Keith McKenzie,<br />
Mike McKenzie, Sheena McKinnon, Dawson McLachlan, Douglas McLachlan, Bonnie-Lynn McLaren, David McLaughlin, Keith<br />
McLaughlin, Reginald McLaughlin, John McLean, Marla McLean, Michelle McLean, Ross McLean, Joan McLellan, Ian McLeod,<br />
Eamonn McMahon, Blake McManus, Sandra McMichael, Jeff McMillan, Rod McNair, Bryan McNamara, David McNamara, Kendal<br />
McNeil, Lynn McNeil, Bill McNeill, Stephanie McNeill, Jaime McNichol, Robert McNinch, Reid McPhail, Elaine M. McPherson,<br />
Jacqueline McTamney, Maggie McTurk, Manfred Meakes, Tatrina Medvescek, Karyn Meehan-Coles, Stephen Meerman, Jai Mehta,<br />
Corrine Mei, Barry Meier, Daniel Meier, Belinda Meller, Glen Mellom, Richard Mellor, Darrell Mellott, Jean Melnychuk, Marvin<br />
Melnyk, Paul Mendes, Leila Meneses, Jiamei Meng, Jennifer Mercer, Mark Mercer, Grazyna Mercik, Nicole Mercredi, Ambereen<br />
Merk, Timothy Merk, Greg Merkel, Danny Merkley, Nathaniel Merritt, Udell Meservy, Ryan Metz, Steve Meunier, Rick Meyers,<br />
Michael Meynberg, Igor Meynin, Cindy Michalko, Gail Michaud, Barry Michelson, Murray Michie, Ian Middler, Dale Midgley, Jacek<br />
Mielczarek, Michael Mihaichuk, Marc Miiller, Jane Mikalsky, Andrei Mikhailov, Jacqueline Miko, Jeffrey Miller, Laurel Miller,<br />
Sherrie Miller, Wendy Miller, William Miller, Claire Mills, H. John Mills, Jeff Mills, Rob Mills, Ronald Mills, Colin Milne, June Milne,<br />
Nicholas Milne, Stephen Milne, Terence Milne, Mira Minakova, Shikha Minhas, Michelle Minick, Wyman Minni, Denis Mino,<br />
Mason Mintenko, Kerry Minter, Alan Minty, Maria-Celeste Miranda, Daleep Misri, Anice Mitangou, Allan Mitchell, Brent Mitchell,<br />
Dwight Mitchell, Yvonne Mitchell, Neven Mitchell-Banks, Anar Mitha, Chris Mittertreiner, Leon Miura, Lindsey Moen, Tom Moen,<br />
Roman Mognin, Kim Mohler, Bill Moir, Lydia Mok, Mimi Mok, Joshua Molcak, Jeff Molde, Dwayne Molle, Jelena Molnar, Lisa<br />
Molson-Linton, Mike Monias, Rosa Monna, Rick Monteith, Ana Montenegro Bolano, Carmen Moodley, Ken Moon, Alfred Moon Jr.,<br />
Dave Moore, Judy Moore, Kevin Moore, Norma Moore, Melinda Morante, Jason Moravec, Orlando Morean, German Moreno,<br />
Christopher Morgan, David Morgan, Jonathan Morgan, Karen Morgan, Marcia Morgan, Michael Moriarty, Shaun Moroziuk, Karen<br />
Morrice, Gary Morris, Janette Morris, Scott Morris, Tyler W. Morris, Jennifer Morrison, Louise A. Morrison, Wesley N. Morrow,<br />
Shannon Moseng, Paul Mossey, Glen Mott, Bruce Mottle, Mahmood Mousavi, Michael Mousseau, Cheryl Mouta, Gary Mowat,<br />
Wayne B. Mudryk, Lee Mugford, Colin Muir, Yasmira Muir, Peter Mulcahy, Lee-Ann Mules, Lucy Mulgrew, Wanda Mulkay, Noella<br />
Mulvena, Blair Munro, Ryan Munro, Melonie Murchison, Cora Murphy, Carrie Murray, Cliff Murray, Dale Murray, Dean Murray,<br />
Deirdre Murray, William K. Muss, Blythe Mutch, Kevin D.J. Mutch, Anthony Myles, Eva Myles, David Myshak, Melonie Myszczyszyn,<br />
Richard Nachtegaele, Sarah Nadeem, Kuljeet Nagra, Ashley Nagy, Jeannine Nagy, Vilas Naikade, John Naismith, Bill Nalder, Elly<br />
Nance, Rick Napier, Kuralenthi Narayanan, Bill Nash, Darren Naugler, Bill Navratil, John Nayowski, Henriette Ndjoteme-Nendjot,<br />
Marian Neagu, Randy Necember, Michelle Needham, John E. Neff, Fikerte Neguisse, Donald Neigum, Allen Neilson, Aaron Nelson,<br />
Donna Nelson, Douglas Nelson, Gilbert Nelson, Peter Nelson, Vincent Nelson, Cheryl Nepinak, Brad Nessman, Monty Neudorf,<br />
Caleb Neufeld, Darrell Nevil, John Newman, Luke Newport, Kevin Newton, Rae Newton, Alice Ng, Hannah Ng, Tchimou N’Gbesso,<br />
Andy Ngo, Eileen Ngo, Ngoc Ngo, Melissa Nguyen, Tai Nguyen, Thu-Van Nguyen, Muhammad Niaz, Matteo Niccoli, Aaron Nicdao,<br />
Fawn L. Nichol, Gary Nichols, James Nichols, James Nicholson, Doris Nickel, Matthew Nicol, Simon Nicol, William Nicol, Josie<br />
Nicolajsen, Brian Nicoll, Ian Nieboer, Paul Nielsen, Wayne Nielsen, Wesley Nikiforuk, Steven Niu, Bill Noble, R. Scott Noble, Roger<br />
Nolan, Greg Nolin, Bill Norberg, Robert Norman, Troy Normand, David Noseworthy, Kerry Novinger, Daniel Nugent, Eden Nunes-<br />
Vaz, Kelvin Nurkowski, Robert Nuytten, Genia Nyenhuis, Tim Nyitrai, Steve O Reardon, Donald Oaks, Cam Oberg, John O’Brien,<br />
Pamela O’Brien, Jeffery Obrigewitsch, Tim O’Connor, Richard Odlin, Martin O’Donnell, Robert Ogilvie, Anne Marie O’Gorman,<br />
Mike Ogston, Kevin O’Hearn, Greg Oilund, Alvin Olchowy, Delvin Olesen, Scott Oliphant, Dianne Oliveira, Cathy Oliver, Filomena<br />
Olivito, Perry Ollenberger, Jason G. Ollikka, Ghasem Oloumi, Kevin Olsen, Richard Olsen, DeanT Olson, Gary Olson, Stephen<br />
Olson, Warren Olson, Bunmi Oluwole, Kevin Ondic, Dave O’Neil, Tim O’Neill, Jeff Onyskevitch, Margaret Oporska, Kelly Oram,<br />
Anna Oreshkova, Doug Orlecki, Alison Orr, Colette Orr, Neil Orr, Colin Orton, Perry Osgood, Maria Otalora, Deanna Ott, Wayne<br />
Otteson, Mike Ouellet, Denis Ouellette, Jolanta Ouellette, Jean-Francois Ousset, Mark Overwater, Mark Owen, Marilyn Owens,<br />
Michael Owens, Gervais Owonon, Dennis Ozaruk, Fabio Pacheco, Ron Pacholuk, Jared Paddock, Larry Padley, Doug R. Page,<br />
Patricia Page, Elgin Paglinawan, Marcus Pagnucco, Robert Painchaud, Randall Paine, Elizabeth Palmer, Lee Palmer, Rick<br />
Palmer, Kevin Palsat, Glenn Paluck, Miodrag Pancic, Garry Pangracs, Brian Pankiw, William Papineau, Bruce Paquette, Pat<br />
Paradis, Antony Paradoski, Blair Parent, Bernard Parenteau, Clement Parenteau, Joanna Parenteau, Sachin Parikh, Blaine<br />
Parker, Darby Parker, Steve Parker, Barry Parkin, Shelley Parks, Randy Parkyn, John Parr, Jennifer Parrill, John Parry, Jordy<br />
Partington, Ken Partsch, Lawrence Paslawski, Joey Pasos, Michael Pasveer, Andy Paterson, Helen Paterson, Judy Paterson,<br />
Adriana Patino, Brian Patterson, Carolyn Pattinson, Donna Patton, Geoffrey Paul, Wilma Pauls-Atas, Brent Paulson, John<br />
Paulson, Brian Paulssen, Daniel Pavelick, Lance Pawlik, Richard Pawlyn, Linda Pawson, Rick Pay, David Payne, Dean Payne,<br />
Ron Pearce, Brodie Peariso, Gerald Pearson, Pam Pearson, Robert Pearson, Angela Peden, Philip Pedersen, Serene Pedersen,<br />
Shawn Pedersen, Brian Pederson, Lance Pederson, Dianne Peel, Cam Peifer, Sandra Pelkey, Sean Pell, Deborah Pemberton,<br />
Roberto Pena, Peter Peng, Janet Penkar, Joanne Penner, Robin Penner, Kevin Pennington, Subodh Peramanu, John Perepelecta,<br />
Nihal Perera, Don Perry, Gladys Perry, Tarla Persaud, Dmitriy Pershin, Bernie Persson, Carol Pert, Linda Peters, Shelley Peters,<br />
Bernard Peterson, Bill Peterson, Douglas Peterson, William S. Petlyk, Dino Petrakos, Rick Petrick, Henry Petrie, Rodney Petrie,<br />
Nicolas Petrola, Lucyna Pettigrew, John Pettit, Lien Pham, Marie (Huong) Phan, Sherry Phan, Bryanne Philibert, Doug Pierce,<br />
Frank Pike, Ron Pilisko, Jillian Pimblott, Kathy Pinco, Dale Pinder, Alonso Pineda, Dan Pingitore, Barry Pitchford, Edward<br />
Pittman, Aaron Plaksey, Lorrie Player, Ted Plouffe, Erwin Po, Imhotep Pocaterra, Donna Poitras, Wade W. Poitras, David Pole,<br />
Marlene Pollock, Eleanor Polson, Seward Pon, Robert Pool, Chris Poole, James Pope, Colleen Popko, Jason Popko, Carol Porter,<br />
Patti Postlewaite, Jeffrey Poth, Terry Potter, Randy Pottle, Ryan Potts, Bruce Powell, Susan Powell, Laurie Power, Lisa Power,<br />
Melissa Power, Noleen Pratap, Timothy Pratt, Mike Preece, Alanna Price, Nicole Price, Travis Prins, Melodi Pritchard, Lesley<br />
Proctor, Doug Proll, Mangoueu Prosper, Sarah Proudlock, Richard Proulx, Kayla Prowse, Tammy Prudhomme, Ed Pruss, Elizabeth<br />
Pryce, Steve Pshyk, John Puckering, Yesid Edgar Puerto, Justyna Puhl, Nam Pui, Lance Pulak, Suniel Puri, Trent Pylypow, Lu Qing,<br />
Anthony Quach, Munawar Quadri, Laura Quinn, Ron Quiring, Robert Quist, Samir Qureshi, Brad Raaflaub, Mandi Rabeau, Delee<br />
Racz, Warren Raczynski, Levente Rado, Gil Radtke, Chandra Raghavan, Michael Rainey, Yina Raisbeck, Karim Rajan, Christina<br />
Ramirez, Maritess Ramirez, Ruth Ramonas, Bill Ramsay, Matthew Ramsay, Kerri Ramsbottom, Dorotea Ranola, Gregory<br />
Ransom, Jeremy Ransom, Chris Rasko, Shauna Rasmussen, Soukseum Rathamone, Stojan Ratkovic, Murray Rattray, Jason<br />
Rayner, Robert Rayner, Blair Read, Ted Reay, Deston Reber, Bernie Redlich, Donald Reed, Keith Reed, Loreena Reed, Scott Reed,<br />
Tim Reed, Michael Rees, Duncan Rehm, Carmon Reich, Alan Reid, Christopher Reid, Kerry Reid, Lilian Reid, Mark Reid, Tyler<br />
Reid, Angela Reimer, John Reiniger, Glenn A. Reiter, Wendy Reitmeier, Anil Relan, Jody Remezoff, Kelly Rempel, George Renfrew,<br />
Scott Rennie, Dustin Ressler, Russell Retzlaff, James Reynolds, Pat Reynolds, Naseem Rhemtulla, Keith Rhodes, Lisa Rich,<br />
Carolyn Richards, Charles Richards, Rob Richardson, Sandie Richardson, Wesley Richardson, William Richardson, Rick<br />
Richelhoff, Lori Richmond, William Richmond, Jeff Riddell, Robert Riddell, Bonnie Ries, Darren Riley, Dominic Riley, Dale E.<br />
Rinas, Carl Ringdahl, Gordon Ringheim, Serge Rioux, Michelle Rivard, Carlos Rivera, Daniel Rivera, Tracey Roasting, Jo-Anne<br />
Robak, Jimmie Roberts, Brian Robertson, Dale Robertson, Nancy Robertson, Stephen Robertson, Heather Robillard, Aaron<br />
Robinson, Amber Robinson, David Robinson, Donna Robinson, Gene Robinson, Julian Robinson, Scott Robson, Jaime Roche,<br />
Neal Roculan, Sheila Rodberg, Roger Rodermond, Humberto Rodriguez, Olga Rodriguez, Roberto Rodriguez, Paul Roett, Dean<br />
Rogal, Martin Rogers, Neil Rogerson, Victor Rogerson, Henry Rojo, Neil Rokos, Paul Rokosh, Louis L. Romanchuk, Dwayne<br />
Romanovich, William Rombough, Eduardo Romeo, Joy Romero, Claude Rondeau, Harvey Rosenkranz, Dennis Ross, Indra Ross,<br />
Robert Ross, Ron Ross, Graham Rosso, Worley Rosson, Barry Rosychuk, Cheryl Rosychuk, Rick Rosychuk, Roy Roth, Tom Roth,<br />
Katarina Rothe, Judy Rotzoll, David Rouleau, Gordon Rourke, Richie Rovere, Natasha Rowden, Scott Rowein, Andrea Roy, Beverly<br />
Roy, Jeff Roy, Zenita Ruda, Colleen Rudolph, Colleen Ruggles, Nigel Rusk, Denise Russell, Matthew Russett, Jeff Rutherford,<br />
John Rutherford, Brian Rutledge, Doug L. Rutley, Daniel Ruttan, Mark Rutter, Hal Rutz, David Ruud, Dan Ryan, Rick Rybchinsky,<br />
Craig Ryder, Jessica Rylaarsdam, Jeff Ryll, Mikael Sabo, Adam Saby, Gurdip Sahota, Poonam Saini, Darlene G. Sakires, Dwight<br />
Salahub, Mourad Salameh, Alba Salazar, Shahid Saleem, Peter Salomon, Gord Salt, Jennifer Sampson, Geoffrey Samuel, Juan<br />
Jose Sanchez, Andrea Sanden, David Sanderson, Michael Sanderson, Sandy Sandhar, Darryl Sandquist, Tom Sanelli, Juan Pablo<br />
Santini, Megan Santucci, Andrea SanVicente-Kraus, David Sargent, John C. Sargent, Carlos Sarmiento, Anita Sartori, Greg<br />
Sauer, Lisa Saumier, Jesse Savard, Christine Savary, Brian Saville, Codey Saville, Luc Savoie, Rajan Sawhney, William Sawyers,<br />
Chris Sayer, Richard Sayer, Amber Sayers, Kimberley Scagliarini, Christine Scammell, Ryan Scammell, Brian Scarth, Robert<br />
Schaap, Trevor Schable, Bruce Schade, Judy Schafer, Derek Schaffer, Paul Schaub, Lorne Schaufert, Perry Scheffelmaier, Barry<br />
Schellenberg, Mike Schellenberg, Lance Schelske, Curtis Scherger, Sally Schick, Larry Schielke, Mike Schiller, Ronald Schlachter,<br />
Marcus Schlegel, Helen Schlenker, Tracy Schmaltz, Beat Schmid, Jeannette Schmidt, Kimberly Schmidt, Raquel Schmidt, Joseph<br />
Schmitz, Melissa Schmitz, Christopher Schneider, Craig Schneider, Darryl Schneider, David Schneider, Debbie Schneider, Joseph<br />
Schneider, Luanne Schneider, Paul Schneider, Blaine Schnell, Craig Schnepf, Aaron Schnick, Jack Schnieder, Ronald Schnieder,<br />
C. Brian Schnurer, Rene Schoch, Stephen Schofield, Norm Schonhoffer, Tracy Schooler, Elka Schrijver, Jennifer Schroeder,<br />
Sheldon Schroeder, Michael Schubert, Tricia Schuh, Stephen Schultheiss, Randy Schultz, Kevin Schumacher, Lorraine Schwetz,<br />
Tony Sciarrabba, Leslie Scory, Curtis Scott, Drew Scott, James Scott, John Scott, Murray Scott, Ronalda Scott, Rodney Scoville,<br />
Ashley Scriba, Neil Scully, Gordon Seabrook, Geordie Seaton, Adam Seber, Don Sedor, Brian Segouin, Morley Seguin, Stephen<br />
Seguin, Linda Sehn, Clayton Seifridt, Paul Seipp, Fraser Selfridge, Mike Sell, Kenneth Selman, Leslie Semeniuk, Roland Senecal,<br />
Debbie Sereda, Edward Serniak, Cindy Severite, Jeremy Seward, Gianni Sgambaro, Mohsen Shafizadeh, Sanjay Shah, Aqeel<br />
Shakir, Philip Shankowski, Gilbert Shantz, Raj Sharma, Brigitte Shaw, Lisette Shaw, Marilyn Shaw, Dorothy Shea, David<br />
Sheaves, Wayne Sheaves, Ben Shenton, Glenn Sheppard, Robert Sheppard, Judi Shermerhorn, Jason Sherstabetoff, Kyla<br />
Shideler, Annette Shillam, Bill Shmoury, Leonard Shostak, Robert Shumay, Trent Shwaluk, Morgan Sibley, Melanie Siddon, Steve<br />
Siemens, Travis Siemens, Andrew Sikomas, Wayne Sikorski, Lorraine Silas, Beh Silue, Armindo Silva, Cam Simard, Kevin<br />
Simard, Francesca Simms, Bradley Simonar, Barbara Simpson, Brad Simpson, Gordon Simpson, Pat Simpson, Elisha Sinclair,<br />
Garry Sinclair, Robert Sinclair, Jerret Singer, Mackenzie Singer, Darcy Singleton, Paul Siree, Richard Sisson, Matt Skanderup,<br />
Kelly Skarra, Ashley Skiba, Geoffrey Skinner, Michael Skipper, Max Skliarov, Grace Skoczek, Shirley Skulmoski, Martin Skulski,<br />
Michael Skyrpan, Michelle Slater, Michael Slavin, Edward Sleet, Delwin M. Slemp, Darrell Sleno, Kevin Slotwinski, Doreen Smale,<br />
Lyle Small, David Smart, Bill Smith, Blair Smith, Bonnie Smith, Carl Smith, Catriona Smith, David L.M. Smith, Jessica Smith,<br />
Maurice Smith, Michael Smith, Nancy Smith, Robert Smith, Ryan Smith, Sandra Smith, Scott Smith, Tim K. Smith, Tina Smith,<br />
Todd Smith, V. Todd Smith, Allen Smyl, Brad Smylie, Jeffrey Snide, Robert Snihur, Kurt Snow, William Snow, Douglas Snyder,<br />
Kristine Snyder, Catherine Sobieski, Kristi Soderman, Angelina Solis, Ray Soon, Laurie Sopkow, Hans Sorensen, Curtis Sorochan,<br />
Daryl Soroko, Dallas Spagrud, Paul Spavor, Eddie Spearman, Jason Spears, Robert Spears, Gail Spence, Kevin W. Spencer, Darcy<br />
Spenst, David Spetz, David Spooner, John Springer, Mike Sprinkle, Ellis Spurrell, Lawson Squire, Murugan Srinivasan, Robert<br />
St.Amant, Richard St.Martin, Robert St.Martin, Mario St.Pierre, Megan Stables, Carrie Stacey, Ian Stacey-Salmon, Randy<br />
Stadnyk, Stacey Stadnyk, Tyson Stafford, Kendall Stagg, Rodney Stahn, Mark Stainthorpe, Karen Stairs, Ernesto Stamile, Randy<br />
Stamp, Nick Stanford, Michael Stang, Jason L. Starchuk, Lezlie Stark, Christie Starnes, Vicki Starr, Justin Stastook, Scott<br />
Stauffer, Scott Stauth, Achilles Stavropoulos, Craig Steel, Mark Steenbergen, Leanne Steeves, Gary Stefan, Jerry Stefanyshyn,<br />
Wayne Steffen, Robert Steinborn, Carolyn Steinson, Peter Stephen, Taryn Stephenson, G. Austin Stevens, Lyle Stevens, Robert<br />
Stevenson, Carol Stewart, Don Stewart, Douglas Stewart, Lorie Stewart, Rory Stewart, Wendy Stewart, Kevin Stilwell, Stewart<br />
Stirling, Melissa Stockes, Lindsey Stockley, Mark Stockton, Eric StPierre, Suzanne Strachan, Wade Strand, Robert Strang, Linda<br />
Strangway, Tanner Strangway, George Stratford, Brenda Stratichuk, Michael Street, William Stretch, Matthew Stroh, Michael<br />
Stroh, Brianna Stromberg, Sherry Struck, Robert Struski, Cory Struth, Dwayne Strynadka, Linda Stuart, Allan Stubel, Paul<br />
Stuckey, Mike Sturkenboom, David Sturrock, Ravi Subramaniam, Stephen Suche, Justin Sullivan, Mark Sullivan, Shelley<br />
Sullivan, Shiraz Sumar, Effie Summers, Daniel Sutherland, Laura Sutherland, Scott Sverdahl, Rade Svorcan, Michael Swain,<br />
Adam Swallow, Christine Swan, Rick Swanson, Nathan Swennumson, Halina Swierz, Don Sylvestre, Catherine Szmata, Vicky Ta,<br />
Darren Taciuk, Marlin Taillefer, Dave Talbot, Miguel Tamayo, Kevin Tanas, J. Nick Tannahill, Aaron Tannas, Krystalle Tanner,<br />
Michael Tanouye, Kari Tansowny, Dan Tarasoff, Kourosh Tarighi, Bill Tarkowski, Ron Taron, Ross Tarrant, Joanne Taubert, Nader<br />
Tavassoli, Ray Taviner, Brad Taylor, Brian Taylor, Carla Taylor, Cathy Taylor, Colin Taylor, Dana Taylor, Dawn Taylor, George Taylor,<br />
James Taylor, James R. Taylor, Jennie Taylor, Ken Taylor, Ken W. Taylor, Joseph Taza, Chin Seng Teh, Berhanu Temesgen, Robert<br />
Templeton, Derek Tempro, V. Leighton Tenn, Kurt Tenney, Marilyn R. Tenold, Stephen Terry, Gus Teske, Jason Tessier, Terence<br />
Tham, Michelle Thares, Richard Theberge, Jean-Paul Theriault, Marc Theroux, Laureen Thiele, Chad Thiessen, Chris Thiessen,<br />
Karen Thistleton, Laurie Thomas, Angela Thompson, Arthur Scott Thompson, Ben Thompson, Chris Thompson, Gerald Thompson,<br />
Herb Thompson, Ian Thompson, Mark Thompson, Mindy Thompson, Ryan Thompson, Peter Thomsen, Adele Thomson, Julie<br />
Thomson, Todd Thomson, Bruce Thornton, Keith Thornton, Jason Thurlow, Andrea Thurmeier, Margaret Thurmeier, Daniel<br />
Tillapaugh, Joseph Tiller, Sandra Tillier, Terry Tillotson, Colin Tiltman, Brian Timmerman, David Timms, Simon Timothy, Bruce E.<br />
Tipton, Dharmendra Tiwary, Eric To, Carol Tobin, Ron Tochor, James Todd, Akindele Tododo, Mervin Todoschuk, Al Tokarchik, Alfred<br />
Tokpa, Chris Tomlinson, Dale R. Tomlinson, David Tonner, Domenic Torriero, Chyndelle Toth, David Toth, Paige Tracey, Sabrina D.<br />
Trafiak, Maurice Tremblay, Catherine Trenouth, Brian E. Trimble, Ray Trombley, Len Trotzuk, Sherry Truman, Michael Truong,<br />
Ruari Truter, Lisa Tsimaras, David Tuite, Sunny Tulan, Brent Tulloch, Neil Tulloch, Bruce Tumbach, George Tunnicliffe, Art Tupper,<br />
Terry Turgeon, Trent Turgeon, David Turk, Dick Turnbull, Barb Turner, Stanley Turner, Darren Turpin, Veronika Turska, William<br />
Tustian, Irene Tutto, Cary Twardy, Dave Tweddell, Kelly Tweten, Oleg Tyan, Wayne Tymchuk, Shaun Tymchyshyn, Kathleen Tynan,<br />
Kenechukwu Ufondu, Eric Ulrich, Gregory A. Ulrich, Janis Underdahl, Nathan Underwood, Karl Unger, Jackeline Urdaneta, Roger<br />
Vachon, Anand Vaidyanath, Allan Valentine, Darrel Valin, Gary L. Valiquette, Louis Vallee, Michael Vallee, Helene Vallieres,<br />
Vyvette Vanderputt, Christina VanderPyl, Timothy vanGoudoever, Bryant VanIderstine, Hennie vanNiekerk, Salomon VanRensburg,<br />
Collin Vare, Daniel Vasseur, Nicolette Vaughan, Laureen Vaughan-Kirk, Sheila Verigin, Natalia Verkhogliad, Dan Verleyen, Nancy<br />
Tay Vetrici, Cesar Viana, Dale Vickery, Wilf Vielguth, Marvin (Joe) Viola, Tony Vitkunas, Demetry (Jim) Vlahos, James W. Vollman,<br />
Mel Vollman, Leo Vollmin, Luke Vondermuhll, Kyle Waddy, Todd Waggoner, Trevor Wagil, Joy Wagner, Juon Wah, Lee Wahl, Robert<br />
N. Waites, Donald Wakaruk, Michael Lane Wakefield, Kevin Wakulchyk, Ken Walchuck, Jeff Walden, Dave Waldner, Darcy Waldo,<br />
Sara Waldo, Carolyn Walker, David Walker, David Walker, Martin Walker, Erin Wallace, Greg Wallace, Kevin Wallace, Marie<br />
Wallace, Vince Wallwork, Lorie Walter, Michelle Walton, Roger Walton, Alfred Wandler, John A. Wandler, Blaise Wangler, Tim<br />
Wanner, Kathy Ward, Kirk Ward, Terry Ware, Wayne M.J. Warholik, Chris Wark, Wanda Warman, John Warrell, Colin Warren,<br />
Michael Warrick, Ajit Warrier, Faye Warrington, Paul T. Wassell, Godfried Wasser, James Waterfield, Frank Watkin, Julie Watkins,<br />
Kay Watson, Ken Watson, Graham Watt, John Watts, Trish Wear, Alan Webb, Byron Webb, Larry Webb, Kent Weber, Keith Webster,<br />
Gail Wee, Eric Weening, Carlee Wehrhahn, Jeff Weibrecht, Lionel Weinrauch, Randy Weir, Brock Weisgerber, Adrian Weleschuk,<br />
Guy Welwood, Mark S. Wenner, Dwayne Werle, Craig Werstiuk, Matthew Werstiuk, Ted Wesley, Darrin West, Jacqueline West,<br />
Michael Westad, Terry Wetzstein, Nina Whalen, John Wham, Terence Whang, Loyd Wheating, Joshua Wheaton, Andrew Wheeler,<br />
Charmaigne Whelan, Chris Whelan, Rosemarie Whelan, Daniel White, Debbie White, Francis W. White, Howard White, Julie<br />
White, Ken White, Ralph White, Sarah White, David Whitehouse, Audrey Whitlock, Michael Whittingham, Heather Whynot, Blaine<br />
Wicentovich, David Wiebe, Debbie Wiens, Cameron Wietzel, Cheryl Wiggett, Zandra Wigglesworth, Shandi Wigley, Bob Wilbern,<br />
Brandon Wild, Darrell Wilde, John Wilding, Daryl Wiles, Troy Wilk, Melanie Wilkie, Amy Wilkinson, Derek Wilkinson, Pauline Will,<br />
Elmer Willard, Bill Williams, Grant Williams, Greg Williams, Julian Williams, Kelvin Williamson, Monty Williamson, Jeff Willick,<br />
Robin Willis, Christian Willson, Curtis Wilson, Don Wilson, Edward Wilson, Ian Wilson, Jeff Wilson, Jim Wilson, Marty Wilson,<br />
Patrick Wilson, Tammy Wilson, Tyler Wilson, Woodrow Wilson, Joan Wilton, Bob Wing, Jodie Winquist, Ken Winsborrow, Noel<br />
Winter, Greg Winters, Garrett Wirachowsky, Barry Wiseman, Jeff Wiseman, Morris Wiseman, Paul Wiseman, Zachary Witmer, Dale<br />
Wittman, Cameron Wlad, Kelly Woidak, Colin Woloshyn, C. K. Bill Wong, Jason Wong, Jennifer Wong, Linda Wong, Lisa Wong, Julie<br />
Woo, E. Bette Wood, Leonard Wood, Philip Wood, Roxanne Wood, Laura Wooding, Travis Woods, Marilyn Woodske, Wayne<br />
Woodward, Robin Woolner, Sidney Wosnack, Raymond Wourms, Mark Woynarowich, Chris Wright, Daniel Wright, Richard Wright,<br />
Stephen Wright, Bin Wu, Christine Wutzke, Brent Wychopen, Guy Wylie, George Wyndham, Brent Wyness, Barry Wynne, Valerie<br />
Wyonzek, Canghu Yang, Zhen Lin Yang, Andrew Yaremko, Rick Yarmuch, Teddy Yarmuch, James Yaroslawsky, Jeff Yates, Noah<br />
Yates, Basile Yeboue, Betty Yee, Davin Yee, Michael Yee, Claire Yeoman, Michael Yeoman, Jeffrey Yip, Kitty Yip, Tony Yip, Mark<br />
Yobb, Amber Yoingco, Darrell York, Rachelle Yorke, Daryl Youck, Chalene Young, Clayton Young, Lynn Young, Michael Young, Ray<br />
Yowney, Eugene Yu, Jian-Yang Yuan, Clement Yuen, Dustin Yuill, Jeff Yuill, William Yuill, Brian Yurchyshyn, Robin Zabek, Robert<br />
Zabot, Gabriel Zachoda, Tyler Zachoda, Cam Zackowski, Attila Zahorszky, Devin Zaichkowsky, Domingo Zambrano, Mark Zan,<br />
Kendall Zarowny, Glenn Zeebregts, Lynn Zeidler, Diane Zeilznik, Tony Zeiser, Aleksandra Zelic, Darcy Zelman, Denis Zentner,<br />
Kathy Zerr, Michelle Zerr, Jessica Zhang, Xu (Frank) Zhang, Susan Zheng, Wanli Zhu, Evgeny Zhuromsky, Brenda Ziegler, Dwayne<br />
Zilinski, Megan Zilkey, Hernando Zorrilla, Aaron Zubot, Ana Zulueta
<strong>Canadian</strong> <strong>Natural</strong> AR2006<br />
Page 10 of 107<br />
Review of Operations<br />
TIM S. McKAY,<br />
SENIOR VICE-PRESIDENT,<br />
OPERATIONS<br />
Production <strong>Strategy</strong> and Results<br />
In 2006, <strong>Canadian</strong> <strong>Natural</strong>’s defined strategy continued to deliver;<br />
our production and reserves grew significantly as they have each<br />
and every year since 1989. Through the last 18 years, we have<br />
adhered to the same defined business strategy of maintaining large<br />
project inventories in every product and basin in which we operate.<br />
Large project inventories enable the Company to continually highgrade<br />
the capital allocation process and balance production mix<br />
among each of the commodities we produce; namely natural gas,<br />
light/medium crude oil, Pelican Lake crude oil, primary heavy crude<br />
oil and thermal heavy crude oil.<br />
In 2006 we again achieved record levels of production on a barrels<br />
of oil equivalent basis. Production before royalties was 581 mboe/d<br />
during 2006, up 5% from 2005 levels and was achieved through a<br />
combination of exploration, asset development, and the acquisition<br />
of ACC. <strong>Natural</strong> gas production before royalties increased by 4%<br />
and continues to represent our largest product offering. Total crude<br />
oil and NGLs production before royalties increased by 6%, with the<br />
primary drivers being a full year’s benefit of production from the<br />
Baobab Field located offshore Côte d’Ivoire, the commencement<br />
of production from the Primrose North expansion project and the<br />
continued improvements to Pelican Lake EOR performance.<br />
Daily natural gas production, before royalties (mmcf/d)<br />
06<br />
05<br />
04<br />
03<br />
02<br />
1,492<br />
1,439<br />
1,388<br />
1,299<br />
1,232<br />
Strategic Land Base<br />
MARY-JO E. CASE,<br />
VICE-PRESIDENT, LAND<br />
<strong>Canadian</strong> <strong>Natural</strong> has the largest undeveloped land inventory in the<br />
Western <strong>Canadian</strong> Sedimentary Basin (“WCSB”), with undeveloped<br />
net acreage totaling 12.8 million net acres. Total WCSB landholdings<br />
were 19.2 million net acres at the end of 2006, up significantly,<br />
16%, from 2005, as a result of continued land purchases and the<br />
acquisition of ACC. This strong concentrated land base affords<br />
significant opportunities to control our operating costs, and finding<br />
and onstream costs. The vast majority of our land base is positioned<br />
to utilize existing owned and operated infrastructure and it also<br />
strategically positions us to maximize the benefit of new play types<br />
2006 2005<br />
Production Mix Production Mix<br />
(before royalties) mboe/d % mboe/d %<br />
<strong>Natural</strong> gas 249 42 240 43<br />
North America light/medium crude oil and NGLs 51 9 52 10<br />
Pelican Lake crude oil 29 5 23 4<br />
Primary heavy crude oil 91 16 93 17<br />
Thermal heavy crude oil 64 11 53 10<br />
North Sea light/medium crude oil 60 10 69 12<br />
Offshore West Africa light/medium crude oil 37 7 23 4<br />
Total 581 100 553 100<br />
Daily crude oil and NGLs production, before royalties<br />
(mbbl/d)<br />
06<br />
05<br />
04<br />
03<br />
02<br />
332<br />
313<br />
283<br />
242<br />
215
Review of Operations<br />
Page 11 of 107<br />
CORE LANDHOLDINGS<br />
2006 2005<br />
(thousands of acres)<br />
North America<br />
Gross Net % Gross Net %<br />
Developed 8,062 6,366 79 7,184 5,699 79<br />
Undeveloped 15,848 12,785 81 13,163 10,947 83<br />
23,910 19,151 80 20,347 16,646 82<br />
North Sea<br />
Developed 138 93 67 138 93 67<br />
Undeveloped<br />
Offshore West Africa<br />
367 299 81 457 352 77<br />
Developed 7 4 57 7 4 58<br />
Undeveloped<br />
Total<br />
247 207 84 521 426 82<br />
Developed 8,207 6,463 79 7,329 5,796 79<br />
Undeveloped 16,462 13,291 81 14,141 11,725 83<br />
24,669 19,754 80 21,470 17,521 82<br />
developed by ourselves and industry.<br />
The infrastructure associated with this vast, concentrated land<br />
base also provides a competitive advantage in terms of lower<br />
marginal operating and development costs for newly drilled<br />
or acquired properties. This dominance can create acquisition<br />
opportunities, as we maintain a low-cost regime and access to<br />
strategic infrastructure.<br />
Geo-Science <strong>Strategy</strong><br />
We believe that a multi-disciplined focus on geology, geophysics<br />
and reservoir engineering reduces exploration risk and ultimately<br />
results in better full cycle economics. Integrating the seismic<br />
interpretation with geology and innovative engineering results in<br />
our successful annual drilling program and adds new high quality<br />
locations to our conventional and unconventional inventory. In<br />
Canada, we invested $74 million during 2006 to acquire new<br />
seismic and to purchase and reprocess existing seismic data. In<br />
Total North America landholdings (thousands of net acres)<br />
06<br />
05<br />
04<br />
03<br />
02<br />
6,366 12,785<br />
5,699 10,947<br />
4,889 11,523<br />
4,036 9,811<br />
3,832 10,213<br />
total, 3,667 kilometers of conventional 2D seismic data and<br />
228 square kilometers of 3D seismic data were acquired.<br />
Additionally, 9,469 kilometers of conventional 2D seismic data<br />
and 437 square kilometers of 3D seismic data were purchased.<br />
We continue to acquire this data under stringent environmental<br />
controls and in a cost effective manner. The ACC acquisition<br />
resulted in adding 394 kilometers of 2D seismic data and 23,000<br />
square kilometers of 3D seismic data to our database.<br />
In the North Sea, we purchased 739 square kilometers of 3D<br />
seismic and reprocessed a further 1,210 square kilometers of<br />
3D seismic data. This data allows us to continue aggressive in-field<br />
and near-field development and exploration. In Offshore West<br />
Africa we purchased 3,796 kilometers of 2D seismic data and<br />
acquired 168 kilometers of electromagnetic seabed data to help<br />
confirm seismic prospects.<br />
Seismic expenditures in Canada ($ millions)<br />
06<br />
05<br />
04<br />
03<br />
02<br />
74<br />
96<br />
61<br />
48<br />
40
<strong>Canadian</strong> <strong>Natural</strong> AR2006<br />
Page 12 of 107<br />
Review of Operations (continued)<br />
ACTIVITY BY CORE REGION<br />
Net Undeveloped Land Drilling Activity<br />
(thousands of net acres) (net wells)<br />
2006 2005 2006 2005<br />
<strong>Canadian</strong> conventional<br />
Northeast British Columbia 2,721 2,027 196 241<br />
Northwest Alberta 1,750 1,507 194 183<br />
Northern Plains 6,804 6,238 728 711<br />
Southern Plains 870 621 120 354<br />
Southeast Saskatchewan 117 82 75 52<br />
In-situ Oil Sands 407 356 247 196<br />
12,669 10,831 1,560 1,737<br />
Horizon Oil Sands Project 116 116 163 126<br />
United Kingdom North Sea 299 352 9 14<br />
Offshore West Africa 207 426 6 5<br />
13,291 11,725 1,738 1,882<br />
Drilling Activity and <strong>Strategy</strong><br />
In 2006, high demand resulted in increased costs for drilling<br />
and related activities; coupling this with the inefficiencies of<br />
an overheated service sector created a very unfavorable cost<br />
environment for organic growth. Strong demand resulted in low<br />
service crew efficiencies partially due to utilizing less experienced<br />
personnel. This was combined with an unusually warm start to<br />
the winter drilling season and the resultant aggressive attempts to<br />
complete the program before the onset of spring breakup.<br />
By May 2006, we made the strategic decision to reduce capital<br />
spending on natural gas drilling activities due to exceedingly<br />
high service costs in Western Canada. The result was a<br />
17% reduction in total drilling activity, excluding service and<br />
stratigraphic test wells. We still maintained a drilling success rate of<br />
91% reflecting the low-risk exploitation approach that we take to<br />
the business.<br />
Total net wells drilled<br />
06<br />
05<br />
04<br />
03<br />
02<br />
DOUGLAS A. PROLL,<br />
CHIEF FINANCIAL OFFICER,<br />
SENIOR VICE-PRESIDENT, FINANCE<br />
1,738<br />
1,882<br />
1,449<br />
1,793<br />
900<br />
For 2007 we plan to further reduce drilling activity by 19%, in<br />
response to continued cost pressures in the basin and to balance<br />
capital spending in light of the 2006 acquisition of ACC.<br />
Drilling success rate,<br />
excluding stratigraphic test/service wells (%)<br />
06<br />
05<br />
04<br />
03<br />
02<br />
RANDALL S. DAVIS,<br />
VICE-PRESIDENT,<br />
FINANCE & ACCOUNTING<br />
91<br />
93<br />
91<br />
91<br />
94
Review of Operations<br />
Page 13 of 107<br />
WELLS DRILLED<br />
Year Ended December 31 2006 2005<br />
Gross Net Success Net Success<br />
Crude oil – North America<br />
Light crude oil 140 113 92% 81 92%<br />
Pelican Lake crude oil 144 144 100% 83 99%<br />
Primary heavy crude oil 301 274 94% 341 94%<br />
Thermal heavy crude oil 66 60 98% 107 98%<br />
North Sea light crude oil 8 8 100% 12 87%<br />
Offshore West Africa light crude oil 7 4 100% 3 85%<br />
666 603 95% 627 95%<br />
<strong>Natural</strong> gas – North America<br />
Northeast British Columbia 185 163 90% 201 88%<br />
Northwest Alberta 192 155 88% 152 92%<br />
Northern Plains 286 219 84% 199 84%<br />
Southern Plains 192 104 93% 338 99%<br />
855 641 88% 890 91%<br />
Dry 133 119 117<br />
Subtotal 1,654 1,363 91% 1,634 93%<br />
Stratigraphic test / service wells 376 375 248<br />
Total 2,030 1,738 1,882<br />
North American crude oil drilling remained strong with over 600<br />
wells drilled, essentially flat with 2005 levels. This reflected the<br />
superior recycle ratios experienced on heavy crude oil during 2006<br />
as well as better cost control capability for this activity. These heavy<br />
crude oil drilling activities benefit from lands which are generally<br />
accessible year-round, larger scale programs which generate<br />
efficiencies and the requirement for fewer ancillary services than<br />
natural gas drilling.<br />
During 2006, 163 net stratigraphic wells were drilled on our oil<br />
sands mining leases and 181 were drilled on our thermal in-situ<br />
oil sands leases to delineate resource potential and better define<br />
the Company’s growth opportunities. Additionally a total of 31 net<br />
stratigraphic and service wells were drilled, including 27 wells in<br />
Canada and 4 internationally.
<strong>Canadian</strong> <strong>Natural</strong> AR2006<br />
Page 14 of 107<br />
Marketing<br />
<strong>Natural</strong> Gas<br />
<strong>Canadian</strong> <strong>Natural</strong>’s gas marketing objective is to maximize the<br />
realized price for its overall portfolio. Our strategy is predicated<br />
on the development of solid business relationships based on<br />
demonstrated performance and integrity, and working together<br />
with our customers to meet their needs. We market primarily to<br />
large, credit worthy utilities, industrial and commercial customers<br />
across North America. The current portfolio includes 19% of direct<br />
sales to various American customers, 71% sold directly into our<br />
domestic markets with the remaining 10% going to the Alberta<br />
based gas supply and market aggregators. <strong>Canadian</strong> <strong>Natural</strong>’s<br />
portfolio is essentially driven by current market prices with over<br />
99% of all sales fluctuating with the pricing index prevailing at the<br />
points of physical delivery of the gas. The marketing team monitors<br />
regulatory applications by the pipeline companies and participates<br />
as necessary to ensure an optimal outcome is achieved for all<br />
concerned parties.<br />
<strong>Canadian</strong> <strong>Natural</strong>’s realized wellhead price in 2006 was 22% lower<br />
than in 2005 at $6.77/mcf primarily due to very warm winter<br />
weather across North America which resulted in strong natural gas<br />
inventories all year. The natural gas storage positions are expected<br />
to close the withdrawal season at the end of March 2007 at levels<br />
close to those seen in 2006. Drilling activity in the US was very<br />
strong in 2006 with a record number of completions at 29,356<br />
whereas in Western Canada, we experienced the first yearly<br />
reduction in completions since 2002 at 15,362. However, the North<br />
American overall demand was essentially flat year over year with<br />
the increase in the electrical generation offset by the losses from<br />
the industrial sector.<br />
WTI crude oil reference pricing (US$/bbl)<br />
06<br />
05<br />
04<br />
03<br />
02<br />
RÉAL M. CUSSON,<br />
SENIOR VICE-PRESIDENT,<br />
MARKETING<br />
66.25<br />
56.61<br />
41.43<br />
31.02<br />
26.11<br />
We expect the North American supplies to be challenged in the<br />
near term as the industry needs to become more efficient to contain<br />
its costs. The reduction in gas directed drilling activities started in<br />
late 2006 and is continuing in the first quarter of 2007, which<br />
should result in significantly lower yearly production volumes for<br />
the industry in 2007. The longer term prospects look very positive<br />
for the gas business as it is increasingly challenging to bring large<br />
incremental quantities to markets. The large number of proposals<br />
to import liquefied natural gas in the North American grid has yet<br />
to translate into incremental quantities available to the end<br />
users with the 2006 import volumes remaining flat at 1.8 bcf/d.<br />
The forecast is for a modest increase of these volumes in 2007<br />
as the competition for supplies intensifies with European and<br />
Asian markets.<br />
<strong>Canadian</strong> <strong>Natural</strong>’s natural gas production for 2007 is forecast<br />
to average between 1,594 - 1,664 mmcf/d and with the current<br />
2007 pricing strips for NYMEX at US$7.60/mmbtu and AECO at<br />
C$7.57/GJ, this would yield an overall wellhead price of C$7.90/mcf<br />
for our sales portfolio, using a US$0.86/C$1.00 exchange rate.<br />
NYMEX natural gas reference pricing (US$/mmbtu)<br />
06<br />
05<br />
04<br />
03<br />
02<br />
7.26<br />
8.56<br />
6.09<br />
5.44<br />
3.25
Review of Operations: Marketing<br />
Page 15 of 107<br />
Crude Oil<br />
<strong>Canadian</strong> <strong>Natural</strong>’s crude oil marketing strategy is designed to<br />
unlock the value of our vast heavy oil reserves. The three major<br />
components of our strategy consist of blending various crude<br />
oil streams and diluents to better serve the needs of our refining<br />
customers, support and participate in the expansion of pipeline<br />
export capacity and to support and participate in projects adding<br />
incremental conversion capacity for bitumen and SCO.<br />
<strong>Canadian</strong> <strong>Natural</strong>’s realized wellhead price increased by more<br />
than 15% in 2006 to $53.65/bbl mainly based on the strong<br />
worldwide demand for hydrocarbons and a constrained supply<br />
environment with practically no spare capacity from the producers<br />
and full utilization of worldwide refining assets. The benchmark<br />
price for WTI crude oil was up 17% in 2006 to US$66.25/bbl<br />
and hit an all time high of US$78.40/bbl on July 14 primarily in<br />
response to the political turmoil in the Middle East. Brent crude<br />
oil was also higher than in 2005 by 20% to US$65.18/bbl<br />
based on strong European and Asian demands. The price<br />
differential for the Lloyd Blend heavy crude oil improved by<br />
4% over 2005 at 33% of the WTI benchmark. The stronger<br />
commodity prices were somewhat offset by a <strong>Canadian</strong> currency<br />
that was 6% stronger in 2006.<br />
<strong>Canadian</strong> <strong>Natural</strong> continued to successfully implement its blending<br />
strategy in 2006 and contributed 53% of the total 257 mbbl/d of<br />
WCS stream in the fourth quarter. The second phase of the marketing<br />
strategy entails geographic expansion of pipeline systems to open<br />
new markets for heavy crude oil. The logistical challenges are being<br />
addressed by industry and significant progress was achieved in 2006<br />
with the new service on the Spearhead and Pegasus pipelines to<br />
reach the Southern PADD II refining markets. These expansions had<br />
a very positive impact on heavy crude oil differentials over the last<br />
nine months of 2006.<br />
LLB price differential to WTI (%)<br />
06<br />
05<br />
04<br />
03<br />
02<br />
33<br />
37<br />
32<br />
28<br />
25<br />
In the future, several pipeline projects are being developed to<br />
transport crude oil from the WCSB to the West Coast, Eastern PADD<br />
II and Southern PADD II with access to the US Gulf Coast refineries.<br />
In particular, the Enbridge Southern Access Pipeline expansion is<br />
scheduled to add 394,000 bbl/d to the greater Chicago market area<br />
by 2009 and the Terasen TMX 1 project to add a total of 75,000<br />
bbl/d to the West Coast by 2008. The TCPL Keystone project, which<br />
could add 435,000 bbl/d to the Woodriver and Patoka market area,<br />
has received the approval from the National Energy Board to transfer<br />
a gas pipeline to the oil service. Keystone has filed its application to<br />
build the facilities and is currently conducting an open season on its<br />
option to extend its proposed pipeline to Cushing with an ultimate<br />
capacity of 590,000 bbl/d. We are confident that the industry will<br />
proceed with the necessary incremental pipeline export capacity on<br />
a timely basis to support the expected incremental production out<br />
of the WCSB and specifically from the oil sands projects.<br />
<strong>Canadian</strong> <strong>Natural</strong> continues to work with North American refiners<br />
to encourage the addition of conversion capacity to their facilities<br />
and has committed a volume of 25,000 bbl/d for 5 years to a<br />
proposed upgrading facility to be built in Sturgeon County, Alberta<br />
by 2010. With respect to efforts to build an upgrader for our insitu<br />
operations, engineering studies completed in early 2007<br />
identified growing concerns relating to increased environmental<br />
Mayan - LLB spread (US$/bbl)<br />
20<br />
15<br />
10<br />
5<br />
0<br />
(5)<br />
Jan Feb Mar Apr May Jun Jul Aug Sep Oct Nov Dec
<strong>Canadian</strong> <strong>Natural</strong> AR2006<br />
Page 16 of 107<br />
Marketing (continued)<br />
costs for upgraders built in Canada, inflationary capital cost<br />
pressures and narrowing heavy oil differentials in North America,<br />
and as a result deferred ongoing design work pending clarification<br />
on the cost of future environmental legislation and a more stable<br />
cost environment.<br />
<strong>Canadian</strong> <strong>Natural</strong>’s portfolio for 2007 is targeted to average<br />
between 315,000 bbl/d and 360,000 bbl/d and based on the<br />
current 2007 pricing strips for WTI at US$60.38/bbl would yield an<br />
overall wellhead price of C$50.67/bbl.<br />
Price Risk Management<br />
<strong>Canadian</strong> <strong>Natural</strong> utilizes hedging techniques to provide some<br />
assurance on price realizations and to protect cash flow generation<br />
capability in order to fund ongoing development programs.<br />
Generally, the downside pricing risks associated with various<br />
commodities are determined and, if deemed appropriate, financial<br />
derivatives are used to limit risk. Currency exposures are also<br />
monitored and may be hedged in conjunction with commodities.<br />
In conjunction with approval of the Horizon Project, our Board of<br />
Directors granted management the authority to hedge up to 75%<br />
of any commodity’s expected production volumes for a forward<br />
12-month period, up to 50% of the second 12-month period<br />
and up to 25% for the following 24-month period. For further<br />
information on the particulars of this hedge program please refer<br />
to Management’s Discussion and Analysis and the Consolidated<br />
Financial Statements.<br />
Canada/US average exchange rate (US$ in equivalent C$)<br />
06<br />
05<br />
04<br />
03<br />
02<br />
Company average natural gas selling price (C$/mcf)<br />
06<br />
05<br />
04<br />
03<br />
02<br />
1.13<br />
1.21<br />
1.30<br />
1.40<br />
1.57<br />
6.72<br />
8.57<br />
6.50<br />
6.21<br />
3.77<br />
Midstream<br />
Our midstream assets consist of the 100% owned and operated<br />
ECHO Pipeline, the 15% interest in the Cold Lake Pipeline system,<br />
the 62% interest in the operated Pelican Lake Pipeline and the<br />
50% interest in the 84 megawatt co-generation unit located at<br />
our Primrose facility. The midstream assets allow us to control and<br />
optimize transportation costs for about 80% of our heavy crude<br />
oil production and generate additional revenues from third party<br />
volumes and the sale of surplus electricity. Echo is the only pipeline<br />
delivering undiluted raw bitumen to the Hardisty terminals and plays<br />
an important role in our heavy crude oil blending and marketing<br />
strategy for WCS and other diluted bitumen blends. In 2006, we<br />
completed the Morgan lateral at a cost of $6 million which helped<br />
in achieving 89% utilization rate on our ECHO Pipeline.<br />
Company average crude oil and NGLs selling price (C$/bbl)<br />
06<br />
05<br />
04<br />
03<br />
02<br />
53.65<br />
46.86<br />
37.99<br />
32.66<br />
31.22
Review of Operations: Health and Safety, Environment and Community<br />
Page 17 of 107<br />
Health and Safety,<br />
Environment and Community<br />
A commitment to “doing it right”<br />
At <strong>Canadian</strong> <strong>Natural</strong>, our people and our contractors have a<br />
vision for health and safety, environment and community. We<br />
are committed to responsible operations, and to “doing it right”.<br />
We have systems in place and have set targets for continuous<br />
improvement and measure our performance on an ongoing basis.<br />
As we enhance our health and safety, environment and community<br />
programs, we also work to meet the expectations our stakeholders<br />
and communities have around corporate citizenship.<br />
Health and Safety: working for<br />
continuous improvement<br />
We conduct our operations in a manner that protects the health and<br />
safety of employees, contractors, the public and the environment.<br />
Our ongoing focus on safety programs and processes, enhanced<br />
safety awareness throughout our operations, and the high degree of<br />
co-operation with our contractors is essential to achieve continuous<br />
improvement.<br />
In 2005 we obtained our Certificate of Recognition (“COR”)<br />
through Enform which is a certifying partner of Alberta Workplace<br />
Health and Safety and the Workers’ Compensation Board of British<br />
Columbia. As part of our COR maintenance program in 2006,<br />
we continued our internal audit program, conducting more than<br />
500 facility, drilling and service rig, pipeline and construction<br />
project audits.<br />
In 2006 our conventional operations team updated its Comprehensive<br />
Safety Manual and Employee Guide to Accident Prevention, and<br />
re-emphasized the role each person plays in ensuring a safe work<br />
environment. In our North American conventional operations, total<br />
lost time accident frequency and total recordable injury frequency<br />
declined in 2006, continuing a downward trend over the past<br />
four years.<br />
As part of a pilot program conducted by the Alberta Energy<br />
and Utilities Board (“EUB”), <strong>Canadian</strong> <strong>Natural</strong> was selected to<br />
undergo a comprehensive assessment of our emergency response<br />
capabilities in 2006. A rigorous process was used by the EUB to test<br />
our emergency response plans and our ability to activate our plans.<br />
The results of the assessment identified no major deficiencies and<br />
demonstrated our strong response capability.<br />
Internationally, we continued to develop and implement our<br />
enhanced Safety Health Environment Management System<br />
(“SHEMS”). Lost time injuries dropped by more than 20% from<br />
2005. The total recordable injury frequency rates also improved by<br />
18% compared to 2005 results.<br />
As activities accelerate at our Horizon Project, overall safety<br />
performance, as measured by our total recordable injury frequency<br />
has improved throughout 2006, building on excellent performance<br />
in 2005. Incident exposure hours increased in 2006 to 5.8 million<br />
as compared to 3 million in 2005. Our new near-miss incident<br />
campaign has contributed to continuous improvement. The Horizon<br />
Project also conducted construction safety field audits for major<br />
contractors on-site, developed plans for 2007 audits, and launched<br />
a fully functional Emergency Operations Centre. As we progress<br />
towards commissioning in 2008, work continues on our safety<br />
training programs and processes for employees and contractors,<br />
and the integration of our emergency response plans with those of<br />
the local municipal district.
<strong>Canadian</strong> <strong>Natural</strong> AR2006<br />
Page 18 of 107<br />
Health and Safety,<br />
Environment and Community<br />
(continued)<br />
Integrity: working together<br />
for best practices<br />
In 2006, each of our divisions worked together to identify common<br />
key performance indicators and best management practices that<br />
solidify our commitment to integrity. All three divisions have<br />
developed strong integrity groups and have brought together<br />
standard benchmarks used to track quality.<br />
Environment: focus on stewardship<br />
<strong>Canadian</strong> <strong>Natural</strong>’s environment group continues to work<br />
together with management and operating personnel to ensure<br />
that environmental stewardship is factored into all aspects of our<br />
operations. Training and due diligence are key to our environmental<br />
management programs, and we continue to increase our investment<br />
into environmental management strategies such as air emission<br />
management, reduction of fresh water use and minimization of<br />
our landscape footprint.<br />
In our conventional operations and at our Horizon Project site,<br />
initial development of our enhanced Environmental Management<br />
System (“EMS”) was undertaken in 2006. The primary focus of the<br />
EMS is to ensure our field operations minimize their environmental<br />
impact and meet all regulatory requirements and corporate<br />
standards. EMS awareness training was developed and delivered<br />
to employees. Training will continue into 2007 to ensure our high<br />
level of environmental, stakeholder and sustainability performance<br />
is maintained.<br />
With plans for operational start-up only two years away, the<br />
Horizon Project implemented several programs in 2006, including:<br />
environmental monitoring programs for soils, fisheries and water<br />
quality; a weekly environmental inspection program of construction<br />
sites; and, a wildlife management procedure. Development of<br />
other programs continue, including an environmental records<br />
management system, as well as commissioning and start-up<br />
monitoring programs.<br />
Work is ongoing to continue to reduce our long-term fresh water<br />
use, including increasing use of brackish saline water for our insitu<br />
operations, and recycling a high percentage of produced<br />
water. In <strong>Canadian</strong> <strong>Natural</strong>’s thermal operations, our water recycle<br />
rate is greater than 95%. Increased brackish saline water use at<br />
our Primrose and Wolf Lake operations over the past two years<br />
has enabled increased bitumen production without an equivalent<br />
increase in fresh water use.<br />
<strong>Canadian</strong> <strong>Natural</strong> is committed to managing air emissions through<br />
an integrated corporate approach which considers opportunities to<br />
reduce both air pollutants and greenhouse gas (“GHG”) emissions.<br />
Air quality programs continue to be an essential part of our<br />
environmental work plan and are operated within all regulatory<br />
standards and guidelines. Our strategy for managing GHG<br />
emissions is based on four core principles: energy conservation and<br />
efficiency; reduced intensity; innovative technology and associated<br />
research and development; and, emissions trading capacity; both<br />
domestically and globally.<br />
We continue to implement flaring, venting and fuel and solution<br />
gas conservation programs. In 2006 we completed approximately<br />
122 gas conservation projects, resulting in the reduction of<br />
1.24 million tonnes/year of carbon dioxide equivalents (“CO 2 E”).<br />
Over the past five years we have spent over $100 million to conserve<br />
the equivalent of over 5 million tonnes of CO 2 E. In our heavy crude<br />
oil production areas we are evaluating tank heater efficiencies in<br />
an effort to conserve fuel gas at facilities with field tanks. We also<br />
Solution gas conservation rate (%)<br />
90<br />
80<br />
70<br />
60<br />
2000 2001 2002 2003 2004 2005 2006
Review of Operations: Health and Safety, Environment and Community<br />
Page 19 of 107<br />
monitor the performance of our compressor fleet and it is continually<br />
modified and optimized for maximum efficiency. Another project of<br />
note is the trial of “no-emissions” chemical injection pumps which<br />
will eliminate fuel gas venting.<br />
These aggressive programs also influence and direct our plans for<br />
new projects and facilities. The Horizon Project will incorporate<br />
numerous advancements in technology which will result in<br />
the reduction of GHG emissions. The key to GHG reductions at<br />
Horizon is a focus on maximizing heat integration, the use of<br />
cogeneration to meet steam and electricity demands and the<br />
design of the hydrogen production facility to enable carbon dioxide<br />
(“CO 2 ”) capture.<br />
At our North Sea operations, we are operating below our CO 2<br />
allocation, and we continue to implement an improvement program<br />
based on efficiency audits of our major facilities. We also began a<br />
Produced Water Re-Injection trial on one of our offshore platforms,<br />
successfully re-injecting about 30,000 barrels of produced water<br />
each day.<br />
Community: developing people<br />
to work together<br />
<strong>Canadian</strong> <strong>Natural</strong> is committed to a long-term presence in the<br />
communities where we operate. We are proud to work with<br />
our communities to provide financial and volunteer support<br />
for hundreds of projects that meet their vision for the future,<br />
contribute to the development of people, and to the building of<br />
strong communities.<br />
In 2006, we met with stakeholders on a regular basis to update<br />
them on our operations and our commitments, to build trust<br />
and mutual respect, and to incorporate feedback into operations<br />
developments. In North America, we work closely with over<br />
50 Métis and First Nations communities near our operations to<br />
strengthen mutual understanding and co-operation and enhance<br />
the opportunities for economic participation in our developments.<br />
To help fulfill our mission statement “to develop people” and<br />
build capacity in communities where we operate, we launched our<br />
Building Futures Scholarship Program in 2002 to encourage training<br />
in our industry. To further expand the pool of skilled workers within<br />
Canada, we are developing an on-site apprenticeship training<br />
centre at our Horizon Project and have actively participated in many<br />
career fairs and contractor meetings throughout North America.<br />
A range of multi-stakeholder groups are working to proactively<br />
address the needs and interests of the communities we operate<br />
in, and to ensure a sustainable energy industry. Recognizing the<br />
importance of these groups in achieving collaborative goals identified<br />
among industry, governments and communities, <strong>Canadian</strong> <strong>Natural</strong><br />
continues to play an active role in many such initiatives where we<br />
do business.<br />
Highlights of our community investments in 2006 involved a wide<br />
range of projects such as the new community arena in Cold Lake,<br />
Lakeland College’s Heavy crude oil Operations Technician academic<br />
wing in Lloydminster, new medical equipment for the Grande Prairie<br />
hospital, a new training centre in northeastern BC, and support for<br />
the Northern Lights Regional Health Foundation in Fort McMurray.<br />
In our International operations, we continued funding for a variety<br />
of community initiatives such as the Aberdeen Football Youth<br />
Academy, Childline Scotland and the Castle Hill Oncology Heath<br />
Centre. <strong>Canadian</strong> <strong>Natural</strong>’s community sponsorship and donations<br />
funding support totaled more than $4.4 million in 2006.
<strong>Canadian</strong> <strong>Natural</strong> AR2006<br />
Page 20 of 107<br />
The Assets<br />
LYLE G. STEVENS,<br />
SENIOR VICE-PRESIDENT,<br />
EXPLOITATION<br />
Defi ned <strong>Strategy</strong> to Exploit a<br />
World-Class Asset Portfolio<br />
Low risk exploitation drives the development of our vast resource<br />
base. It has proven to be successful through the business cycle as<br />
a result of minimizing exploration risks, maintaining low operating<br />
costs and reducing capital costs. This disciplined approach is applied<br />
rigorously throughout our worldwide operations, and features:<br />
� Maintaining a large inventory of undeveloped land in each core<br />
region facilitating the continual high-grading of prospects and<br />
optimizing drilling programs;<br />
� Dominating the land base and controlling the infrastructure<br />
in regions wherever we operate. Maintaining high working<br />
interests and operating the vast majority of the assets allows us<br />
to steward to our development plans and control costs;<br />
� Progressively developing lands as extensions to existing<br />
infrastructure, thereby minimizing infrastructure costs and<br />
maximizing existing facility utilization;<br />
� Maximizing resource recovery through the application of proper<br />
production practices and tertiary recovery techniques;<br />
� Pursuing opportunistic acquisitions that provide future growth<br />
opportunities and complement our expertise and existing assets.<br />
JEFF W. WILSON,<br />
SENIOR VICE-PRESIDENT,<br />
EXPLORATION
Review of Operations: The Assets<br />
Page 21 of 107<br />
North America<br />
2006 net results, after royalties<br />
Production Proved reserves<br />
(mboe/d) (mmboe)<br />
Crude oil and NGLs 205 887<br />
<strong>Natural</strong> gas 198 618<br />
Boe 403 1,505<br />
% of total 80 77<br />
International<br />
2006 net results, after royalties<br />
Production Proved reserves<br />
(mboe/d) (mmboe)<br />
Crude oil and NGLs 95 429<br />
<strong>Natural</strong> gas 4 15<br />
Boe 99 444<br />
% of total 20 23<br />
Horizon Project Mining<br />
2006 proved reserves<br />
Gross lease Net<br />
(mmbbl) (mmbbl)<br />
Bitumen 2,275 1,853<br />
SCO* 1,866 1,596<br />
* SCO reserves are based upon upgrading of the bitumen reserves.<br />
The reserves shown for bitumen and SCO are not additive.
<strong>Canadian</strong> <strong>Natural</strong> AR2006<br />
Page 22 of 107<br />
North American <strong>Natural</strong> Gas<br />
North American natural gas remained <strong>Canadian</strong> <strong>Natural</strong>’s single<br />
largest product, representing 42% of our equivalent production<br />
volumes. We are the second largest producer of natural gas in<br />
Canada with production of 1,468 mmcf/d in 2006. During 2006,<br />
average production volumes increased by 52 mmcf/d or 4%,<br />
reflecting our measured drilling and development program and the<br />
acquisition of ACC in the fourth quarter.<br />
Production is concentrated in five North American core regions:<br />
Northeast British Columbia, Northwest Alberta, the Foothills, the<br />
Northern Plains and the Southern Plains. The large inventory of<br />
opportunities that our focused area teams have developed and<br />
defined are expected to deliver 3-5% per annum production<br />
growth. On our existing land base we see the potential for more than<br />
7,000 locations.<br />
North American successful natural gas wells drilled<br />
(net wells)<br />
06<br />
05<br />
04<br />
03<br />
02<br />
641<br />
890<br />
689<br />
777<br />
162<br />
Northeast British Columbia<br />
THE ASSET<br />
Northeast British Columbia is one of the most highly prospective<br />
and relatively undeveloped regions in Western Canada. <strong>Canadian</strong><br />
<strong>Natural</strong>’s large undeveloped land base, 2.7 million acres, in<br />
conjunction with facility and pipeline infrastructure provides a<br />
significant competitive advantage. In this region natural gas is<br />
produced from an array of carbonate and sandstone reservoirs<br />
ranging from the shallow Notikewin at 2,000 ft to the deep Slave<br />
Point at 15,000 ft. The region has a mixture of low risk multizone<br />
targets, deep higher risk exploration plays and emerging<br />
unconventional natural gas plays including shale gas and Coal Bed<br />
Methane (“CBM”).<br />
2006 ACTIVITY<br />
The Company drilled 193 net wells with an 90% success rate adding<br />
incremental production of 20 mmcf/d. At Helmet we continued<br />
development of the Jean Marie carbonate formation drilling<br />
21 net horizontal wells and 12 vertical wells. Our larger programs<br />
included drilling 38 shallow Notikewin wells at Ladyfern and drilling<br />
26 wells at Shekelie targeting the Banff formation.<br />
WHAT TO EXPECT IN 2007 AND BEYOND<br />
The drilling program in Northeast British Columbia is reduced in<br />
2007 with only 56 wells planned as a result of an overheated<br />
service industry and a stronger focus on development of our crude<br />
oil assets. Post 2007, should cost pressures reduce, drilling activity<br />
is forecast to increase significantly to more than 200 wells per year,<br />
as we expand our defined prospect inventory and maximize the<br />
potential on the acquired ACC assets. We will continue to evaluate<br />
the emerging shale gas plays in the Muskwa and Wilrich shales and<br />
we are also looking to extend the promising Doig shale gas play<br />
from Northwest Alberta into Northeast British Columbia.<br />
North American natural gas production, before royalties<br />
(mmcf/d)<br />
06<br />
05<br />
04<br />
03<br />
02<br />
1,468<br />
1,416<br />
1,330<br />
1,245<br />
1,204
Review of Operations: North American <strong>Natural</strong> Gas<br />
Page 23 of 107<br />
Northwest Alberta<br />
THE ASSET<br />
Northwest Alberta is a rich multi-zone crude oil and natural gas<br />
producing region. There are extensive exploitation opportunities as<br />
well as significant growth potential in unconventional natural gas<br />
from shale and tight sand. <strong>Canadian</strong> <strong>Natural</strong>’s large undeveloped<br />
land base of 1.8 million net acres in conjunction with 26 operated<br />
facilities and an extensive pipeline network provides a significant<br />
competitive advantage.<br />
2006 ACTIVITY<br />
The Company drilled a total of 175 net natural gas wells, a 9 net<br />
well increase from 2005. We continued our low risk Cardium<br />
sand development, drilling 57 net wells with a 96% success rate.<br />
<strong>Canadian</strong> <strong>Natural</strong> has leveraged the Cardium project and our<br />
extensive infrastructure to develop the deeper, tight natural gas<br />
sands that exists in the region. In 2006 we drilled 28 deep wells for<br />
Mannville tight sand targets.<br />
In the Peace River Arch region, the Company drilled 4 initial<br />
wells targeting Doig shale and also incorporated the ACC land<br />
to greatly expand <strong>Canadian</strong> <strong>Natural</strong>’s exposure on this emerging<br />
unconventional play.<br />
WHAT TO EXPECT IN 2007 AND BEYOND<br />
The 2007 drilling program has been high graded to 118 net<br />
wells that are focused on Cardium, Deep gas, Doig and other<br />
conventional targets. These projects can support the drilling of over<br />
1,100 locations in the next five years. Significant unconventional<br />
resource potential can be developed as a result of technology<br />
innovation, cost control, continued downspacing and ACC’s<br />
substantial undeveloped land base.<br />
Northern and Southern Plains<br />
THE ASSET<br />
<strong>Natural</strong> gas in the Northern and Southern Plains core regions<br />
is produced from shallow, low risk, multi-zone conventional<br />
exploitation prospects and in some regions natural gas is produced<br />
from the Horseshoe Canyon coals. This is generally considered a<br />
mature operating region. However, through ongoing focused<br />
exploitation we continue to find excellent prospects for new pool<br />
development, infill drilling and secondary zone recompletions. The<br />
success of CBM production from the Horseshoe Canyon coals has<br />
created a new economic low risk development opportunity which<br />
<strong>Canadian</strong> <strong>Natural</strong> continues to expand and the Mannville coals in<br />
the region represent new potential which we are now evaluating.<br />
This new development augments our significant shallow gas assets<br />
which contribute approximately 30 mmcf/d of the area production<br />
and provide the majority of the drilling inventory.<br />
Our strategy in this region is to target low risk exploration<br />
and development opportunities on our extensive land base,<br />
examine synergistic property acquisitions opportunities, and<br />
minimize operating costs through high utilization of facilities and<br />
operations discipline.
<strong>Canadian</strong> <strong>Natural</strong> AR2006<br />
Page 24 of 107<br />
North American <strong>Natural</strong> Gas (continued)<br />
2006 ACTIVITY<br />
During 2006, 375 net wells targeting natural gas were drilled in<br />
the region with an 86% success rate. CBM development drilling<br />
continued to grow with the drilling of 48 net wells targeting the<br />
Horseshoe Canyon and we have also initiated a pilot project with<br />
three horizontal wells in Swan Hills to determine the economic<br />
potential of CBM production from the Mannville formation.<br />
A modest shallow gas drilling program was pursued in 2006 with<br />
67 net wells drilled.<br />
WHAT TO EXPECT IN 2007 AND BEYOND<br />
The 2007 drilling program is comprised of more than 240<br />
net wells, targeting low risk, shallow natural gas. CBM and<br />
conventional wells are planned as the Company continues<br />
to expand both its expertise and its commercial CBM<br />
operations. Our five year drilling inventory totals more than<br />
3,620 net natural gas wells, including over 1,750 shallow locations<br />
and over 575 net CBM wells. With the addition of new shallow gas<br />
prospects through the ACC acquisition and continued Horseshoe<br />
Canyon CBM development we are forecasting modest production<br />
growth in the Northern and Southern Plains over the next<br />
five years.<br />
Foothills<br />
THE ASSET<br />
<strong>Canadian</strong> <strong>Natural</strong> has both developed and significant undeveloped<br />
assets located in the Southern Foothills of Northeast British Columbia<br />
and in the North Central Foothills of Alberta. Gas production occurs<br />
in thrusted, structurally deformed Mississippian and Triassic aged<br />
reservoirs. Potential for high impact discoveries exists on most of<br />
our extensive land base.<br />
2006 ACTIVITY<br />
<strong>Canadian</strong> <strong>Natural</strong> Foothill’s drilling program had exceptional results<br />
in 2006, drilling 4.7 net wells with a 100% success rate. Three new<br />
pool discoveries were made in the Murray River area and successful<br />
development wells were drilled at Copton, Dinosaur, Ojay and Cabin<br />
Creek. First production came on stream at our Copton and Dinosour<br />
properties from discoveries made in previous years. The ACC<br />
acquisition resulted in a significant growth of our Foothill assets,<br />
adding production and undeveloped lands in the very prospective<br />
regions of Monkman, Ojay, Sullivan Creek and Voyager.<br />
WHAT TO EXPECT IN 2007 AND BEYOND<br />
The 2007 drilling program includes seven net natural gas wells on<br />
<strong>Canadian</strong> <strong>Natural</strong>’s core properties at Murray, Copton and Cabin.<br />
Ongoing exploration effort and extensive new 3D seismic combined<br />
with the ACC assets have resulted in a high quality drilling inventory<br />
that will access significant resource potential on the Company’s<br />
366,000 acres of undeveloped lands. Drilling activity levels will<br />
grow to more than 10 wells per year after 2007 and we have an<br />
achievable plan to grow volumes by an average of 11% over the<br />
five year plan.
Review of Operations: North American <strong>Natural</strong> Gas<br />
Page 25 of 107<br />
NORTHEAST BC<br />
Extensive holdings at Adsett expands<br />
Slave Point potential. Caribou region<br />
provides multi-zone opportunities and<br />
access to Key river crossing. Ft. St. John<br />
Region expands regional operations and<br />
provides access to gas plant.<br />
FOOTHILLS, BC-AB<br />
Enhances long-term<br />
growth strategy in<br />
deep part of the basin.<br />
CASE STUDY<br />
Acquisition of ACC Assets<br />
The acquisition of ACC blended well with existing lands and infrastructure,<br />
providing signifi cant upside to an already deep portfolio. The upside potential<br />
is signifi cant – both in terms of optimization of existing operations but leveraging<br />
the expertise of both organizations. Adding 1.5 million acres of undeveloped land<br />
provides years of new drilling inventory. The addition of 2,800 miles of pipeline<br />
and access to seven major natural gas facilities greatly enhances value. The synergies<br />
of the two asset bases are expected to create value for shareholders for years<br />
to come.<br />
<strong>Canadian</strong> <strong>Natural</strong> Land<br />
Acquired Land<br />
BC AB<br />
PEACE RIVER, AB<br />
Adds to signifi cant land position<br />
in emerging shale gas play.<br />
Extensive infrastructure and<br />
ownership sour gas plant.<br />
SK MB<br />
TABER, AB<br />
Primarily light oil<br />
with CO 2 fl ood upside.<br />
WILD RIVER, AB<br />
One of the most prospective<br />
regions in the WCSB. Multi-zone<br />
plays with high working interest.<br />
TWO HILLS, AB<br />
Primarily royalty interests.<br />
RIMBEY, AB<br />
Multi-zone production with lowrisk<br />
in-fi ll drilling potential.<br />
HATTON, AB-SK<br />
Low decline, long-life, low-royalty shallow gas<br />
with signifi cant down-spacing opportunities.
<strong>Canadian</strong> <strong>Natural</strong> AR2006<br />
Page 26 of 107<br />
North American <strong>Natural</strong> Gas (continued)<br />
CASE STUDY<br />
<strong>Natural</strong> Gas Resource Potential<br />
We believe that our natural gas portfolio contains<br />
resource potential well beyond the 5.9 tcf of Company<br />
gross proved and probable reserves currently recognized<br />
by our independent reserves engineers.<br />
CONVENTIONAL OPERATIONS<br />
These represent the traditional low-risk exploitation assets<br />
upon which we have built an extensive infrastructure.<br />
They extend across each of our core regions and generate<br />
excellent returns, albeit at a generally shorter reserve life.<br />
EXPLORATION<br />
These activities are characterized as high-risk/high-reward.<br />
An extreme example of this was the Ladyfern Slave Point<br />
field which went on record as one of the most prolific<br />
fields in WCSB history during 2001-2004. In addition to<br />
ongoing Slave Point exploration, we have greatly ramped<br />
our Foothills expertise over the past few years and have<br />
experienced positive results as a result.<br />
RESOURCE PLAYS<br />
These larger scale plays are generally of low to moderate risk<br />
and of a longer resource life. As techniques are optimized<br />
they become very repeatable and can offer excellent returns.<br />
Examples of these types of plays are the Helmet, shallow<br />
gas, Cardium and Horseshoe Canyon CBM.<br />
UNCONVENTIONAL<br />
Characterized as massive opportunities where technology<br />
and better geological understanding will unlock vast<br />
potential over time. Examples of this include Mannville CBM<br />
and various shale gas opportunities, including the Doig,<br />
Wilrich and Muskwa currently identified by us.<br />
Conventional operations<br />
Exploration<br />
Resource plays<br />
Unconventional
Review of Operations: North American Crude Oil and NGLs<br />
Page 27 of 107<br />
North American Crude Oil and NGLs<br />
<strong>Canadian</strong> <strong>Natural</strong> is the largest producer of crude oil and NGLs<br />
in western Canada; our production is a blend of light and heavy<br />
crude oils augmented by NGLs which are produced in conjunction<br />
with natural gas. In 2006 average production volumes increased by<br />
6%, reflecting another successful year of drilling and development<br />
programs. The depth of our asset base and the importance of our<br />
balanced product mix were revealed in mid 2006 when we refocused<br />
our drilling and development activity from natural gas to crude oil<br />
as a result of commodity prices. Our crude oil development strategy<br />
is based on low risk exploitation combined with our expertise in<br />
recovery techniques. This allows us to maximize crude oil recovery<br />
from both mature and new crude oil pools.<br />
Light Crude Oil and NGLs<br />
THE ASSET<br />
We produce light crude oil and NGLs in all of the Company’s western<br />
<strong>Canadian</strong> core regions. In North America, our light crude oil assets<br />
are largely developed however we continue to grow light crude<br />
oil production through a strategy of waterflood implementation<br />
and optimization, development drilling, new pool discoveries<br />
and acquisitions. The vast majority of the Company’s light pools<br />
are produced under waterflood resulting in high recovery factors<br />
and low production decline rates. We are also evaluating and field<br />
testing the application of EOR technologies on several pools to<br />
further improve crude oil recovery.<br />
2006 ACTIVITY<br />
In 2006, <strong>Canadian</strong> <strong>Natural</strong>’s light crude oil drilling and development<br />
programs pursued four initiatives:<br />
� � Low risk, infill and step-out drilling in crude oil pools located<br />
in the Northern Plains, Northwest Alberta, Northeast British<br />
Columbia and the Southeast Saskatchewan core regions;<br />
North American successful crude oil wells drilled (net wells)<br />
06<br />
05<br />
04<br />
03<br />
02<br />
591<br />
612<br />
317<br />
446<br />
256<br />
� � Waterflood optimization programs in all our core regions.<br />
Our strong technical team, dedicated solely to waterflood<br />
optimization, continues to improve our waterflood<br />
performance through detailed reservoir characterization and<br />
analysis of production data;<br />
� � Continued pilot testing of polymer flooding to improve crude<br />
oil recovery in a mature waterflood; and<br />
� � Continuing pilot testing of a CO 2 flood on the Enchant pool in<br />
the Southern Plains.<br />
WHAT TO EXPECT IN 2007 AND BEYOND<br />
For 2007, <strong>Canadian</strong> <strong>Natural</strong> will continue to focus on waterflood<br />
and tertiary recovery opportunities. More than 100 net wells are<br />
planned for our 2007 light crude oil drilling program.<br />
<strong>Canadian</strong> <strong>Natural</strong> will focus on waterflood enhancements to<br />
add incremental light crude oil reserves. We estimate that just a<br />
1% improvement in recovery factor could yield an incremental<br />
42 million barrels of reserves. In addition to the enhanced crude<br />
oil recovery initiatives our defined plan includes over 400 new well<br />
locations to be drilled over the next five years.<br />
North American crude oil and NGLs production (mbbl/d)<br />
06<br />
05<br />
04<br />
03<br />
02<br />
235<br />
222<br />
206<br />
175<br />
169
<strong>Canadian</strong> <strong>Natural</strong> AR2006<br />
Page 28 of 107<br />
North American Crude Oil and NGLs<br />
(continued)<br />
Pelican Lake Crude Oil<br />
THE ASSET<br />
This massive, shallow crude oil pool in our Northern Plains core<br />
region is estimated to contain up to four billion barrels of OOIP and<br />
continues to provide excellent opportunities for production and<br />
reserves growth. The Pelican Lake pool now accounts for 8% of the<br />
Company’s total proved reserves. We developed this pool exclusively<br />
with horizontal wells to minimize the environmental impact, reduce<br />
development costs and provide greater well productivity. We<br />
own and operate three centralized treating facilities in the area.<br />
Although priced similarly to heavy crude oil, our Pelican Lake crude<br />
oil production yields netbacks typical of medium crude oil due to<br />
our ability to maintain low operating costs.<br />
2006 ACTIVITY<br />
At Pelican Lake, 2006 proved to be very successful year:<br />
� � We continued to extend the developable area of the existing<br />
pool and drilled 73 net primary producing horizontal wells;<br />
� � 14 net stratigraphic wells were drilled to identify further pool<br />
extensions and other new pools in the area;<br />
� � We continued to expand the commercial waterflood project<br />
and have now converted 12% of our field to waterflood.<br />
A total of 28.5 sections are under waterflood with 87 net<br />
production wells and 82 net injection wells;<br />
� � The five well polymer flood pilot test that was initiated in 2005<br />
has responded extremely well with production increasing from<br />
50 bbl/d in May 2005 to over 600 bbl/d by December 2006.<br />
These results have lead to the commercial expansion of this<br />
EOR technology with 36 additional wells undergoing polymer<br />
flood by the end of 2006;<br />
� � Additional producing and undeveloped assets were<br />
acquired north of Pelican Lake that have promising<br />
growth potential.<br />
Production in 2006 averaged 30,000 bbl/d, a 30% increase from<br />
2005 levels, as a result of waterflood and polymer flood success<br />
and the continued drilling of primary wells. By the end of 2006<br />
the Pelican Lake pool had approximately 100 million barrels from<br />
<strong>Canadian</strong> <strong>Natural</strong> lands.<br />
WHAT TO EXPECT IN 2007 AND BEYOND<br />
The 2007 program will see <strong>Canadian</strong> <strong>Natural</strong> drilling 64 net horizontal<br />
wells for primary production and five additional net stratigraphic<br />
wells to delineate pool extensions. The continued development<br />
of the Pelican Lake waterflood and polymer enhanced waterflood<br />
are the priority in 2007 and we plan to convert an additional 17.5<br />
sections to polymer flood and 6.8 sections to waterflood. This will<br />
entail drilling 68 net horizontal infill production wells and converting<br />
61 net producing wells into 39 polymer and 22 water injection wells.<br />
Recovery factors under primary production are approximately 5%<br />
of the OOIP and we are conservatively forecasting the recoveries<br />
could reach 17.5% through polymer flooding. The polymer<br />
flooding process is likely suitable for approximately half of the field<br />
which could yield significant incremental recovery at Pelican Lake.<br />
Primary Heavy Crude Oil<br />
THE ASSET<br />
<strong>Canadian</strong> <strong>Natural</strong>’s historic growth in primary heavy oil production<br />
has been achieved through drilling and through opportunistic<br />
acquisitions. Heavy oil is produced from repeatable, shallow, low<br />
risk, multi-zone wells. This leads to low finding and development<br />
costs, exceptional drilling success rates and many secondary zone<br />
recompletion opportunities. The region is also natural gas prone<br />
and development drilling can lead to both natural gas and heavy<br />
oil discoveries. With over 1.6 million acres of undeveloped land<br />
and 200,000 acres of developed land, we dominate production<br />
and operations within the Bonnyville/Lloydminster primary<br />
producing area of our Northern Plains core region. This dominance<br />
allows us to minimize capital by conducting large scale drilling<br />
and development programs. We also minimize and control our<br />
production costs through owning and operating central treating<br />
facilities, maximizing their utilization and using our size to achieve<br />
economies of scale. Ownership of the ECHO crude oil sales pipeline<br />
reduces our transportation costs and allows us to be the only<br />
producer capable of delivering undiluted heavy oil into our blending<br />
facilities at Hardisty, Alberta.<br />
2006 ACTIVITY<br />
During 2006 we drilled 292 heavy oil net wells and recompleted<br />
approximately 500 wells to secondary zones. In 2006 record netbacks<br />
were achieved for our heavy oil production as a result of high prices,<br />
our low operating costs and our low finding and development costs.
Review of Operations: North American Crude Oil and NGLs<br />
Page 29 of 107<br />
To further improve the recovery factors for crude oil we commenced<br />
planning for a 2007 EOR pilot project that will test the viability of a<br />
recovery process using hydrocarbon vapor.<br />
WHAT TO EXPECT IN 2007 AND BEYOND<br />
For 2007, 369 heavy oil locations are forecast to be drilled and a<br />
further 470 net wells will be recompleted. Our defined growth plan<br />
forecasts that over 1,550 net well locations will be drilled during the<br />
next five years, keeping production relatively flat. We will continue<br />
to pursue the development of applicable technologies to further<br />
improve crude oil recovery and are currently conducting research<br />
both in the field and in the laboratory. We estimate our developed<br />
primary heavy oil lands to contain 7 billion to 10 billion barrels of<br />
OOIP; a modest 1% increase in recovery would equate to over<br />
70 million barrels of incremental recoverable crude oil.<br />
Thermal (In-Situ) Heavy Crude Oil<br />
THE ASSET<br />
<strong>Canadian</strong> <strong>Natural</strong> is the second largest producer of thermal in-situ<br />
heavy crude oil in Canada and we also have has some of the best<br />
undeveloped thermal oil sands leases in Canada. Our thermal oil<br />
production is focused on the Primrose Cyclic Steam Stimulation<br />
(“CSS”) project in the Cold Lake region and the Tangleflags thermal<br />
project in Saskatchewan. We also have further development potential<br />
at Cold Lake with the 40,000 bbl/d Primrose East expansion project<br />
that is currently under development. In all, we have more than<br />
400,000 undeveloped acres of land suitable for thermal recovery<br />
processes. These assets provide the basis for the long-term growth<br />
of thermal oil production for the Company. Our technical expertise,<br />
our asset base and years of experience operating and constructing<br />
thermal projects has placed <strong>Canadian</strong> <strong>Natural</strong> as an industry leader<br />
in thermal in-situ oil recovery.<br />
2006 ACTIVITY<br />
In 2006 <strong>Canadian</strong> <strong>Natural</strong>’s multi-year thermal development<br />
program took its first significant step with the first production from<br />
our Primrose North expansion project. As forecasted, production<br />
from the expansion project reached peak stabilized production<br />
production of 30,000 bbl/d in 2006, only 7 months after start-up<br />
in November, 2006. This project will be first of many as we are<br />
targeting to bring on a new thermal project every 2-3 years for<br />
the foreseeable future. As a result of the Primrose North expansion<br />
and the continued development and optimization at our Primrose<br />
South project our thermal crude oil production reached a record<br />
64,000 bbl/d, or a 21% increase from 2005.<br />
WHAT TO EXPECT IN 2007 AND BEYOND<br />
In 2007, we plan to drill an additional 58 net horizontal wells at<br />
Primrose as part of the ongoing project. As part of our long-term<br />
thermal project expansion plans we will also drill more than 130<br />
net stratigraphic wells to further define our leases at Primrose East,<br />
Kirby, Grouse, Birch Mountain and Gregoire Lake. Drilling and<br />
facility construction will start at our Primrose East expansion project<br />
where first production is targeted for 2009.<br />
Beyond 2009 we see the potential to add significant incremental<br />
thermal in-situ production from our Oil Sands leases at Kirby,<br />
Grouse, Birch Mountain, and Gregoire Lake. We continue to push<br />
the development of new technologies including geo-steering during<br />
drilling, infill drilling and steam additives to enhance recoveries.
<strong>Canadian</strong> <strong>Natural</strong> AR2006<br />
Page 30 of 107<br />
North American Crude Oil and NGLs<br />
(continued)<br />
CASE STUDY<br />
Crude Oil Resource Potential<br />
In In North North America we we have have a diverse a diverse crude crude oil oil portfolio with with<br />
both both light light and and heavy heavy crude crude oil production oil production. but its While heavy optimizing crude<br />
oilour thatlight will crude drive our oil production crude oil growth. it is heavy We have crude one oil of that thewill<br />
largest continue heavy to drive crudeour oil crude asset oil bases growth. in the We WCSB have one withof 65the<br />
billion largest barrels heavy ofcrude OOIP. oil overall asset bases in the WCSB with<br />
The an challenge estimated to 65 find billion ways barrels to economically of OOIP. recover as much as<br />
possible Our challenge and to develop is to the find markets ways to capable economically of absorbing recover this as<br />
new much crude of oil. our We resource have addressed as possible this and latter develop issue though the markets our<br />
3-phase capable marketing of absorbing plan which this new has been crude articulated oil. We have over addressed the past<br />
three this years. latter From issue a through technical our perspective, 3-phase marketing we believe plan we have which<br />
very has significant been articulated resource potential over the as past follows: three years. Our recovery<br />
Proved plans include: and Probable Reserves represent those fields already<br />
in Realizing production our and probable those in reserves the planning by optimizing phase that those can pools be<br />
recognized currently as on reserves production.<br />
The Executing Defined “The Plan represents Defined Plan” development of oil development potential over over the the<br />
next next 10-15 10 years to 15 including years, including additional additional thermal in-situ thermal projects, in-situ<br />
polymer projects, flooding polymer upside flooding at Pelican at Pelican Lake and Lake elsewhere and elsewhere and<br />
light and crude light oil crude EOR. All oil of EOR. these These projects projects are in are various currently stages in<br />
of various planning stages and evaluation. of planning and evaluation.<br />
Future Delivering Resource our Potential Futureis comprised Resource of Potential less defined comprising thermal<br />
in-situ additional projects thermal and EOR in-situ projects and that other are EOR in the projects, stages which of field are<br />
testing in stages or are of currently field testing being or researched. are currently These being projects researched. target<br />
Light crude oil and NGLs Thermal oil sands<br />
both our light and our heavy crude oil fields.<br />
Pelican Lake crude oil Primary heavy crude oil
Review of Operations: North American Crude Oil and NGLs<br />
Page 31 of 107<br />
Geo-steering technology<br />
Crude oil production (bbl/d)<br />
Pilot well pad of 3 producers and 2 injectors<br />
600<br />
500<br />
400<br />
300<br />
200<br />
100<br />
Indication of bottom shale<br />
allows driller to re-orient<br />
horizontal drill string.<br />
0<br />
Oct 01<br />
HISTORIC APPROACH<br />
CURRENT APPROACH<br />
º Celsius<br />
Oct 02<br />
CASE STUDY<br />
Technology Highlight<br />
BOTTOM SHALE<br />
Horizontal wells<br />
12˚ 40˚ 70˚ 100˚ 130˚ 160˚ 190˚ 220˚ 250˚ 305˚<br />
Initiate Polymer Injection<br />
Oct 03<br />
Oct 04<br />
RESERVOIR GAINED<br />
FROM GEO-STEERING<br />
PRE GEO-STEERING<br />
Oct 05<br />
Infill well<br />
Distance<br />
Distance<br />
0 200 m<br />
Oct 06<br />
0 100 m<br />
Geo-steering<br />
When When drilling horizontal wells, wells, optimal wellbore placement is is<br />
near near the the bottom of of the the reservoir. Past Past methods were were inefficient,<br />
commonly involved drilling out out the the bottom of of the the reservoir<br />
into into the the underlying shales, then then correcting the the trajectory of of the the<br />
wellbore. Today, Today, we we have have a adapted a adapted the the technology of of geogeosteering used used in conventional in conventional offshore to to drilling oil oil sands sands wells. wells.<br />
This This methodology detects the the presence of of the the reservoir base base<br />
through logging while while drilling and and allows allows the the wellbore trajectory<br />
to to be be adjusted to to maintain the optimal distance from the base of<br />
of the reservoir. This leads to to savings in in drilling time and and could add<br />
add millions of resource of barrels potential of resource through potential optimal through placement optimal of the<br />
placement wellbore of in the even wellbore relatively in thin even reservoir. relatively thin reservoir.<br />
Pelican Lake Polymer Flood<br />
At At Pelican Lake Lake we we have have successfully implemented waterflooding<br />
in portions in portions of the of the pool, pool, largely against conventional wisdom which which<br />
would not not expect success in a in thin, a thin, heavy heavy crude crude oil oil reservoir. We We<br />
now now believe that that waterflooding could could improve recovery factors<br />
from from the the base base level level of of 3-5% 3-5% OOIP OOIP up up to to 10-15% OOIP. OOIP. To To<br />
further enhance the the waterflooding process we we began evaluation<br />
and and field field testing polymer flood flood and and have have achieved great great early early<br />
success at at a reasonable a reasonable cost. cost. We We estimate recovery factors could could<br />
ultimately increase to to 15-25% OOIP OOIP in in the the better better portions of of<br />
the the reservoir. Ultimately this this EOR EOR technology could could add add over over<br />
250 250 million barrels of of resource potential.<br />
Primrose In-Situ Infill Program<br />
<strong>Canadian</strong> <strong>Natural</strong> historically believed that that cyclic cyclic steaming<br />
of of horizontal wells wells spaced at at 120 120 meters was was sufficient to to<br />
“heat” and and recover oil oil in in the the intervening reservoir. We’ve We’ve now now<br />
proven through extensive engineering studies and and infill infill well well<br />
drilling that that the the optimal spacing is is approximately 60 60 meters.<br />
We We believe that that this this could could improve recovery factors at at Primrose<br />
from from approximately 25% 25% to to more more than than 40% 40% OOIP OOIP adding<br />
300 300 million barrels of of resource potential. At At this this interwell spacing<br />
there there is also is also additional potential to to convert to to a gravity a gravity drainage<br />
process and and increase recovery even even further.
<strong>Canadian</strong> <strong>Natural</strong> AR2006<br />
Page 32 of 107<br />
International<br />
Our international operations provide a vehicle for continued light<br />
crude oil production growth. A disciplined and focused approach<br />
is essential to successful value creation in the international arena,<br />
therefore, we limit our exposure to those basins where we see<br />
the greatest opportunities and we can best lever our business<br />
strategies. We capitalize on our core competency of mature basin<br />
exploitation in the North Sea where the business parallels that of the<br />
WCSB in many ways. Offshore West Africa provides development<br />
opportunities and significant exploration upside, capitalizes on<br />
strong government relationships developed over the past years and<br />
leverages the technical/operational expertise in the North Sea. In<br />
both basins, we operate in areas where we dominate the land base<br />
and have the infrastructure to support our operations.<br />
06<br />
05<br />
04<br />
03<br />
02<br />
ALLEN M. KNIGHT,<br />
SENIOR VICE-PRESIDENT,<br />
INTERNATIONAL &<br />
CORPORATE DEVELOPMENT<br />
International successful crude oil wells drilled (net wells)<br />
12<br />
15<br />
11<br />
12<br />
8<br />
United Kingdom Portion of the North Sea<br />
THE ASSET<br />
Achievements in the basin are a result of the successful utilization of<br />
our mature basin exploitation expertise. The first stage is predicated<br />
upon optimizing existing facilities and waterfloods. This includes<br />
infill drilling, recompletions, and workover wells and optimizing<br />
waterfloods to increase production, lower costs and extend field<br />
life. The second stage incorporates more near-pool development<br />
and exploration in order to maximize utilization of common facilities<br />
and ultimately extend all fields’ economic lives. In 2006 and beyond,<br />
increasing emphasis on this type of work will be made.<br />
2006 ACTIVITY<br />
During 2006, 7.4 net crude oil wells were drilled along with 1.8<br />
injection wells, effectively offsetting production declines.<br />
In the Northern North Sea, production at Ninian reached its<br />
highest level since <strong>Canadian</strong> <strong>Natural</strong> became operator of the<br />
Field in 2002. Work progressed on the Columba Terrace and<br />
Lyell Field developments with subsea infrastructure being installed<br />
at both locations and drilling operations commencing.<br />
In the Central North Sea, following the consolidation of production<br />
from the Banff/Kyle Hub to a single FPSO, operating costs were<br />
reduced and the economic life of both fields extended. At Banff,<br />
work was completed to upgrade gas compression capacity, resulting<br />
in an immediate uplift in crude oil production from the field. At the<br />
T-Block Hub, high impact subsea wells were delivered, resulting in<br />
the highest production levels for three years being achieved.<br />
International total production (mboe/d)<br />
06<br />
05<br />
04<br />
03<br />
02<br />
101<br />
95<br />
86<br />
76<br />
50
Review of Operations: International<br />
Page 33 of 107<br />
WHAT TO EXPECT IN 2007 AND BEYOND<br />
During 2007, 7 net crude oil wells are expected to be drilled, allowing<br />
average daily production to be maintained at 2006 levels. At the<br />
Murchison Hub, a major turnaround will be carried out to upgrade<br />
aging facilities in order to optimize plant efficiency and uptime. At<br />
the Ninian Hub, a major turnaround at Ninian Southern, driven by<br />
planned integrity maintenance schedules, will be completed. Major<br />
development projects at Kyle, Lyell and the Columba Terraces will<br />
move into execution phase, both on the drilling and construction<br />
side. At the B-Block Hub, gas compression capacity upgrade work<br />
will be carried out and third party oil will be received at the Balmoral<br />
facility, resulting in a significant reduction in field operating costs.<br />
Offshore West Africa<br />
THE ASSET<br />
<strong>Canadian</strong> <strong>Natural</strong> has two exploration blocks comprising<br />
approximately 55,000 net developed and undeveloped<br />
acres of land located offshore Côte d’Ivoire. Currently three<br />
producing properties, East Espoir, West Espoir and Baobab,<br />
are operated.<br />
2006 ACTIVITY<br />
In Côte d’Ivoire in 2006 4.1 net crude oil wells and 1.7 service<br />
and injection wells were drilled. Also during the year, first oil at<br />
our West Espoir field was delivered on schedule during the third<br />
quarter During 2006, problems were encountered with control of<br />
sand and solids production, leading to 5 of the 10 production wells<br />
at Baobab being shut in by the end of the year. The Company plans<br />
to recomplete these wells, but only at such time as a deepwater rig<br />
can be secured on commercially acceptable terms.<br />
In October 2005, we completed the acquisition of the permit to<br />
develop the Olowi Field, offshore Gabon. The permit comprises a<br />
90% interest in the production sharing agreement for the Block<br />
containing the Olowi Field, located 20 kilometers offshore and in<br />
30 meters of water. Olowi has been delineated by the drilling of<br />
15 wells by the previous owner and potentially contains as much<br />
as 215 million barrels of 34˚ API light crude OOIP. The crude oil<br />
reservoir is overlain by a large gas cap with potentially up to 589<br />
billion cubic feet of Original Gas In Place (“OGIP”). A development<br />
plan, comprising an FPSO and four drilling towers was filed with<br />
the Gabonese Government in late 2005, and approved in February<br />
2006. The development of the crude oil reserves commenced in<br />
late 2006, with first production targeted for late 2008, with a peak<br />
rate of 20,000 bbl/d net expected in 2009.<br />
WHAT TO EXPECT IN 2007 AND BEYOND<br />
During 2007, a further 3 net crude oil wells will be drilled at West<br />
Espoir, with each well being brought online as it is completed. At East<br />
Espoir, a rigless coiled tubing intervention program will be carried<br />
out to further optimize production, and at Baobab we will remain<br />
focused on securing a deepwater rig to allow the tremendous<br />
potential at Baobab to be delivered, but only on commercially<br />
acceptable terms. In Gabon, the Olowi development project will<br />
be progressed towards first oil in late 2008, with construction of<br />
the drilling towers being carried out in 2007 and drilling operations<br />
commencing in 2008.<br />
<strong>Canadian</strong> <strong>Natural</strong> plans to leverage its reputation and experience<br />
in the region to capture additional exploration and exploitation<br />
opportunities within this core region.
<strong>Canadian</strong> <strong>Natural</strong> AR2006<br />
Page 34 of 107<br />
Horizon Oil Sands Project<br />
Percentage of work progress (cumulative)<br />
60<br />
40<br />
20<br />
0<br />
RÉAL J.H. DOUCET,<br />
SENIOR VICE-PRESIDENT,<br />
OIL SANDS<br />
We hold extensive leases in the Athabasca region north of Fort<br />
McMurray that are estimated to contain approximately 16 billion<br />
barrels of original bitumen in place. The Horizon Oil Sands Project<br />
represents a phased development accessing 6 billion barrels of<br />
mineable bitumen resource potential, depending upon sales price<br />
assumptions. The Horizon Project includes a surface oil sands<br />
mining and bitumen extraction plant coupled with on-site bitumen<br />
upgrading and associated infrastructure to produce synthetic<br />
crude oil. Due to the massive resource base, the mine and plant<br />
facilities are expected to produce for decades to come without the<br />
Actual Plan<br />
Q1-05 Q2-05 Q3-05 Q4-05 Q1-06 Q2-06 Q3-06 Q4-06<br />
production declines normally associated with crude oil production.<br />
Today we are well into Phase 1 construction with first oil targeted<br />
for the second half of 2008 ramping to 110,000 bbl/d by the<br />
end of that year. Subsequent phases are planned with total ultimate<br />
potential production from the leases of approximately 500,000 bbl/d<br />
by 2017. At 34º API gravity, low sulphur and fully sweet, the<br />
project is designed to produce a high quality SCO product reducing<br />
marketing risks.<br />
The technology at the Horizon Project is based on that currently in use<br />
at existing plants, effectively mitigating technology risk in Phase 1.<br />
That being said, our plant has been configured in a manner to<br />
maximize benefits from the technologies. For example, the Horizon<br />
Project will have a very high level of heat sharing and integration<br />
between the facilities, reducing both natural gas consumption and<br />
greenhouse gas emission levels.<br />
The geological risk associated with the project is very low. On this<br />
lease, over 16 stratigraphic net wells per section have been drilled to<br />
identify overburden levels, and test the ore composition and quality.<br />
The result is a well designed mine plan that has been optimized to<br />
support the bitumen extraction and processing. To ensure efficient<br />
construction, we have implemented an “80/100 rule”, requiring<br />
about 80% of engineering to be complete and 100% of materials<br />
purchased prior to construction of major packages. This has<br />
resulted in minimal rework and very little standby time. In addition<br />
our execution and labour strategy combined with the fly-in/fly-out<br />
ability of workers and our first-class camp facilities has positioned<br />
the Horizon Project as “the employer of choice” in the region.<br />
Finally, this asset has been designed to accommodate future<br />
growth. Our footprint allows for easy access to all parts of the plant<br />
and ensures that future production expansions would not impact<br />
existing operations.<br />
Percentage of capital spending (cumulative)<br />
60<br />
40<br />
20<br />
0<br />
Actual Plan<br />
Q1-05 Q2-05 Q3-05 Q4-05 Q1-06 Q2-06 Q3-06 Q4-06
Review of Operations: Oil Sands Mining<br />
Page 35 of 107<br />
2006 ACTIVITY<br />
Significant progress was achieved during 2006 with overall Phase 1<br />
project progress entering the year at 19% and exiting at 57%,<br />
slightly ahead of our plan.<br />
Overall detailed engineering reached 94% completion and was<br />
substantially completed in most areas. Similarly, procurement exited<br />
at 84% complete with most major equipment purchased and on<br />
site. A total of over $5.1 billion in purchase orders and contracts<br />
were awarded through the end of 2006.<br />
Use of modular construction in remote yards located at larger<br />
metropolitan areas was a strategic decision made early in the project<br />
execution plan. While this greatly reduces requirements for on-site<br />
labour it is only successful if logistics and transportation efforts<br />
are successful. Our program has proven to be successful having<br />
delivered 973 oversized loads, or 59% of Phase 1 requirements,<br />
through the end of 2006.<br />
The construction effort itself has reached 42% complete by year<br />
end, as efforts changed from one of largely civil and underground<br />
work in 2005 and early 2006 to above ground construction and<br />
equipment installation. By the end of the year the following<br />
accomplishments were achieved:<br />
� � Set 333 main piperack modules, essentially forming the core<br />
infrastructure of the plant.<br />
� � Delayed cokers were significantly advanced following<br />
completion of foundations, delivery and erection of four coke<br />
drums and setting of topside drill towers.<br />
� � Numerous reactors were completed and transported to site<br />
with subsequent placement in early 2007.<br />
� � Constructed 7 of 14 Inclined Plate Separators units for bitumen<br />
froth cleaning.<br />
� � Ore Preparation Area completed construction of the<br />
Mechanically Stabilized Earth Shear Wall and transported the<br />
800 tonne module assemblies onto their foundations.<br />
� � Mine overburden removal has moved 25 million bank cubic<br />
meters, which is approximately 35% complete and 4% ahead<br />
of target.<br />
� � 5 of 6 Modular Substations have been installed with High<br />
Voltage cable terminations ongoing.<br />
� � Completed and commissioned for use, two additional on-site<br />
worker camps, increasing on-site accommodation capacity<br />
to 5,000.<br />
� � Completed numerous ancillary buildings and commissioned<br />
various support systems/services, including fire and emergency<br />
response.
<strong>Canadian</strong> <strong>Natural</strong> AR2006<br />
Page 36 of 107<br />
Horizon Oil Sands Project (continued)<br />
Creative Approach Continues to Create<br />
Value for Shareholders<br />
Inflationary pressures have been significant throughout the industry<br />
for the past few years and are the result of higher steel/commodity<br />
prices and increased demands for contractor expertise and labour/<br />
services. Our team has been able to mitigate the majority of these<br />
pressures. Further, we remain on track for final commissioning<br />
during the third quarter of 2008.<br />
Some of the elements of this successful execution included:<br />
� � An upfront emphasis on design and execution strategy. This<br />
facilitated a better definition of both what we were going to<br />
build and how we were going to build it. This greater level of<br />
project definition facilitated the award of approximately 68%<br />
of Phase 1 costs through lump sum arrangements.<br />
� � A flexible contracting strategy, with <strong>Canadian</strong> <strong>Natural</strong> as the<br />
general contractor. This afforded us the ability to alter work<br />
packages to fit the current market. Additionally, in the case<br />
of the Tar River Diversion project, self perform the work to<br />
drive appropriate pricing and, in effect, build and train our<br />
operations team and core supervision.<br />
� � Our labour strategy of ‘managed open site’ combined with<br />
fly-in / fly-out. Through this we have accessed the labour force<br />
across Canada, bringing workers in from coast to coast. We<br />
currently have up to 55 flights per week into our site from<br />
all across Canada and continue to assess new locations and<br />
available labour forces. Workforce numbers at site have met<br />
the Project labour demand with 4,000 trades persons working<br />
on site in December.<br />
In 2007 we anticipate mechanical completion in several plants within<br />
the project and will continue to recruit and build the operating and<br />
maintenance teams for the new facilities. We have had operations<br />
staff involved in the design, procurement and construction of the<br />
Horizon Project and their input and direction has been invaluable<br />
as we ensure the facilities will operate efficiently and be easily<br />
maintained.<br />
Teams responsible for the commissioning and start-up of the<br />
facilities have already prepared a schedule that is directly linked to<br />
the construction schedules. This allows us to identify early pinch<br />
points and ensure that we have adequate contingencies in place<br />
during start-up. Currently we have 134 operations people on<br />
staff developing start up procedures, preparing training programs,<br />
recruiting additional staff, establishing maintenance programs, and<br />
already operating several plant systems.<br />
Our Operations team has the opportunity to test run many of<br />
its programs through the early operation of many plant systems.<br />
Currently operating some of its mine equipment, and operating<br />
several plant facilities such the water treatment system, sewage<br />
treatment plant, natural gas distribution, power distribution,<br />
and communications systems the team has already developed<br />
several early learnings that are incorporated into later facility start<br />
up plans.<br />
The asset is substantial and is anticipated to provide significant<br />
free cash flow in the future. Our Defined Plan is predicated upon<br />
generating the greatest value for our Shareholders. With respect<br />
to future expansions, we have started consolidating results from<br />
the Phase 2 Engineering Design Specification and have identified<br />
a number of potential options for Phases 2/3 execution within the<br />
current high cost environment. We will fully evaluate these options<br />
and provide further updates as we move through that process.
Year-End Reserves<br />
Page 37 of 107<br />
Year-End Reserves<br />
INDEPENDENT EVALUATION<br />
� � For the year ended December 31, 2006, <strong>Canadian</strong> <strong>Natural</strong> retained qualified independent reserve evaluators, Sproule Associates<br />
Limited (“Sproule”) and Ryder Scott Company (“Ryder Scott”) to evaluate 100% of the Company’s conventional proved and probable<br />
crude oil, natural gas liquids (“NGL”) and natural gas reserves* and prepare Evaluation Reports on these reserves. Sproule evaluated<br />
the Company’s North America conventional assets and Ryder Scott evaluated its international conventional assets. <strong>Canadian</strong> <strong>Natural</strong><br />
has been granted an exemption from National Instrument 51-101 – Standards of Disclosure for Oil and Gas Activities (“NI 51-101”),<br />
which prescribes the standards for the preparation and disclosure of reserves and related information for companies listed in Canada.<br />
This exemption allows the Company to substitute United States Securities and Exchange Commission (“SEC”) requirements for certain<br />
disclosures required under NI 51-101. There are two principal differences between the two standards. The first is the additional<br />
requirement under NI 51-101 to disclose both proved, and proved and probable reserves, as well as the related net present value of<br />
future net revenues using forecast prices and costs. The second is in the definition of proved reserves; however, as discussed in the<br />
<strong>Canadian</strong> Oil and Gas Evaluation Handbook (“COGEH”), the standards that NI 51-101 employs, the difference in estimated proved<br />
reserves based on constant pricing and costs between the two standards is not material.<br />
� � The Company has disclosed proved conventional reserves and the Standardized Measure of discounted future net cash flows using<br />
yearend constant prices and costs as mandated by the SEC in the supplementary oil and gas information section of this Annual<br />
Report. The Company has elected to provide the net present value (7) of these same conventional proved reserves as well as the<br />
conventional proved and probable reserves and the net present value of these reserves under the same parameters as additional<br />
voluntary information.<br />
� � For the year ended December 31, 2006, the Company retained a qualified independent reserves evaluator, GLJ Petroleum Consultants<br />
(“GLJ”), to evaluate 100% of Phases 1 through 3 of the Company’s Horizon Oil Sands Project and prepare an Evaluation Report on the<br />
Company’s proved and probable oil sands mining reserves incorporating both the mining and upgrading projects. These reserves were<br />
evaluated adhering to the requirements of SEC Industry Guide 7 using year-end constant pricing and have been disclosed separately<br />
from the Company’s conventional proved and probable crude oil, NGL and natural gas reserves.<br />
� � The Reserve Committee of the Company’s Board of Directors has met with and carried out independent due diligence procedures with<br />
each of Sproule, Ryder Scott and GLJ to review the qualifications of and procedures used by each evaluator in determining the estimate<br />
of the Company’s quantities and net present value of remaining conventional crude oil, NGL and natural gas reserves as well as the<br />
Company’s quantity of oil sands mining reserves.<br />
NORTH AMERICA CONVENTIONAL NET RESERVES<br />
� � <strong>Natural</strong> gas proved reserves increased by 35%, replacing 323% of 2006 production. Similarly, crude oil and NGLs proved reserves<br />
increased by 28%, replacing 357% of production. This was accomplished at all-in finding and on-stream cost of $15.86 per barrels of<br />
oil equivalent for proved reserves and $9.53 per barrels of oil equivalent for proved and probable reserves.<br />
INTERNATIONAL CONVENTIONAL NET RESERVES<br />
� � North Sea proved reserves grew by 10 million barrels of oil equivalent to 305 million barrels of oil equivalent or about 16% of total<br />
proved Company reserves. Reserve additions were primarily achieved through optimization of waterflood design, an infill drilling<br />
program and recompletions.<br />
� � In Offshore West Africa, where the Government share of production is contractually determined as a percentage of production volume<br />
and apportioned between income tax and royalties for reserves and accounting purposes based on the terms of the Production Sharing<br />
Contracts (“PSC”), proved reserves decreased to 139 million barrels of oil equivalent as a result of a 2006 corporate income tax rate<br />
reduction that effectively increased the allocation to royalty. Generally, the Company receives a greater portion of production until<br />
capital development costs are recouped whereupon government allocation of production substantially increases. With the current<br />
high world crude oil price, these projects generally require fewer of the reserves to cover payout of capital costs, thereby reducing the<br />
reserves ultimately allocated to the Company over the field life.<br />
CONVENTIONAL PROVED UNDEVELOPED NET RESERVES (“PUDS”)<br />
� � In the Evaluation Reports, 47% of crude oil proved reserves were assigned to the proved undeveloped category. This is a 9 percentage<br />
point increase from the 38% recorded in 2005. Of the 2006 crude oil PUD reserves, 57% are associated with our thermal oil sands<br />
projects where extensive pool delineation and geological analysis justifies continued development and expansion.<br />
� � In the Evaluation Reports, 22% of natural gas proved reserves were assigned to the proved undeveloped category reflecting the<br />
generally shorter lead times required for natural gas developments in Canada.
<strong>Canadian</strong> <strong>Natural</strong> AR2006<br />
Page 38 of 107<br />
CONVENTIONAL PROVED AND PROBABLE NET RESERVES<br />
� � In the Evaluation Reports, total proved and probable reserves increased by 30%, driven largely by the 42% increase in North America.<br />
OIL SANDS MINING RESERVES<br />
� � The Horizon Project’s gross lease proved bitumen reserves as of December 31, 2006 under constant prices were 2.3 billion barrels. The<br />
gross lease proved and probable bitumen reserves were 3.5 billion barrels.<br />
* Conventional crude oil, NGL and natural gas includes all of the Company’s light and medium, heavy and, thermal crude oil, natural gas, coal bed methane and<br />
natural gas liquid activities. It does not include the Company’s oil sands mining assets<br />
NET RESERVES OF CONVENTIONAL CRUDE OIL AND NATURAL GAS (1)(2)<br />
December 31, 2006<br />
Proved Proved Proved Proved and<br />
Developed (3) Undeveloped (3) Total (3) Probable (4)<br />
Crude oil and NGLs (mmbbl)<br />
North America 420 467 887 1,502<br />
North Sea 214 85 299 422<br />
Offshore West Africa 63 67 130 195<br />
<strong>Natural</strong> gas (bcf)<br />
697 619 1,316 2,119<br />
North America 2,934 771 3,705 4,857<br />
North Sea 17 20 37 93<br />
Offshore West Africa 12 44 56 99<br />
2,963 835 3,798 5,049<br />
Total reserves (mmboe) 1,191 758 1,949 2,961<br />
Reserve replacement ratio (%) (5) Cost to develop ($/boe)<br />
295% 472%<br />
(6)<br />
10% discount 1.33 6.46 3.32 3.08<br />
15% discount<br />
Present value of conventional reserves ($ millions)<br />
1.12 5.80 2.94 2.66<br />
(7)<br />
10% discount 20,028 7,469 27,497 37,291<br />
15% discount 17,296 5,247 22,543 29,350<br />
NET RESERVES OF CONVENTIONAL CRUDE OIL AND NATURAL GAS (1)(2)<br />
December 31, 2005<br />
Proved Proved Proved Proved and<br />
Developed (3) Undeveloped (3) Total (3) Probable (4)<br />
Crude oil and NGLs (mmbbl)<br />
North America 402 292 694 1,035<br />
North Sea 214 76 290 417<br />
Offshore West Africa 80 54 134 206<br />
<strong>Natural</strong> gas (bcf)<br />
696 422 1,118 1,658<br />
North America 2,300 441 2,741 3,548<br />
North Sea 16 13 29 69<br />
Offshore West Africa 10 62 72 110<br />
2,326 516 2,842 3,727<br />
Total reserves (mmboe) 1,083 509 1,592 2,279<br />
Reserve replacement ratio (%) (5) Cost to develop ($/boe)<br />
145% 195%<br />
(6)<br />
10% discount 0.79 5.69 2.36 2.55<br />
15% discount<br />
Present value of conventional reserves ($ millions)<br />
0.67 5.15 2.11 2.25<br />
(7)<br />
10% discount 24,275 6,342 30,617 38,682<br />
15% discount 20,939 4,881 25,820 31,642
Year-End Reserves<br />
Page 39 of 107<br />
OIL SANDS MINING RESERVES (1)(8)<br />
The following table sets out <strong>Canadian</strong> <strong>Natural</strong>’s reserves of bitumen and synthetic crude oil from the Horizon Oil Sands Project leases.<br />
As at Dec 31, 2006 As at Dec 31, 2005<br />
Proved Proved and Proved Proved and<br />
Total Probable Total Probable<br />
Gross lease reserves, before royalties (mmbbl)<br />
Bitumen 2,275 3,530 2,235 3,430<br />
Synthetic crude oil *<br />
Net reserves, after royalties (mmbbl)<br />
1,866 2,962 1,833 2,878<br />
Bitumen 1,853 2,872 1,848 2,848<br />
Synthetic crude oil * 1,596 2,542 1,626 2,566<br />
* SCO reserves are based upon upgrading of the bitumen reserves. The reserves shown for bitumen and SCO are not additive.<br />
NET CONVENTIONAL CRUDE OIL AND NGLs RESERVES RECONCILIATION (1)(2)<br />
North North Offshore<br />
America Sea West Africa Total<br />
Proved reserves (mmbbl)<br />
Reserves, December 31, 2004 648 303 115 1,066<br />
Extensions and discoveries 98 – – 98<br />
Infill drilling 3 3 2 8<br />
Improved recovery – – – –<br />
Property purchases – – 15 15<br />
Property disposals (3) – – (3)<br />
Production (70) (25) (8) (103)<br />
Revisions of prior estimates 18 9 10 37<br />
Reserves, December 31, 2005 694 290 134 1,118<br />
Extensions and discoveries 53 3 – 56<br />
Infill drilling 190 14 – 204<br />
Improved recovery – 12 – 12<br />
Property purchases 26 – – 26<br />
Property disposals – – – –<br />
Production (75) (22) (13) (110)<br />
Revisions of prior estimates (1) 2 9 10<br />
Reserves, December 31, 2006 887 299 130 1,316<br />
Proved and probable reserves (mmbbl)<br />
Reserves, December 31, 2004 926 415 196 1,537<br />
Extensions and discoveries 200 – – 200<br />
Infill drilling 3 5 6 14<br />
Improved recovery – – – –<br />
Property purchases – – 17 17<br />
Property disposals (4) – – (4)<br />
Production (70) (25) (8) (103)<br />
Revisions of prior estimates (20) 22 (5) (3)<br />
Reserves, December 31, 2005 1,035 417 206 1,658<br />
Extensions and discoveries 128 3 – 131<br />
Infill drilling 384 17 – 401<br />
Improved recovery – 12 – 12<br />
Property purchases 34 – – 34<br />
Property disposals – – – –<br />
Production (75) (22) (13) (110)<br />
Revisions of prior estimates (4) (5) 2 (7)<br />
Reserves, December 31, 2006 1,502 422 195 2,119
<strong>Canadian</strong> <strong>Natural</strong> AR2006<br />
Page 40 of 107<br />
NET CONVENTIONAL NATURAL GAS RESERVES RECONCILIATION (1)(2)<br />
North North Offshore<br />
America Sea West Africa Total<br />
Proved reserves (bcf)<br />
Reserves, December 31, 2004 2,591 27 72 2,690<br />
Extensions and discoveries 506 – – 506<br />
Infill drilling 22 – – 22<br />
Improved recovery 8 – – 8<br />
Property purchases 6 – – 6<br />
Property disposals (23) – – (23)<br />
Production (411) (7) (1) (419)<br />
Revisions of prior estimates 42 9 1 52<br />
Reserves, December 31, 2005 2,741 29 72 2,842<br />
Extensions and discoveries 250 – – 250<br />
Infill drilling 71 – – 71<br />
Improved recovery 3 – – 3<br />
Property purchases 1,111 – – 1,111<br />
Property disposals (1) – – (1)<br />
Production (433) (5) (3) (441)<br />
Revisions of prior estimates (37) 13 (13) (37)<br />
Reserves, December 31, 2006<br />
Proved and probable reserves (bcf)<br />
3,705 37 56 3,798<br />
Reserves, December 31, 2004 3,319 57 90 3,466<br />
Extensions and discoveries 645 – – 645<br />
Infill drilling 23 – 1 24<br />
Improved recovery 14 – – 14<br />
Property purchases 8 – – 8<br />
Property disposals (30) – – (30)<br />
Production (411) (7) (1) (419)<br />
Revisions of prior estimates (20) 19 20 19<br />
Reserves, December 31, 2005 3,548 69 110 3,727<br />
Extensions and discoveries 307 – – 307<br />
Infill drilling 95 – – 95<br />
Improved recovery 4 – – 4<br />
Property purchases 1,466 – – 1,466<br />
Property disposals (1) – – (1)<br />
Production (433) (5) (3) (441)<br />
Revisions of prior estimates (129) 29 (8) (108)<br />
Reserves, December 31, 2006 4,857 93 99 5,049<br />
NET CONVENTIONAL FINDING AND ONSTREAM COSTS (1)(2)<br />
2006 2005 2004<br />
Three Year<br />
Total<br />
Net reserve replacement expenditures ($ millions)<br />
Net reserve additions (mmboe)<br />
8,727 3,361 4,259 16,347<br />
(9)<br />
Proved 540 251 354 1,145<br />
Proved and probable<br />
Finding and on stream costs ($/boe)<br />
865 337 453 1,655<br />
(10)<br />
Proved 16.16 13.41 12.03 14.28<br />
Proved and probable 10.09 9.97 9.40 9.88
Year-End Reserves<br />
Page 41 of 107<br />
NET RESERVES CLASSIFICATION BY PRODUCT (1)(2)<br />
December 31, 2006<br />
Proved Proved Proved Proved and<br />
Reserves Net of Royalties Developed (3) Undeveloped (3) Total (3) Probable (4)<br />
Light crude oil and NGLs<br />
North America 6% 1% 7% 6%<br />
North Sea 11% 4% 15% 14%<br />
Offshore West Africa 3% 3% 6% 7%<br />
Total<br />
Heavy crude oil<br />
20% 8% 28% 27%<br />
North America - Primary Heavy 5% 1% 6% 4%<br />
North America - Pelican Lake 3% 5% 8% 7%<br />
North America - Thermal 7% 18% 25% 34%<br />
Total<br />
Total crude oil and NGLs<br />
15% 24% 39% 45%<br />
North America 21% 25% 46% 51%<br />
North Sea 11% 4% 15% 14%<br />
Offshore West Africa 3% 4% 7% 7%<br />
Total<br />
<strong>Natural</strong> gas<br />
35% 33% 68% 72%<br />
North America 25% 7% 32% 27%<br />
North Sea – – – –<br />
Offshore West Africa – – – 1%<br />
Total 25% 7% 32% 28%<br />
Total boe 60% 40% 100% 100%<br />
(1) Reserve estimates and net present value calculations are based upon year end constant reference price assumptions as detailed below as well as constant<br />
year-end costs.<br />
Company WTI @ Hardisty North<br />
Average Cushing Heavy Sea<br />
Price Oklahoma 12º API Brent<br />
Crude oil and NGLs (C$/bbl) (US$/bbl) (C$/bbl) (US$/bbl)<br />
2006 51.11 61.05 41.94 58.93<br />
2005 46.12 61.04 32.64 58.21<br />
2004 32.14 44.04 17.45 40.47<br />
Company British Columbia<br />
Average Henry Hub Alberta Huntingdon<br />
Price Louisiana AECO C Sumas<br />
<strong>Natural</strong> gas (C$/mcf) (US$/mmbtu) (C$/mmbtu) (C$/mmbtu)<br />
2006 6.07 5.52 6.13 6.52<br />
2005 9.45 10.08 9.99 9.53<br />
2004 6.44 6.62 6.78 6.94<br />
A foreign exchange rate of US$0.86/C$1.00 was used in the 2006 and the 2005 evaluations; US$0.83/C$1.00 was used in the 2004 evaluation.<br />
(2) Net reserves mean the Company’s working interest share of gross reserves after consideration of royalties.<br />
(3) Proved reserve estimates and values were evaluated in accordance with the Securities and Exchange Commission (“SEC”) requirements. The stated reserves have a<br />
reasonable certainty of being economically recoverable using year-end prices and costs held constant throughout the productive life of the properties.<br />
(4) Proved and probable reserve estimates and values were evaluated in accordance with the standards of the <strong>Canadian</strong> Oil and Gas Evaluation Handbook (“COGEH”)<br />
and as mandated by NI 51-101. The stated reserves have a 50% probability of equaling or exceeding the indicated quantities and were evaluated using year-end<br />
costs and prices held constant throughout the productive life of the properties.<br />
(5) Reserve replacement ratios were calculated using annual net reserve additions comprised of all change categories divided by the net production for that year.<br />
(6) Cost to develop represents total discounted future capital for each reserves category excluding abandonment capital divided by the reserves associated with<br />
that category.<br />
(7) Net present values of reserves are based upon discounted cash flows associated with prices and operating expenses held constant into the future, prior to the<br />
consideration of income taxes and existing asset abandonment liabilities. Future development costs and associated material well abandonment costs have been<br />
applied against future net revenues.<br />
(8) Synthetic crude oil reserves are based on upgrading of the bitumen reserves using technologies implemented at the Horizon Project. The reserve values shown for<br />
bitumen and synthetic crude oil are not additive.<br />
(9) Reserves additions are comprised of all categories of reserves changes, exclusive of production.<br />
(10) Reserves finding and on stream costs are determined by dividing total capital cash expenditures for each year by net reserves additions for that year. It excludes costs<br />
associated with head office, abandonments, midstream and the Horizon Project.
<strong>Canadian</strong> <strong>Natural</strong> AR2006<br />
Page 42 of 107<br />
Management’s Discussion & Analysis<br />
SPECIAL NOTE REGARDING FORWARD<br />
LOOKING STATEMENTS<br />
Certain statements in this document or documents incorporated<br />
herein by reference for <strong>Canadian</strong> <strong>Natural</strong> <strong>Resources</strong> Limited (the<br />
“Company”) may constitute “forward-looking statements” within<br />
the meaning of the United States Private Securities Litigation Reform<br />
Act of 1995. These forward-looking statements can generally<br />
be identified as such because of the context of the statements<br />
including words such as “believes”, “anticipates”, “expects”,<br />
“plans”, “estimates”, or words of a similar nature.<br />
The forward-looking statements are based on current expectations<br />
and are subject to known and unknown risks, uncertainties and<br />
other factors that may cause the actual results, performance or<br />
achievements of the Company, or industry results, to be materially<br />
different from any future results, performance or achievements<br />
expressed or implied by such forward-looking statements. Such<br />
factors include, among others: general economic and business<br />
conditions which will, among other things, impact demand for<br />
and market prices of the Company’s products; foreign currency<br />
exchange rates; economic conditions in the countries and regions<br />
in which the Company conducts business; political uncertainty,<br />
including actions of or against terrorists or insurgent groups or<br />
other conflict including conflict between states; industry capacity;<br />
ability of the Company to implement its business strategy, including<br />
exploration and development activities; impact of competition;<br />
the availability and cost of seismic, drilling and other equipment;<br />
ability of the Company to complete its capital programs; ability of<br />
the Company to transport its products to market; potential delays<br />
or changes in plans with respect to exploration or development<br />
projects or capital expenditures; the ability of the Company to<br />
attract the necessary labour required to build its projects; operating<br />
hazards and other difficulties inherent in the exploration for and<br />
production and sale of crude oil and natural gas; availability and<br />
cost of financing; success of exploration and development activities;<br />
timing and success of integrating the business and operations<br />
of acquired companies; production levels; uncertainty of reserve<br />
estimates; actions by governmental authorities; government<br />
regulations and the expenditures required to comply with them<br />
(especially safety and environmental laws and regulations); asset<br />
retirement obligations; and other circumstances affecting revenues<br />
and expenses. The impact of any one factor on a particular<br />
forward-looking statement is not determinable with certainty as<br />
such factors are interdependent, and the Company’s course of<br />
action would depend upon its assessment of the future considering<br />
all information then available. For additional information refer to<br />
“Risks and Uncertainties” on page 64.<br />
Disclosure related to future commodity pricing, production volumes,<br />
royalties, capital expenditures and other 2007 guidance provided<br />
throughout this Management’s Discussion and Analysis, including<br />
the information provided in the “Outlook” section on pages 69 and<br />
70, constitutes forward looking statements as described above.<br />
Statements relating to “reserves” are deemed to be forwardlooking<br />
statements as they involve the implied assessment based<br />
on certain estimates and assumptions that the reserves described<br />
can be profitably produced in the future.<br />
Readers are cautioned that the foregoing list of important factors<br />
is not exhaustive. Although the Company believes that the<br />
expectations conveyed by the forward-looking statements are<br />
reasonable based on information available to it on the date such<br />
forward-looking statements were made, no assurances can be<br />
given as to future results, levels of activity and achievements. All<br />
subsequent forward-looking statements, whether written or oral,<br />
attributable to the Company or persons acting on its behalf are<br />
expressly qualified in their entirety by these cautionary statements.<br />
Except as required by law, the Company assumes no obligation to<br />
update forward-looking statements should circumstances or the<br />
Company’s estimates or opinions change.<br />
SPECIAL NOTE REGARDING NON-GAAP<br />
FINANCIAL MEASURES<br />
Management’s Discussion and Analysis (“MD&A”) includes<br />
references to financial measures commonly used in the crude<br />
oil and natural gas industry, such as cash flow from operations,<br />
adjusted net earnings from operations and net asset value. These<br />
financial measures are not defined by <strong>Canadian</strong> generally accepted<br />
accounting principles (“GAAP”) and therefore are referred to<br />
as non-GAAP measures. The non-GAAP measures used by the<br />
Company may not be comparable to similar measures presented by<br />
other companies. The Company uses these non-GAAP measures to<br />
evaluate its performance. The non-GAAP measures should not be<br />
considered an alternative to or more meaningful than net earnings,<br />
as determined in accordance with <strong>Canadian</strong> GAAP, as an indication<br />
of the Company’s performance.<br />
MANAGEMENT’S DISCUSSION<br />
AND ANALYSIS<br />
Management’s Discussion and Analysis of the financial condition<br />
and results of operations of the Company should be read in<br />
conjunction with the Company’s audited consolidated financial<br />
statements and related notes for the year ended December 31, 2006.<br />
The consolidated financial statements have been prepared in<br />
accordance with <strong>Canadian</strong> GAAP. A reconciliation of <strong>Canadian</strong><br />
GAAP to United States GAAP is included in note 16 to the<br />
consolidated financial statements. All dollar amounts are referenced<br />
in <strong>Canadian</strong> dollars, except where otherwise noted. Common share<br />
data has been restated to reflect the two-for-one share split in<br />
May 2005. The calculation of barrels of oil equivalent (“boe”) is<br />
based on a conversion ratio of six thousand cubic feet (“mcf”) of<br />
natural gas to one barrel (“bbl”) of crude oil to estimate relative<br />
energy content. This conversion may be misleading, particularly<br />
when used in isolation, since the 6 mcf:1 bbl ratio is based on an<br />
energy equivalency at the burner tip and does not represent the<br />
value equivalency at the well head. Production volumes are the<br />
Company’s interest before royalties, and realized prices exclude<br />
the effect of risk management activities, except where noted<br />
otherwise. The following discussion and analysis refers primarily to<br />
the Company’s 2006 financial results compared to 2005 and 2004,<br />
unless otherwise indicated. In addition, this discussion details the<br />
Company’s capital program and outlook for 2007.
Management’s Discussion & Analysis<br />
Page 43 of 107<br />
Certain figures related to the presentation of gross revenues and<br />
gross transportation and blending expense provided for prior years<br />
have been reclassified to conform to the presentation adopted<br />
in 2006.<br />
Additional information relating to the Company, including its quarterly<br />
MD&A for the year and three months ended December 31, 2006<br />
and its Annual Information Form for the year ended December 31,<br />
2006, is available on SEDAR at www.sedar.com.<br />
This MD&A is dated March 15, 2007.<br />
ABBREVIATIONS<br />
ACC Anadarko Canada Corporation<br />
AECO Alberta natural gas reference location<br />
AIF Annual Information Form<br />
API American Petroleum Institute<br />
ARO Asset retirement obligations<br />
bbl barrel<br />
bbl/d barrels per day<br />
boe barrels of oil equivalent<br />
boe/d barrels of oil equivalent per day<br />
Brent Dated Brent<br />
C$ <strong>Canadian</strong> dollars<br />
FPSO Floating Production, Storage and Offtake Vessel<br />
GAAP Generally accepted accounting principles<br />
GJ gigajoule<br />
Heavy Differential Heavy crude oil differential from WTI<br />
Horizon Project Horizon Oil Sands Project<br />
mcf thousand cubic feet<br />
mmbtu million British thermal units<br />
mmcf/d million cubic feet per day<br />
NGLs <strong>Natural</strong> gas liquids<br />
NYMEX New York Mercantile Exchange<br />
NYSE New York Stock Exchange<br />
SCO Synthetic light crude oil<br />
SEC Securities and Exchange Commission<br />
TSX Toronto Stock Exchange<br />
UK United Kingdom<br />
US United States<br />
US$ United States dollars<br />
WTI West Texas Intermediate<br />
OBJECTIVE AND STRATEGY<br />
The Company’s objective is to increase crude oil and natural gas<br />
production, reserves, cash flow and net asset value (1) on a per<br />
common share basis through the development of its existing<br />
crude oil and natural gas properties and through the discovery<br />
and acquisition of new reserves. The Company strives to meet<br />
this objective by having a defined growth and value enhancement<br />
plan for each of its products and segments. The Company takes<br />
a balanced approach to growth and investments and focuses on<br />
creating long-term shareholder wealth. The Company allocates its<br />
capital by maintaining:<br />
� � Balance among its products, namely natural gas, light/medium<br />
crude oil, Pelican Lake crude oil (2) , primary heavy crude oil and<br />
thermal heavy crude oil;<br />
� � Balance among near-, mid- and long-term projects;<br />
� � Balance among acquisitions, exploitation and exploration;<br />
and<br />
� � Balance between sources of debt financing and maintenance<br />
of a strong balance sheet.<br />
(1) Discounted value of conventional crude oil and natural gas reserves and<br />
undeveloped land, less net debt.<br />
(2) Pelican Lake crude oil is 14-17º API oil, but receives medium quality crude<br />
netbacks due to low production costs and low royalty rates.<br />
The Company’s three-phase crude oil marketing strategy includes:<br />
� � Blending various crude oil streams with diluents to create more<br />
attractive feedstock;<br />
� � Supporting and participating in pipeline expansions or new<br />
additions; and<br />
� � Supporting and participating in projects that will increase the<br />
conversion capacity for heavy crude oil.<br />
Operational discipline and cost control are central to the Company.<br />
By controlling costs consistently throughout all cycles of the<br />
industry, the Company believes that it will achieve continued<br />
growth. Cost control is attained by developing area knowledge, by<br />
dominating core areas and by maintaining high working interests<br />
in its properties.<br />
The Company is committed to maintaining its strong financial<br />
position. The Company believes that it has built the necessary<br />
financial capacity to complete the Horizon Project while at the same<br />
time not compromising the delivery of its conventional crude oil<br />
and natural gas growth opportunities. Additionally, the Company’s<br />
risk management hedge program reduces the risk of volatility in<br />
commodity price markets and supports the Company’s cash flow<br />
for its capital expenditures program throughout the construction<br />
period of the Horizon Project.<br />
Strategic accretive acquisitions like the acquisition of ACC are a key<br />
component of the Company’s strategy. The Company has used a<br />
combination of internally generated cash flows and debt financing<br />
to selectively acquire properties generating future cash flows in its<br />
core regions. These targeted acquisitions should provide additional<br />
free cash flow during the construction years of the Horizon Project<br />
while still achieving targeted returns.<br />
Highlights for the year ended December 31, 2006 are as follows:<br />
� � Achieved record levels of net earnings;<br />
� � Achieved record crude oil and NGLs and natural gas<br />
�<br />
production;<br />
� Achieved its revised annual production guidance for crude oil<br />
and NGLs and natural gas;<br />
� � Completed the acquisition of ACC for net cash consideration<br />
of $4,641 million;<br />
� � Completed 57% of Phase 1 construction of the Horizon<br />
Project;<br />
� � Completed all major 2006 milestones on the Horizon Project<br />
before winter’s onset;
<strong>Canadian</strong> <strong>Natural</strong> AR2006<br />
Page 44 of 107<br />
� � Achieved full recovery of the Company’s capital investments in the Primrose North and South Fields;<br />
� � Received Gabonese Government approval of its development plan for the Olowi PSC offshore Gabon and received Board of Directors<br />
sanction for development in November 2006;<br />
� � Delivered first oil from West Espoir and completed a successful infill drilling campaign at East Espoir in the Company’s Offshore West<br />
Africa geographic segment; and<br />
� � Purchased 485,000 common shares for a cost of $28 million under the Company’s Normal Course Issuer Bid.<br />
NET EARNING AND CASH FLOW FROM OPERATIONS<br />
FINANCIAL HIGHLIGHTS<br />
($ millions, except per common share amounts) 2006 2005 2004<br />
Revenue, before royalties (1) $ 11,643 $ 11,130 $ 8,269<br />
Net earnings<br />
Per common share<br />
$ 2,524 $ 1,050 $ 1,405<br />
– basic $ 4.70 $ 1.96 $ 2.62<br />
– diluted $ 4.70 $ 1.95 $ 2.60<br />
Adjusted net earnings from operations (2) Per common share<br />
$ 1,664 $ 2,034 $ 1,405<br />
– basic $ 3.10 $ 3.79 $ 2.62<br />
– diluted $ 3.10 $ 3.78 $ 2.60<br />
Cash flow from operations (3) Per common share<br />
$ 4,932 $ 5,021 $ 3,769<br />
– basic $ 9.18 $ 9.36 $ 7.03<br />
– diluted $ 9.18 $ 9.33 $ 6.98<br />
Dividends declared per common share $ 0.30 $ 0.236 $ 0.200<br />
Total assets $ 33,160 $ 21,852 $ 18,372<br />
Total long-term liabilities $ 19,399 $ 9,790 $ 9,196<br />
Capital expenditures, net of dispositions $ 12,025 $ 4,932 $ 4,633<br />
(1) Blending costs previously netted against gross revenues in prior years have been reclassified to transportation and blending expense to conform to the presentation<br />
adopted in 2006.<br />
(2) Adjusted net earnings from operations is a non-GAAP term that represents net earnings adjusted for certain items of a non-operational nature. The Company<br />
evaluates its performance based on adjusted net earnings from operations. The following reconciliation lists the after-tax effects of certain items of a nonoperational<br />
nature that are included in the Company’s financial results. Adjusted net earnings from operations may not be comparable to similar measures presented<br />
by other companies.<br />
($ millions) 2006 2005 2004<br />
Net earnings as reported $ 2,524 $ 1,050 $ 1,405<br />
Stock-based compensation, net of tax (a) 95 481 168<br />
Unrealized risk management (gain) loss, net of tax (b) (674) 607 (27)<br />
Unrealized foreign exchange loss (gain), net of tax (c) 114 (85) (75)<br />
Effect of statutory tax rate changes on future income tax liabilities (d) (395) (19) (66)<br />
Adjusted net earnings from operations $ 1,664 $ 2,034 $ 1,405<br />
(a) The Company’s employee stock option plan provides for a cash payment option. Accordingly, the intrinsic value of the outstanding vested options is recorded<br />
as a liability on the Company’s balance sheet and periodic changes in the intrinsic value, net of taxes, flow through net earnings, or are capitalized to the<br />
Horizon Project.<br />
(b) Derivative financial instruments not designated as hedges are recorded at fair value on the balance sheet, with changes in fair value, net of taxes, flowing<br />
through net earnings. The amounts ultimately realized may be materially different than reflected in the financial statements due to changes in prices of the<br />
underlying items hedged, primarily crude oil and natural gas.<br />
(c) Unrealized foreign exchange gains and losses result primarily from the translation of US dollar denominated long-term debt to period-end exchange rates and<br />
are immediately recognized in net earnings.<br />
(d) All substantively enacted adjustments in applicable income tax rates are applied to underlying assets and liabilities on the Company’s consolidated balance<br />
sheet in determining future income tax assets and liabilities. The impact of these tax rate changes is recorded in net earnings during the period the legislation<br />
is substantively enacted. Income tax rate changes during 2006 resulted in a reduction of future income tax liabilities of approximately $438 million in North<br />
America, an increase of future income tax liabilities of approximately $110 million in the UK North Sea and a reduction of future income tax liabilities of<br />
approximately $67 million in Offshore West Africa. Jurisdictional income tax rate changes in North America in 2005 resulted in a reduction of future income<br />
tax liabilities of $19 million (2004 - $66 million reduction).
Management’s Discussion & Analysis<br />
Page 45 of 107<br />
(3) Cash flow from operations is a non-GAAP term that represents net earnings adjusted for non-cash items. The Company evaluates its performance based on<br />
cash flow from operations. The Company considers cash flow from operations a key measure as it demonstrates the Company’s ability to generate the cash flow<br />
necessary to fund future growth through capital investment and to repay debt. Cash flow from operations may not be comparable to similar measures presented<br />
by other companies.<br />
($ millions) 2006 2005 2004<br />
Net earnings<br />
Non-cash items:<br />
$ 2,524 $ 1,050 $ 1,405<br />
Depletion, depreciation and amortization 2,391 2,013 1,769<br />
Asset retirement obligation accretion 68 69 51<br />
Stock-based compensation 139 723 249<br />
Unrealized risk management activities (1,013) 925 (40)<br />
Unrealized foreign exchange loss (gain) 134 (103) (94)<br />
Deferred petroleum revenue tax expense (recovery) 37 (9) (45)<br />
Future income tax 652 353 474<br />
Cash flow from operations $ 4,932 $ 5,021 $ 3,769<br />
In 2006, the Company reported record net earnings of $2,524 million compared to net earnings of $1,050 million in 2005<br />
(2004 – $1,405 million). Net earnings for the year ended December 31, 2006 included unrealized after-tax income of $860 million related<br />
to the effects of risk management activities, statutory tax rate changes on future income tax liabilities, fluctuations in foreign exchange<br />
rates and stock-based compensation expense (2005 – unrealized after-tax expenses of $984 million; 2004 – $nil). Excluding these items,<br />
adjusted net earnings from operations for the year ended December 31, 2006 decreased to $1,664 million from $2,034 million in 2005<br />
(2004 – $1,405 million) primarily due to decreased natural gas pricing, increased realized risk management losses, increased production<br />
expense and increased depletion, depreciation and amortization expense, and the impact of a stronger <strong>Canadian</strong> dollar relative to the<br />
US dollar. These factors were partially offset by stronger benchmark crude oil pricing and increased crude oil and NGLs and natural gas<br />
sales volumes.<br />
Operating results in 2006 were impacted by the acquisition of ACC completed in November 2006. The Company completed the acquisition<br />
of ACC, a subsidiary of Anadarko Petroleum Corporation, for net cash consideration of $4,641 million including working capital and other<br />
adjustments. Substantially all of ACC’s land and production base is located in Western Canada and consists of natural gas weighted assets.<br />
The operating results of ACC have been consolidated with the results of the Company effective November 2006. Total production from the<br />
ACC properties averaged approximately 67,600 boe/d for the two months of November and December, while natural gas production from<br />
the ACC properties averaged approximately 354 mmcf/d.<br />
The Company expects that consolidated net earnings will continue to reflect significant volatility due to the impact of risk management<br />
activities, stock-based compensation expense and fluctuations in foreign exchange rates.<br />
The Company’s commodity hedging program reduces the risk of volatility in commodity price markets and supports the Company’s cash<br />
flow for its capital expenditure program throughout the Horizon Project construction period. This program allows for the hedging of up<br />
to 75% of the near 12 months budgeted production, up to 50% of the following 13 to 24 months expected production and up to 25%<br />
of production expected in months 25 to 48. For the purpose of this program, the purchase of crude oil put options is in addition to the<br />
above parameters. In accordance with the policy, approximately 65% of expected crude oil volumes and approximately 75% of expected<br />
natural gas volumes have been hedged for 2007. In addition, 77,000 bbl/d of crude oil volumes are protected by put options for 2007 at<br />
a strike price of US$60.00 per barrel. The Company is extending its hedge program into 2008 whereby 150,000 bbl/d of crude oil volumes<br />
have been hedged (100,000 bbl/d of price collars with a US$60.00 floor and 50,000 bbl/d of put options with a US$55.00 strike price). In<br />
addition, 900,000 GJ/d of natural gas volumes have been hedged through the use of price collars for the first quarter of 2008 (400,000 GJ/d<br />
with a floor of $7.00 and 500,000 GJ/d with a floor of $7.50).<br />
As effective as the Company’s hedges are against reference commodity prices, a portion of the derivative financial instruments entered into by<br />
the Company do not meet the requirements for hedge accounting under GAAP due to currency, product quality and location differentials (the<br />
“non-designated hedges”). The Company is required to mark-to-market these non-designated hedges based on prevailing forward commodity<br />
prices in effect at the end of each reporting period. Accordingly, the unrealized risk management asset reflects, at December 31, 2006,<br />
the implied price differentials for the non-designated hedges for future periods. The cash settlement amount of the risk management<br />
financial derivative instruments may vary materially depending upon the underlying crude oil and natural gas prices at the time of final<br />
settlement of the financial derivative instruments, as compared to their mark-to-market value at December 31, 2006.<br />
Due to the changes in crude oil and natural gas forward pricing, and the reversal of prior year unrealized losses, the Company<br />
recorded a net unrealized gain of $1,013 million ($674 million after-tax) on its risk management activities for the year ended<br />
December 31, 2006 (2005 - $925 million unrealized loss, $607 million after-tax; 2004 - $40 million unrealized gain, $27 million after-tax).<br />
Mark-to-market unrealized gains and losses do not impact the Company’s current cash flow or its ability to finance ongoing capital programs.<br />
The Company continues to believe that its risk management program meets its objective of securing funding for its capital projects and does<br />
not intend to alter its current strategy of obtaining price certainty for its crude oil and natural gas sales.
<strong>Canadian</strong> <strong>Natural</strong> AR2006<br />
Page 46 of 107<br />
The Company also recorded a $139 million ($95 million after-tax) stock-based compensation expense for the year ended December 31, 2006<br />
in connection with the 8% increase in the Company’s share price for the year ended December 31, 2006 (Company’s share price as at:<br />
December 31, 2006 – C$62.15; December 31, 2005 – C$57.63; December 31, 2004 – C$25.63; December 31, 2003 – C$16.34). As<br />
required by GAAP, the Company records a liability for potential cash payments to settle its outstanding employee stock options, based on<br />
the difference between the exercise price of the stock options and the market price of the Company’s common shares, pursuant to a graded<br />
vesting schedule. The liability is revalued at each balance sheet date to reflect the changes in the market price of the Company’s common<br />
shares and the options exercised or surrendered in the year, with the net change recognized in earnings, or capitalized as part of the Horizon<br />
Project during the construction period. The stock-based compensation liability reflected the Company’s potential cash liability should all the<br />
vested options be surrendered for a cash payout at the market price on December 31, 2006. In years when substantial share price changes<br />
occur, the Company’s net earnings are subject to significant volatility. The Company utilizes its stock-based compensation plan to attract and<br />
retain employees in a competitive environment. All employees participate in this plan.<br />
Cash flow from operations for the year ended December 31, 2006 decreased slightly to $4,932 million ($9.18 per common share) from<br />
$5,021 million ($9.36 per common share) in 2005 (2004 – $3,769 million or $7.03 per common share). The decrease was primarily due<br />
to decreased natural gas pricing, increased realized risk management losses, increased production expense and the impact of a stronger<br />
<strong>Canadian</strong> dollar relative to the US dollar. These factors were partially offset by stronger benchmark crude oil pricing and increased sales<br />
volumes.<br />
In 2006, the Company’s average sales price per bbl of crude oil and NGLs increased to $53.65 per bbl from $46.86 per bbl in 2005<br />
(2004 – $37.99 per bbl). The Company’s average natural gas price decreased to $6.72 per mcf from $8.57 per mcf in 2005<br />
(2004 – $6.50 per mcf).<br />
Total production of crude oil and NGLs before royalties increased to a record 331,998 bbl/d from 313,168 bbl/d in 2005<br />
(2004 – 282,489 bbl/d). The increase in crude oil and NGLs production primarily reflected increased production from the Company’s<br />
Primrose thermal projects, the positive results from the Pelican Lake waterflood project, the acquisition of ACC, development of West and<br />
East Espoir and the full year’s impact of production from the Baobab Field located offshore Côte d’Ivoire. Production from the Baobab Field<br />
commenced August 2005.<br />
Total natural gas production before royalties increased to 1,492 mmcf/d from 1,439 mmcf/d in 2005 (2004 – 1,388 mmcf/d). The increase<br />
in natural gas production primarily reflected additional natural gas production from the ACC acquisition. The increase was partially offset by<br />
the production decrease due to the effects of the Company’s strategic reduction in natural gas drilling activity and increased North America<br />
crude oil drilling, made in response to sustained low natural gas prices and inflationary cost pressures.<br />
Total crude oil and NGLs and natural gas production volumes before royalties increased to 580,724 boe/d from 552,960 boe/d in 2005<br />
(2004 – 513,835 boe/d).<br />
Operating highlights 2006 2005 2004<br />
Crude oil and NGLs ($/bbl) (1)<br />
Sales price (2) $ 53.65 $ 46.86 $ 37.99<br />
Royalties 4.48 3.97 3.16<br />
Production expense 12.29 11.17 10.05<br />
Netback $ 36.88 $ 31.72 $ 24.78<br />
<strong>Natural</strong> gas ($/mcf) (1)<br />
Sales price (2) $ 6.72 $ 8.57 $ 6.50<br />
Royalties 1.29 1.75 1.35<br />
Production expense 0.82 0.73 0.67<br />
Netback $ 4.61 $ 6.09 $ 4.48<br />
Barrels of oil equivalent ($/boe) (1)<br />
Sales price (2) $ 47.92 $ 48.77 $ 38.45<br />
Royalties 5.89 6.82 5.37<br />
Production expense 9.14 8.21 7.35<br />
Netback $ 32.89 $ 33.74 $ 25.73<br />
(1) Amounts expressed on a per unit basis are based on sales volumes.<br />
(2) Net of transportation and blending costs and excluding risk management activities.
Management’s Discussion & Analysis<br />
Page 47 of 107<br />
SUMMARY OF QUARTERLY RESULTS<br />
The following is a summary of the Company’s quarterly results for the most recently completed quarters:<br />
($ millions, except per common share amounts)<br />
2006 Total Dec 31 Sep 30 Jun 30 Mar 31<br />
Revenue, before royalties (1) $ 11,643 $ 2,826 $ 3,108 $ 3,041 $ 2,668<br />
Net earnings<br />
Net earnings per common share<br />
$ 2,524 $ 313 $ 1,116 $ 1,038 $ 57<br />
– basic $ 4.70 $ 0.58 $ 2.08 $ 1.93 $ 0.11<br />
– diluted $ 4.70 $ 0.58 $ 2.08 $ 1.93 $ 0.11<br />
2005 Total Dec 31 Sep 30 Jun 30 Mar 31 (2)<br />
Revenue, before royalties (1) $ 11,130 $ 3,319 $ 3,163 $ 2,420 $ 2,228<br />
Net earnings (loss)<br />
Net earnings (loss) per common share<br />
$ 1,050 $ 1,104 $ 151 $ 219 $ (424)<br />
– basic $ 1.96 $ 2.06 $ 0.28 $ 0.41 $ (0.79)<br />
– diluted $ 1.95 $ 2.06 $ 0.28 $ 0.41 $ (0.79)<br />
(1) Blending costs previously netted against gross revenues in prior periods have been reclassified to transportation expense to conform to the presentation adopted in<br />
the fourth quarter of 2006.<br />
(2) Restated to reflect two-for-one share split in May 2005.<br />
The Company’s quarterly consolidated revenues increased 27% to $2,826 million in the fourth quarter of 2006 from $2,228 million in the<br />
first quarter of 2005. Quarterly revenues during 2006 primarily reflected increased world benchmark crude oil prices and increased crude oil<br />
and NGLs and natural gas sales volumes, partially offset by decreased natural gas prices. Quarterly revenues during 2005 primarily reflected<br />
increased world benchmark crude oil and natural gas prices and increased crude oil and NGLs and natural gas sales volumes.<br />
� � Crude oil prices reflected demand growth and continuing geopolitical uncertainties. Hurricane activity in the Gulf of Mexico in the third<br />
quarter of 2005 further contributed to increased world benchmark crude oil pricing. As a result, the Company’s realized crude oil and<br />
NGLs price increased from C$39.81 per bbl for the first quarter of 2005 to C$47.27 per bbl for the fourth quarter of 2006. Realized<br />
natural gas prices decreased in 2006 from 2005 primarily due to decreased heating demand during the winter months and decreased<br />
cooling demand during the summer months. The Company’s realized natural gas price decreased slightly from C$6.68 per mcf for the<br />
first quarter of 2005 to C$6.66 per mcf for the fourth quarter of 2006<br />
� � A stronger <strong>Canadian</strong> dollar reduced the <strong>Canadian</strong> dollar sales price the Company received for its crude oil sales, as crude oil prices are<br />
based on US dollar denominated benchmarks. The US / <strong>Canadian</strong> dollar average exchange rate increased from 0.8152 for the first<br />
quarter of 2005 to 0.8781 for the fourth quarter of 2006.<br />
� � Crude oil and NGLs and natural gas sales volumes increased in 2006 over 2005. The increase in crude oil and NGLs production from<br />
2005 primarily reflected increased production from the Company’s Primrose thermal projects, the positive results from the Pelican Lake<br />
waterflood project, additional production volumes from the ACC acquisition, development of West and East Espoir and the full year’s<br />
impact of production from the Baobab Field located offshore Côte d’Ivoire. Production from the Baobab Field commenced August<br />
2005. The increase in natural gas production from 2005 primarily reflected additional natural gas production from the ACC acquisition.<br />
The increase was partially offset by production decreases due to the effects of the Company’s strategic reduction in natural gas drilling<br />
activity and increased North America crude oil drilling, made in response to sustained low natural gas prices and inflationary cost<br />
pressures. In total, daily production increased from 530,316 boe/d day in the first quarter of 2005 to 613,764 boe/d for the fourth<br />
quarter of 2006.<br />
In addition to commodity prices and sales volumes, quarterly net earnings were impacted by:<br />
� � Increased production expense primarily due to the ACC acquisition and industry-wide inflationary cost pressures.<br />
� � Increased depletion, depreciation and amortization expense primarily due to increased finding and development costs associated with<br />
crude oil and natural gas exploration in North America, a higher depletion base due to the acquisition of ACC and increased estimated<br />
future costs to develop the Company’s proved undeveloped reserves.<br />
� � Unrealized expense (recovery) due to the mark-to-market treatment of the Company’s stock-based compensation liability.<br />
� � Unrealized gains and losses from the mark-to-market treatment of the Company’s commodity price hedges not designated as hedges<br />
for accounting purposes.<br />
� � Unrealized foreign exchange gains and losses due to the fluctuation of the <strong>Canadian</strong> dollar in relation to the US dollar with respect to<br />
the US dollar debt and working capital in North America denominated in US dollars, as well as the re-measurement of North Sea future<br />
income tax liabilities denominated in UK pounds sterling.<br />
� � Jurisdictional corporate tax rate changes substantively enacted in the period.
<strong>Canadian</strong> <strong>Natural</strong> AR2006<br />
Page 48 of 107<br />
BUSINESS ENVIRONMENT<br />
(Yearly average) 2006 2005 2004<br />
WTI benchmark price (US$/bbl) (1) $ 66.25 $ 56.61 $ 41.43<br />
Dated Brent benchmark price (US$/bbl) $ 65.18 $ 54.45 $ 38.28<br />
Differential to LLB blend (US$/bbl) $ 21.69 $ 20.83 $ 13.44<br />
Differential to LLB blend as a%ofWTI 33% 37% 32%<br />
Condensate benchmark price (US$/bbl) $ 66.24 $ 57.25 $ 41.62<br />
NYMEX benchmark price (US$/mmbtu) $ 7.26 $ 8.56 $ 6.09<br />
AECO benchmark price (C$/GJ) $ 6.62 $ 8.05 $ 6.43<br />
US/<strong>Canadian</strong> dollar average exchange rate (US$) $ 0.8818 $ 0.8253 $ 0.7683<br />
(1) Refers to West Texas Intermediate crude oil prices per barrel at Cushing, Oklahoma.<br />
COMMODITY PRICES<br />
World benchmark crude oil prices increased during the first part of 2006 due to ongoing demand growth and geopolitical<br />
uncertainties. However, pricing significantly declined later in the year, reflecting higher crude oil inventories. In December 2006,<br />
WTI averaged US$62.09 per bbl, a decline of 21% from the record high of US$78.40 per bbl reached in July 2006. WTI averaged US$66.25<br />
per bbl in 2006, an increase of 17% compared to US$56.61 per bbl in 2005 (2004 – US$41.43 per bbl).<br />
The Company’s realized crude oil price increased from 2005 as a result of the increased WTI price and the narrower Heavy Differential. Heavy<br />
Differentials averaged 33% for 2006 compared to 37% for 2005 (2004 – 32%). The narrowing of the Heavy Differentials from 2005 was<br />
primarily due to reduced availability of imported grades from Venezuela and Mexico, reduced <strong>Canadian</strong> production of heavy crude oil and<br />
the removal of logistical constraints in accessing new markets in the US Gulf Coast due to the Pegasus and Spearhead pipelines commencing<br />
operations during 2006. The increase in realized crude oil prices from 2005 was partially offset by the negative impact of a strengthening<br />
<strong>Canadian</strong> dollar relative to the US dollar. A strengthening <strong>Canadian</strong> dollar reduces the <strong>Canadian</strong> dollar sales price the Company receives for<br />
its crude oil sales, as crude oil prices are based on US dollar denominated benchmarks.<br />
The Company anticipates continued volatility in the crude oil markets as inventory levels remain high and given the unpredictable nature of<br />
geopolitical events.<br />
Brent averaged US$65.18 per bbl in 2006, an increase of 20% compared to US$54.45 per bbl in 2005 (2004 – US$38.28 per bbl). Crude<br />
oil sales contracts for the Company’s North Sea and Offshore West Africa segments are typically based on Brent pricing, which has benefited<br />
from strong European and Asian demand in 2006.<br />
NYMEX natural gas prices averaged US$7.26 per mmbtu in 2006, a decrease of 15% from US$8.56 per mmbtu in 2005 (2004 – US$6.09<br />
per mmbtu). AECO natural gas pricing in 2006 decreased 18% from 2005 to average C$6.62 per GJ. The decrease in natural gas pricing in<br />
2006 from 2005 reflected the impact of exceptionally mild winter weather and reduced heating demand, relatively stable summer weather<br />
and reduced cooling demand, and the continuing impact of high natural gas inventory levels.<br />
The Company anticipates a challenging natural gas pricing environment in the near term given the high storage levels. Longer term natural<br />
gas pricing will continue to be largely weather dependent.<br />
OPERATING AND CAPITAL COSTS<br />
Strong commodity prices in recent years have resulted in increased demand and costs for oilfield services worldwide. This has lead to<br />
inflationary production and capital cost pressures throughout the North American crude oil and natural gas industry, particularly related to<br />
natural gas drilling activity and oil sands developments. The strong commodity price environment has also impacted costs in international<br />
basins. Specifically, the high demand for offshore drilling rigs continues and securing rigs on commercially acceptable terms is an ongoing<br />
challenge.<br />
The oil and gas industry is also experiencing cost pressures related to increasingly stringent environmental regulations, both in North America<br />
and internationally. In addition, environmental regulations in Canada intended to reduce greenhouse gas emissions are pending and the<br />
impact of the legislation is uncertain at this time.<br />
These increased cost pressures and environmental regulations may adversely impact the Company’s future net earnings, cash flow and<br />
increase the costs of capital projects.
Management’s Discussion & Analysis<br />
Page 49 of 107<br />
REVENUE, BEFORE ROYALTIES<br />
ANALYSIS OF CHANGES IN REVENUE, BEFORE ROYALTIES<br />
Changes due to Changes due to<br />
($ millions)<br />
North America<br />
Crude oil<br />
2004 Volumes Prices Other 2005 Volumes Prices Other 2006<br />
and NGLs (1) $ 3,300 $ 170 $ 847 $ – $ 4,317 $ 198 $ 747 $ – $ 5,262<br />
<strong>Natural</strong> gas 3,401 208 1,029 – 4,638 168 (1,002) – 3,804<br />
North Sea<br />
6,701 378 1,876 – 8,955 366 (255) – 9,066<br />
Crude oil and NGLs 1,223 31 382 – 1,636 (168) 132 – 1,600<br />
<strong>Natural</strong> gas 94 (59) (12) – 23 (4) (3) – 16<br />
1,317 (28) 370 – 1,659 (172) 129 – 1,616<br />
Offshore West Africa<br />
Crude oil and NGLs 208 182 86 – 476 344 111 – 931<br />
<strong>Natural</strong> gas 14 (6) 1 – 9 12 (2) – 19<br />
222 176 87 – 485 356 109 – 950<br />
Subtotal<br />
Crude oil and NGLs 4,731 383 1,315 – 6,429 374 990 – 7,793<br />
<strong>Natural</strong> gas 3,509 143 1,018 – 4,670 176 (1,007) – 3,839<br />
8,240 526 2,333 – 11,099 550 (17) – 11,632<br />
Midstream 68 – – 9 77 – – (5) 72<br />
Intersegment eliminations<br />
and other (2) (39) – – (7) (46) – – (15) (61)<br />
Total $ 8,269 $ 526 $ 2,333 $ 2 $ 11,130 $ 550 $ (17) $ (20) $ 11,643<br />
(1) Blending costs previously netted against gross revenues in prior years have been reclassified to transportation and blending expense to conform to the presentation<br />
adopted in 2006.<br />
(2) Eliminates primarily internal transportation and electricity charges.<br />
Revenue increased 5% to $11,643 million in 2006 from $11,130 million in 2005 (2004 – $8,269 million). The increase was primarily due to<br />
increased crude oil and NGLs and natural gas sales volumes in North America and Offshore West Africa and increased realized crude oil and<br />
NGLs prices, partially offset by decreased realized natural gas prices.<br />
In 2006, 22% of the Company’s crude oil and natural gas revenue was generated outside of North America (2005 – 19%; 2004 – 19%).<br />
North Sea accounted for 14% of crude oil and natural gas revenue in 2006 (2005 – 15%; 2004 – 16%), and Offshore West Africa<br />
accounted for 8% of crude oil and natural gas revenue in 2006 (2005 – 4%; 2004 – 3%).<br />
ANALYSIS OF PRODUCT PRICES (1)<br />
2006 2005 2004<br />
Crude oil and NGLs ($/bbl) (2)<br />
North America $ 46.52 $ 39.62 $ 33.16<br />
North Sea $ 72.62 $ 66.57 $ 51.37<br />
Offshore West Africa $ 67.99 $ 59.91 $ 49.05<br />
Company average<br />
<strong>Natural</strong> gas ($/mcf)<br />
$ 53.65 $ 46.86 $ 37.99<br />
(2)<br />
North America $ 6.77 $ 8.65 $ 6.61<br />
North Sea $ 2.66 $ 3.17 $ 3.73<br />
Offshore West Africa $ 5.37 $ 5.91 $ 5.25<br />
Company average $ 6.72 $ 8.57 $ 6.50<br />
Company average ($/boe) (2) Percentage of revenue (excluding midstream revenue)<br />
$ 47.92 $ 48.77 $ 38.45<br />
Crude oil and NGLs 64% 54% 54%<br />
<strong>Natural</strong> gas 36% 46% 46%<br />
(1) Net of transportation and blending costs and excluding risk management activities.<br />
(2) Amounts expressed on a per unit basis are based on sales volumes.<br />
Realized crude oil and NGLs prices increased 14% to average $53.65 per bbl in 2006 from $46.86 per bbl in 2005 (2004 – $37.99 per bbl).<br />
The increase from 2005 was due to increased benchmark crude oil prices and a narrower Heavy Differential, partially offset by the impact<br />
of a stronger <strong>Canadian</strong> dollar.<br />
The Company’s realized natural gas price decreased 22% to average $6.72 per mcf in 2006 from $8.57 per mcf in 2005<br />
(2004 – $6.50 per mcf), reflecting record levels of natural gas inventory in North America, primarily due to the impact of exceptionally mild<br />
winter weather in 2006 that reduced heating demand and relatively stable summer weather that reduced cooling demand.
<strong>Canadian</strong> <strong>Natural</strong> AR2006<br />
Page 50 of 107<br />
NORTH AMERICA<br />
North America realized crude oil prices increased 17% to average $46.52 per bbl in 2006 from $39.62 per bbl in 2005 (2004 – $33.16<br />
per bbl). The increase from 2005 was due to increased benchmark crude oil prices and a narrower Heavy Differential, partially offset by the<br />
impact of a stronger <strong>Canadian</strong> dollar.<br />
In North America, the Company continues to focus on its crude oil marketing strategy, including the development of a blending strategy<br />
that expands markets within current pipeline infrastructure, supporting pipeline projects that will provide capacity to transport crude oil to<br />
new markets, and working with refiners to add incremental heavy crude oil conversion capacity. During 2006, the Company contributed<br />
approximately 136,000 bbl/d of heavy crude oil blends to the Western <strong>Canadian</strong> Select (“WCS”) stream. The Company also continues to<br />
work with refiners to advance expansion of heavy crude oil conversion capacity, and is working with pipeline companies to develop new<br />
capacity to the <strong>Canadian</strong> West Coast and the US Gulf Coast where crude oil cargos can be sold on a world-wide basis. With a view to<br />
expanding markets for its heavy crude oil, the Company has committed to 25,000 bbl/d of capacity on the Pegasus Pipeline, which carries<br />
crude oil to the Gulf of Mexico. The Pegasus Pipeline is made up of a series of segments extending from Patoka, Illinois to Nederland,<br />
Texas, near the Gulf Coast. The Company’s first sales from the Pegasus Pipeline occurred in April 2006. The Company also entered into an<br />
agreement to supply 25,000 bbl/d of heavy crude oil production to a new merchant upgrader to be constructed in Alberta. The agreement<br />
is for a period of five years, with first deliveries anticipated to occur in 2010 upon completion of construction of the facilities.<br />
North America realized natural gas prices decreased 22% to average $6.77 per mcf in 2006 from $8.65 per mcf in 2005 (2004 – $6.61 per<br />
mcf), primarily due to reduced seasonal heating demand and reduced summer cooling demand in 2006.<br />
A comparison of the price received for the Company’s North America production by product type is as follows:<br />
2006 2005 2004<br />
(1) (2)<br />
Wellhead price<br />
Light crude oil and NGLs (C$/bbl) $ 63.09 $ 58.41 $ 45.90<br />
Pelican Lake crude oil (C$/bbl) $ 45.02 $ 38.39 $ 32.12<br />
Primary heavy crude oil (C$/bbl) $ 41.35 $ 33.53 $ 28.99<br />
Thermal heavy crude oil (C$/bbl) $ 40.98 $ 32.29 $ 29.00<br />
<strong>Natural</strong> gas (C$/mcf) $ 6.77 $ 8.65 $ 6.61<br />
(1) Net of transportation and blending costs and excluding risk management activities.<br />
(2) Amounts expressed on a per unit basis are based on sales volumes.<br />
NORTH SEA<br />
North Sea realized crude oil prices increased 9% to average $72.62 per bbl in 2006 from $66.57 per bbl 2005 (2004 – $51.37<br />
per bbl). The increase in the realized crude oil price from 2005 was due primarily to the impact of strong European and Asian demand on<br />
Brent pricing, partially offset by the strengthening <strong>Canadian</strong> dollar in 2006 compared to 2005.<br />
OFFSHORE WEST AFRICA<br />
Offshore West Africa realized crude oil prices increased 13% to average $67.99 per bbl in 2006 from $59.91 per bbl in 2005<br />
(2004 – $49.05 per bbl). The increase in the realized crude oil price from 2005 was due primarily to the impact of strong European and Asian<br />
demand on Brent pricing, partially offset by the strengthening <strong>Canadian</strong> dollar in 2006 compared to 2005.<br />
CRUDE OIL INVENTORY VOLUMES<br />
The Company recognizes revenue on its crude oil production when title transfers to the customer and delivery has taken place. The related<br />
cumulative crude oil inventory volumes by segment, which have not been recognized in revenue, were as follows:<br />
(bbl) 2006 2005<br />
North America, related to pipeline fill 1,097,526 484,157<br />
North Sea, related to timing of liftings 910,796 747,141<br />
Offshore West Africa, related to timing of liftings 113,774 412,841<br />
2,122,096 1,644,139<br />
In 2006, approximately 478,000 barrels of crude oil produced in the Company’s North America and international operations were added to<br />
inventory and excluded from results of operations, decreasing cash flow from operations for the year by approximately $7 million.
Management’s Discussion & Analysis<br />
Page 51 of 107<br />
ANALYSIS OF DAILY PRODUCTION, BEFORE ROYALTIES<br />
2006 2005 2004<br />
Crude oil and NGLs (bbl/d)<br />
North America 235,253 221,669 206,225<br />
North Sea 60,056 68,593 64,706<br />
Offshore West Africa 36,689 22,906 11,558<br />
<strong>Natural</strong> gas (mmcf/d)<br />
331,998 313,168 282,489<br />
North America 1,468 1,416 1,330<br />
North Sea 15 19 50<br />
Offshore West Africa 9 4 8<br />
1,492 1,439 1,388<br />
Total barrels of oil equivalent (boe/d)<br />
Product mix<br />
580,724 552,960 513,835<br />
Light crude oil and NGLs 26% 26% 24%<br />
Pelican Lake crude oil 5% 4% 4%<br />
Primary heavy crude oil 16% 17% 19%<br />
Thermal heavy crude oil 11% 10% 8%<br />
<strong>Natural</strong> gas 42% 43% 45%<br />
DAILY PRODUCTION, NET OF ROYALTIES<br />
2006 2005 2004<br />
Crude oil and NGLs (bbl/d)<br />
North America 205,382 191,751 180,011<br />
North Sea 59,940 68,487 64,598<br />
Offshore West Africa 35,212 22,293 11,221<br />
<strong>Natural</strong> gas (mmcf/d)<br />
300,534 282,531 255,830<br />
North America 1,185 1,125 1,048<br />
North Sea 15 18 50<br />
Offshore West Africa 9 4 7<br />
1,209 1,147 1,105<br />
Total barrels of oil equivalent (boe/d) 502,024 473,742 440,022<br />
The Company’s business approach is to maintain large project inventories and production diversification among each of the commodities it<br />
produces; namely natural gas, light/medium crude oil and NGLs, Pelican Lake crude oil, primary heavy crude oil and thermal heavy crude oil.<br />
Total production of crude oil and NGLs before royalties increased 6% to 331,998 bbl/d from 313,168 bbl/d in 2005 (2004 – 282,489 bbl/d).<br />
The increase in crude oil and NGLs production from 2005 reflected increased production from the Company’s Primrose thermal projects, the<br />
positive results from the Pelican Lake waterflood project, additional production volumes from the ACC acquisition, development of West<br />
and East Espoir and the full year’s impact of production from the Baobab Field located offshore Côte d’Ivoire. Production from the Baobab<br />
Field commenced August 2005. Crude oil and NGLs production for 2006 was in line with the Company’s revised guidance of 325,000 to<br />
336,000 bbl/d.<br />
<strong>Natural</strong> gas production continues to represent the Company’s largest product offering. Total natural gas production before royalties increased<br />
4% to 1,492 mmcf/d from 1,439 mmcf/d in 2005 (2004 – 1,388 mmcf/d). The increase in natural gas production from 2005 primarily<br />
reflected additional natural gas production from the ACC acquisition. The increase was partially offset by production decreases due to the<br />
impact of the Company’s decision to reduce natural gas drilling activity in 2006, made in response to inflationary costs in Western Canada.<br />
<strong>Natural</strong> gas production for 2006 was at the bottom end of the Company’s revised guidance of 1,492 to 1,501 mmcf/d.<br />
In 2007, annual production is forecasted to average between 315,000 and 360,000 bbl/d of crude oil and NGLs and between 1,594 and<br />
1,664 mmcf/d of natural gas.<br />
NORTH AMERICA<br />
North America crude oil and NGLs production in 2006 increased 6% to average 235,253 bbl/d from 221,669 bbl/d in 2005 (2004 – 206,225<br />
bbl/d). The increase in production from 2005 was primarily due to increased production from the Company’s Primrose thermal projects, the<br />
positive results from the Pelican Lake waterflood project and the ACC acquisition.<br />
North America natural gas production in 2006 increased 4% to average 1,468 mmcf/d from 1,416 mmcf/d in 2005 (2004 – 1,330 mmcf/d).<br />
The increase in natural gas production from 2005 reflected the ACC acquisition, partially offset by production declines due to the Company’s<br />
decision to reduce natural gas drilling activity. The ACC acquisition was completed in November with results included from that date. To<br />
date, the ACC properties are performing as expected.
<strong>Canadian</strong> <strong>Natural</strong> AR2006<br />
Page 52 of 107<br />
NORTH SEA<br />
North Sea crude oil production in 2006 was 60,056 bbl/d, a decrease of 12% from 68,593 bbl/d in 2005 (2004 – 64,706 bbl/d). Production<br />
levels in 2006 were in line with expectations, reflecting the production effects of planned maintenance shutdowns in the second half of<br />
2006.<br />
OFFSHORE WEST AFRICA<br />
Offshore West Africa crude oil production in 2006 increased 60% to 36,689 bbl/d from 22,906 bbl/d in 2005 (2004 – 11,558 bbl/d). The<br />
increase from 2005 was primarily due to the impact of a full year’s production from the Baobab Field, first crude oil from West Espoir and a<br />
successful infill drilling campaign at East Espoir. The increase was partially offset by continuing challenges with sand and solids production<br />
at the Baobab Field that resulted in the shut in of 5 production wells. The Company does not plan to recomplete these wells until such time<br />
as a deepwater rig can be secured on commercially acceptable terms.<br />
ROYALTIES<br />
2006 2005 2004<br />
Crude oil and NGLs ($/bbl) (1)<br />
North America $ 5.86 $ 5.37 $ 4.21<br />
North Sea $ 0.13 $ 0.10 $ 0.08<br />
Offshore West Africa $ 2.81 $ 1.62 $ 1.43<br />
Company average<br />
<strong>Natural</strong> gas ($/mcf)<br />
$ 4.48 $ 3.97 $ 3.16<br />
(1)<br />
North America $ 1.31 $ 1.78 $ 1.40<br />
North Sea $ – $ – $ –<br />
Offshore West Africa $ 0.22 $ 0.16 $ 0.15<br />
Company average $ 1.29 $ 1.75 $ 1.35<br />
Company average ($/boe) (1) Percentage of revenue<br />
$ 5.89 $ 6.82 $ 5.37<br />
(2)<br />
Crude oil and NGLs 8% 8% 8%<br />
<strong>Natural</strong> gas 19% 20% 21%<br />
Boe 12% 14% 14%<br />
(1) Amounts expressed on a per unit basis are based on sales volumes.<br />
(2) Net of transportation and blending costs and excluding risk management activities.<br />
NORTH AMERICA<br />
Crown Royalties on a significant portion of North America crude oil and NGLs production falls under the oil sands royalty regime and is<br />
calculated on a project by project basis as a percentage of gross revenue less operating, capital and abandonment costs (“net profit”).<br />
Royalties are calculated as 1% of gross revenues until the Company’s capital investments in the applicable project are fully recovered, at<br />
which time the royalty increases to 25% of net profit.<br />
Crude oil and NGLs royalties increased in 2006 primarily due to increased crude oil prices and the full recovery of the Company’s capital<br />
investments in the Primrose North and South Fields in the second half of the year. Upon full recovery, Crown royalty rates on the Primrose<br />
North and South Fields increased from 1% of gross revenue to 25% of net profit. North America crude oil and NGLs royalties per bbl are<br />
anticipated to be 14% to 16% of gross revenue in 2007, an increase from 13% in 2006 (2005 – 14%; 2004 – 13%).<br />
<strong>Natural</strong> gas royalties per mcf decreased from 2005 primarily due to decreased benchmark natural gas prices. Benchmark natural gas prices<br />
decreased primarily in response to reduced demand and increased storage levels. North America natural gas royalties per mcf are anticipated<br />
to be 21% to 23% of gross revenue in 2007, an increase from 19% in 2006 (2005 – 21%; 2004 – 21%).<br />
NORTH SEA<br />
North Sea government royalties on crude oil were eliminated effective January 1, 2003. The remaining North Sea royalty represents a gross<br />
overriding royalty on the Ninian Field.<br />
OFFSHORE WEST AFRICA<br />
Offshore West Africa production is governed by the terms of the various Production Sharing Contracts (“PSCs”). Under the PSCs, revenues<br />
are divided into cost recovery revenue and profit revenue. Cost recovery revenue allows the Company to recover its capital and operating<br />
costs and the costs carried by the Company on behalf of the Government State Oil Company. These revenues are reported as sales revenue.<br />
Profit revenue is allocated to the joint venture partners in accordance with their respective equity interests, after a portion has been allocated<br />
to the Government. The Government’s share of profit revenue attributable to the Company’s equity interest is allocated to royalty expense<br />
and current income tax expense in accordance with the PSCs. The Company’s capital investments in the Espoir Field are expected to be fully<br />
recovered early in 2007, increasing royalty rates and current income taxes in accordance with the PSCs. The Company’s capital investments<br />
in the Baobab Field are now not expected to be fully recovered until approximately 2012 due to the ongoing production curtailments<br />
resulting from limitations to sand screen effectiveness.
Management’s Discussion & Analysis<br />
Page 53 of 107<br />
In connection with corporate income tax rate reductions enacted by the Government of Côte d’Ivoire during the year that were effective<br />
January 1, 2006, royalty rates as a percentage of gross revenue increased from approximately 3% in 2005 to approximately 4% in 2006.<br />
As a result, production volumes net of royalties decreased approximately 2% in 2006 from 2005, in accordance with the terms of the<br />
PSC’s. Royalty rates in 2007 are anticipated to be 13% to 15% of gross revenue due to the Company’s expected full recovery of its capital<br />
investments in the Espoir Field.<br />
PRODUCTION EXPENSE<br />
2006 2005 2004<br />
Crude oil and NGLs ($/bbl) (1)<br />
North America $ 11.73 $ 10.49 $ 8.94<br />
North Sea $ 17.57 $ 14.94 $ 14.03<br />
Offshore West Africa $ 7.45 $ 6.50 $ 7.59<br />
Company average<br />
<strong>Natural</strong> gas ($/mcf)<br />
$ 12.29 $ 11.17 $ 10.05<br />
(1)<br />
North America $ 0.81 $ 0.71 $ 0.62<br />
North Sea $ 1.40 $ 2.44 $ 2.07<br />
Offshore West Africa $ 1.19 $ 1.05 $ 1.33<br />
Company average $ 0.82 $ 0.73 $ 0.67<br />
Company average ($/boe) (1) $ 9.14 $ 8.21 $ 7.35<br />
(1) Amounts expressed on a per unit basis are based on sales volumes.<br />
NORTH AMERICA<br />
North America crude oil and NGLs production expense in 2006 increased 12% to $11.73 per bbl from $10.49 per bbl in 2005 (2004 - $8.94<br />
per bbl). The increase in production expense from 2005 was primarily due to increased industry wide service costs and increased cyclic<br />
steaming costs related to the Company’s thermal crude oil projects, due to the timing of secondary steaming cycles.<br />
North America natural gas production expense in 2006 increased 14% to $0.81 per mcf from $0.71 per mcf in 2005 (2004 - $0.62 per<br />
mcf), due to increased cost pressures.<br />
Production expense per boe in 2007 is anticipated to continue to reflect industry wide inflationary cost pressures.<br />
NORTH SEA<br />
North Sea crude oil production expense increased on a per barrel basis from 2005 due to planned maintenance shutdowns, varying sales<br />
volumes on a relatively fixed cost base and the timing of liftings from various fields.<br />
OFFSHORE WEST AFRICA<br />
Offshore West Africa crude oil production expense on a per barrel basis increased from 2005 primarily due to continuing operating challenges<br />
with sand and solids resulting in decreased production volumes at Baobab, on a relatively fixed operating cost base.<br />
MIDSTREAM<br />
($ millions) 2006 2005 2004<br />
Revenue $ 72 $ 77 $ 68<br />
Production expense 23 24 20<br />
Midstream cash flow 49 53 48<br />
Depreciation 8 8 7<br />
Segment earnings before taxes $ 41 $ 45 $ 41<br />
The Company’s midstream assets consist of three crude oil pipeline systems and a 50% working interest in an 84-megawatt cogeneration<br />
plant at Primrose. Approximately 80% of the Company’s heavy crude oil production is transported to international mainline liquid pipelines<br />
via the 100% owned and operated ECHO Pipeline, the 62% owned and operated Pelican Lake Pipeline and the 15% owned Cold Lake<br />
Pipeline. The midstream pipeline assets allow the Company to control the transport of its own production volumes as well as earn third party<br />
revenue. This transportation control enhances the Company’s ability to manage the full range of costs associated with the development and<br />
marketing of its heavier crude oil.
<strong>Canadian</strong> <strong>Natural</strong> AR2006<br />
Page 54 of 107<br />
DEPLETION, DEPRECIATION AND AMORTIZATION (1)<br />
($ millions, except per boe amounts) (2) 2006 2005 2004<br />
North America $ 1,897 $ 1,595 $ 1,444<br />
North Sea 297 306 265<br />
Offshore West Africa 189 104 53<br />
Expense $ 2,383 $ 2,005 $ 1,762<br />
$/boe $ 11.27 $ 10.02 $ 9.37<br />
(1) DD&A excludes depreciation on midstream assets.<br />
(2) Amounts expressed on a per unit basis are based on sales volumes.<br />
Depletion, Depreciation and Amortization (“DD&A”) expense in 2006 increased 19% to $2,383 million from $2,005 million in 2005<br />
(2004 – $1,762 million). The increase in DD&A expense in total and on a boe basis in 2006 from 2005 was primarily as a result of increased<br />
production combined with overall increases in finding and development costs associated with crude oil and natural gas exploration in North<br />
America, a higher depletion base due to the acquisition of ACC, and increased estimated future costs to develop the Company’s proved<br />
undeveloped reserves.<br />
ASSET RETIREMENT OBLIGATION ACCRETION<br />
($ millions, except per boe amounts) (1) 2006 2005 2004<br />
North America $ 35 $ 34 $ 28<br />
North Sea 31 34 22<br />
Offshore West Africa 2 1 1<br />
Expense $ 68 $ 69 $ 51<br />
$/boe $ 0.32 $ 0.34 $ 0.27<br />
(1) Amounts expressed on a per unit basis are based on sales volumes.<br />
Accretion expense is the increase in the carrying amount of the ARO due to the passage of time. ARO accretion expense was comparable<br />
to 2005.<br />
ADMINISTRATION EXPENSE<br />
($ millions, except per boe amounts) (1) 2006 2005 2004<br />
Net expense $ 180 $ 151 $ 125<br />
$/boe $ 0.85 $ 0.75 $ 0.66<br />
(1) Amounts expressed on a per unit basis are based on sales volumes.<br />
Net administration expense in 2006 increased in total and on a boe basis from 2005 primarily due to increased insurance premiums,<br />
increased staffing and administrative costs, costs associated with the integration of ACC, and overall inflationary cost pressures.<br />
STOCK-BASED COMPENSATION<br />
($ millions) 2006 2005 2004<br />
Stock-based compensation expense $ 139 $ 723 $ 249<br />
The Company’s Stock Option Plan (the “Option Plan”) provides current employees (the “option holders”) with the right to elect to receive<br />
common shares or a direct cash payment in exchange for options surrendered. The design of the Option Plan balances the need for a<br />
long-term compensation program to retain employees with the benefits of reducing the impact of dilution on current Shareholders and<br />
the reporting of the obligations associated with stock options. Transparency of the cost of the Option Plan is increased since changes in the<br />
intrinsic value of outstanding stock options are recognized each period. The cash payment feature provides option holders with substantially<br />
the same benefits and allows them to realize the value of their options through a simplified administration process.<br />
The Company recorded a $139 million ($95 million after-tax) stock-based compensation expense during 2006 in connection<br />
with the 8% appreciation in the Company’s share price (December 31, 2006 – C$62.15; December 31, 2005 – C$57.63;<br />
December 31, 2004 – C$25.63; December 31, 2003 – C$16.34). As required by GAAP, the Company’s outstanding stock<br />
options are valued based on the difference between the exercise price of the stock options and the market price of the Company’s<br />
common shares, pursuant to a graded vesting schedule. The liability is revalued quarterly to reflect changes in the market price<br />
of the Company’s common shares and the options exercised or surrendered in the period, with the net change recognized in net<br />
earnings, or capitalized during the construction period in the case of the Horizon Project (2006 – $79 million; 2005 – $101 million;<br />
2004 – $21 million). The stock-based compensation liability reflected the Company’s potential cash liability should all the vested options<br />
be surrendered for a cash payout at the market price on December 31, 2006. In periods when substantial stock price changes occur, the<br />
Company is subject to significant earnings volatility.<br />
For the year ended December 31, 2006, the Company paid $264 million for stock options surrendered for cash settlement<br />
(December 31, 2005 – $227 million; 2004 – $80 million).
Management’s Discussion & Analysis<br />
Page 55 of 107<br />
INTEREST EXPENSE<br />
($ millions, except per boe amounts and interest rates) (1) 2006 2005 2004<br />
Interest expense, gross $ 336 $ 221 $ 189<br />
Less: capitalized interest, Horizon Project 196 72 –<br />
Interest expense, net $ 140 $ 149 $ 189<br />
$/boe $ 0.66 $ 0.74 $ 1.01<br />
Average effective interest rate 5.7% 5.6% 5.2%<br />
(1) Amounts expressed on a per unit basis are based on sales volumes.<br />
Gross interest expense increased from 2005 primarily due to increased debt levels associated with the ACC acquisition and the financing of<br />
Horizon Project capital expenditures. The increase was partially offset by the impact of the strengthening <strong>Canadian</strong> dollar, which decreased<br />
interest expense on the Company’s US dollar denominated debt securities.<br />
RISK MANAGEMENT ACTIVITIES<br />
The Company utilizes various derivative financial instruments to manage its commodity price, currency and interest rate exposures. These<br />
derivative financial instruments are not intended for trading or speculative purposes. Changes in fair value of derivative financial instruments<br />
formally designated as hedges are not recognized in net earnings until such time as the corresponding gains or losses on the related hedged<br />
items are also recognized. Changes in fair value of derivative financial instruments not formally designated as hedges are recognized in the<br />
balance sheet each period with the offset reflected in risk management activities in the consolidated statements of earnings.<br />
The Company formally documents all derivative financial instruments designated as hedging transactions at the inception of the hedging<br />
relationship, in accordance with the Company’s risk management policies. The effectiveness of the hedging relationship is evaluated, both<br />
at inception of the hedge and on an ongoing basis.<br />
The Company enters into commodity price contracts to manage anticipated sales of crude oil and natural gas production in order to protect<br />
cash flow for capital expenditure programs. Realized gains or losses on these contracts are included in risk management activities. Unrealized<br />
gains or losses on commodity price contracts not formally documented as hedges are also included in risk management activities.<br />
The Company enters into interest rate swap agreements to manage its fixed to floating interest rate mix on long-term debt. The interest rate<br />
swap contracts require the periodic exchange of payments without the exchange of the notional principal amounts on which the payments<br />
are based. Gains or losses on interest rate swap contracts formally designated as hedges are included in interest expense. Gains or losses on<br />
non-designated interest rate swap contracts are included in risk management activities.<br />
The Company enters into cross-currency swap agreements to manage currency exposure on US dollar denominated long-term debt. The<br />
cross-currency swap contracts require the periodic exchange of payments with the exchange at maturity of notional principal amounts on<br />
which the payments are based. Gains or losses on the foreign exchange component of all cross-currency swap contracts are included in risk<br />
management activities. Gains or losses on the interest component of cross-currency swap contracts designated as hedges are included in<br />
interest expense.<br />
Gains or losses on the termination of derivative financial instruments that have been accounted for as hedges are deferred under other<br />
assets or liabilities on the consolidated balance sheets and amortized into net earnings in the period in which the underlying hedged<br />
transactions are recognized. In the event a designated hedged item is sold, extinguished or matures prior to the termination of the related<br />
derivative instrument, any unrealized derivative gain or loss is recognized immediately in net earnings. Gains or losses on the termination of<br />
derivative financial instruments that have not been accounted for as hedges are recognized in net earnings immediately.<br />
($ millions)<br />
Realized loss (gain)<br />
2006 2005 2004<br />
Crude oil and NGLs financial instruments $ 1,395 $ 753 $ 501<br />
<strong>Natural</strong> gas financial instruments (70) 283 5<br />
Interest rate swaps – (9) (32)<br />
Unrealized (gain) loss<br />
$ 1,325 $ 1,027 $ 474<br />
Crude oil and NGLs financial instruments $ (736) $ 847 $ (47)<br />
<strong>Natural</strong> gas financial instruments (260) 77 –<br />
Interest rate and currency swaps (17) 1 7<br />
$ (1,013) $ 925 $ (40)<br />
Total $ 312 $ 1,952 $ 434
<strong>Canadian</strong> <strong>Natural</strong> AR2006<br />
Page 56 of 107<br />
The realized losses (gains) from crude oil and NGLs and natural gas financial instruments decreased (increased) the Company’s average<br />
realized prices as follows:<br />
2006 2005 2004<br />
Crude oil and NGLs ($/bbl) (1) $ 11.57 $ 6.68 $ 4.85<br />
<strong>Natural</strong> gas ($/mcf) (1) $ (0.13) $ 0.54 $ 0.01<br />
(1) Amounts expressed on a per unit basis are based on sales volumes.<br />
The realized gain on non-designated interest rate swaps would have decreased the Company’s reported interest expense as follows:<br />
($ millions, except interest rates) 2006 2005 2004<br />
Interest expense as reported $ 140 $ 149 $ 189<br />
Less: realized risk management gain – (9) (32)<br />
$ 140 $ 140 $ 157<br />
Average effective interest rate 5.7% 5.2% 4.4%<br />
As effective as commodity hedges are against reference commodity prices, a substantial portion of the derivative financial instruments<br />
entered into by the Company do not meet the requirements for hedge accounting under GAAP due to currency, product quality and<br />
location differentials (the “non-designated hedges”). The Company is required to mark-to-market these non-designated hedges based<br />
on prevailing forward commodity prices in effect at the end of each reporting period. Accordingly, the unrealized risk management asset<br />
reflected at December 31 2006, the implied price differentials for the non-designated hedges for future years. Due to changes in crude<br />
oil and natural gas forward pricing and the reversal of prior year unrealized losses, the Company recorded a net unrealized gain of $1,013<br />
million ($674 million after-tax) on its risk management activities in 2006 (2005 – a $925 million unrealized loss, $607 million after-tax; 2004<br />
– a $40 million unrealized gain, $27 million after-tax).<br />
The cash settlement amount of the risk management financial derivative instruments may vary materially depending upon the underlying<br />
crude oil and natural gas prices at the time of final settlement of the financial derivative instruments, as compared to their mark-to-market<br />
value at December 31, 2006.<br />
In addition to the net risk management asset recognized on the balance sheet at December 31, 2006, the net unrecognized asset related to<br />
the estimated fair values of derivative financial instruments designated as hedges was $222 million (December 31, 2005 – net unrecognized<br />
liability of $990 million).<br />
Details relating to outstanding derivative financial instruments at December 31, 2006 are disclosed in note 12 to the Company’s audited<br />
annual consolidated financial statements as at December 31, 2006.<br />
Effective January 1, 2007, the Company will adopt new accounting standards relating to the accounting for and disclosure of financial<br />
instruments. Accordingly, the Company will record all of its derivative financial instruments on the balance sheet at fair value, including<br />
those designated as hedges. Designated hedges are currently not recognized on the balance sheet but are disclosed in the notes to the<br />
consolidated financial statements. The estimated effects on the Company’s consolidated balance sheet are discussed in further detail on<br />
page 68 of this MD&A.<br />
FOREIGN EXCHANGE<br />
($ millions) 2006 2005 2004<br />
Realized foreign exchange (gain) loss $ (12) $ (29) $ 3<br />
Unrealized foreign exchange loss (gain) 134 (103) (94)<br />
Total $ 122 $ (132) $ (91)<br />
The Company’s operating results are affected by the exchange rates between the <strong>Canadian</strong> dollar, US dollar, and UK pound sterling. A<br />
majority of the Company’s revenue is based on reference to US dollar benchmark prices. An increase in the value of the <strong>Canadian</strong> dollar in<br />
relation to the US dollar results in decreased revenue from the sale of the Company’s production. Conversely a decrease in the value of the<br />
<strong>Canadian</strong> dollar in relation to the US dollar will result in increased revenue from the sale of the Company’s production. Production expenses<br />
are subject to fluctuations due to changes in the exchange rate of the UK pound sterling to the US dollar related to North Sea operations.<br />
The value of the Company’s US dollar denominated debt is also impacted by the value of the <strong>Canadian</strong> dollar in relation to the US dollar.<br />
The realized foreign exchange loss in 2006 was primarily the result of foreign exchange rate fluctuations on working capital items<br />
denominated in US dollars or UK pounds sterling. The unrealized foreign exchange gain in 2006 was primarily related to the fluctuation of<br />
the <strong>Canadian</strong> dollar in relation to the US dollar with respect to the US dollar debt and working capital in North America denominated in US<br />
dollars, as well as the re-measurement of North Sea future income tax liabilities denominated in UK pounds sterling. The <strong>Canadian</strong> dollar<br />
ended the year at US$0.8581 compared to US$0.8577 at December 31, 2005 (December 31, 2004 – US$0.8308).
Management’s Discussion & Analysis<br />
Page 57 of 107<br />
In order to mitigate a portion of the volatility associated with fluctuations in exchange rates, the Company has designated certain US dollar<br />
denominated debt as a hedge against its net investment in US dollar based self-sustaining foreign operations. Accordingly, translation gains<br />
and losses on this US dollar denominated debt are included in the foreign currency translation adjustment in Shareholders’ Equity in the<br />
consolidated balance sheets.<br />
TAXES<br />
($ millions, except income tax rates)<br />
Taxes other than income tax<br />
2006 2005 2004<br />
Current $ 219 $ 203 $ 210<br />
Deferred 37 (9) (45)<br />
Total<br />
Current income tax<br />
$ 256 $ 194 $ 165<br />
North America $ 143 $ 99 $ 101<br />
North Sea 30 155 2<br />
Offshore West Africa 49 32 13<br />
Total $ 222 $ 286 $ 116<br />
Future income tax $ 652 $ 353 $ 474<br />
Effective income tax rate 25.7% (1) 37.8% (2) 29.6% (3)<br />
(1) Includes the effect of the following:<br />
��a charge of $110 million related to the increased supplementary charge on oil and gas profits in the UK North Sea, substantively enacted early in 2006.<br />
��a recovery of $438 million due to <strong>Canadian</strong> Federal, Alberta and Saskatchewan corporate income tax rate reductions enacted in 2006.<br />
��a recovery of $67 million due to Offshore West Africa corporate income tax rate reductions enacted late in 2006.<br />
(2) Includes the effect of a $19 million recovery due to a British Columbia corporate tax rate reduction enacted in 2005.<br />
(3) Includes the effect of a $66 million recovery due to an Alberta corporate tax rate reduction enacted in 2004.<br />
Taxes other than income tax includes current and deferred petroleum revenue tax (“PRT”) and <strong>Canadian</strong> provincial capital taxes and<br />
surcharges. PRT is charged on certain fields in the North Sea at the rate of 50% of net operating income, after allowing for certain<br />
deductions including abandonment expenditures.<br />
Taxable income from the conventional crude oil and natural gas business in Canada is primarily generated through partnerships, with the<br />
related income taxes payable in a future period. North America current income taxes have been provided on the basis of the corporate<br />
structure and available income tax deductions and will vary depending upon the nature and amount of capital expenditures incurred in<br />
Canada in any particular year.<br />
Income tax rate changes during 2006 resulted in a reduction of future income tax liabilities of approximately $438 million in North America,<br />
an increase of future income tax liabilities of approximately $110 million in the UK North Sea and a reduction of future income tax liabilities<br />
of approximately $67 million in Côte d’Ivoire.<br />
During 2005, North America income tax rate changes resulted in a reduction of future income tax liabilities of approximately<br />
$19 million.<br />
During 2004, North America income tax rate changes resulted in a reduction of future income tax liabilities of approximately<br />
$66 million.<br />
During 2003, the <strong>Canadian</strong> Federal Government enacted legislation to change the taxation of resource income. The legislation reduces the<br />
corporate income tax rate on resource income from 28% to 21% over five years beginning January 1, 2003. Over the same period, the<br />
deduction for resource allowance is being phased out and a deduction for actual crown royalties paid is being phased in. As a result in 2007,<br />
crown royalties will be fully deductible and the Company will no longer be eligible for resource allowance in 2007 and future years.<br />
The following table shows the effect of non-recurring benefits on income taxes:<br />
($ millions, except income tax rates)<br />
Income tax as reported<br />
2006 2005 2004<br />
Current income tax $ 222 $ 286 $ 116<br />
Future income tax expense 652 353 474<br />
874 639 590<br />
Provincial corporate tax rate reductions 161 19 66<br />
<strong>Canadian</strong> Federal and foreign corporate tax rate reductions 234 – –<br />
Total $ 1,269 $ 658 $ 656<br />
Expected effective income tax rate before non-recurring benefits 37.3% 39.0% 32.9%<br />
The effective income tax rate for 2006 decreased slightly from 2005 due to the effects of the phased elimination of the resource allowance,<br />
the phased deductibility of crown royalties and foreign jurisdictional corporate tax rate changes substantively enacted during the year.<br />
In 2007, based on budgeted prices and the current availability of tax pools, the Company expects to be cash taxable in Canada in the<br />
amount of $45 million to $75 million.
<strong>Canadian</strong> <strong>Natural</strong> AR2006<br />
Page 58 of 107<br />
NET CAPITAL EXPENDITURES (1)<br />
($ millions)<br />
Expenditures on property, plant and equipment<br />
2006 2005 2004<br />
Net property acquisitions (dispositions) (2) $ 4,733 $ (320) $ 1,835<br />
Land acquisition and retention 210 254 120<br />
Seismic evaluations 130 132 89<br />
Well drilling, completion and equipping 2,340 2,000 1,394<br />
Pipeline and production facilities 1,314 1,295 821<br />
Total net reserve replacement expenditures<br />
Horizon Project<br />
8,727 3,361 4,259<br />
Phase 1 construction costs (3) 2,768 1,249 –<br />
Phases 2 and 3 costs 79 – –<br />
Capitalized interest, stock-based compensation and other (3) 338 250 291<br />
Total Horizon Project 3,185 1,499 291<br />
Midstream 12 4 16<br />
Abandonments (4) 75 46 32<br />
Head office 26 22 35<br />
Total net capital expenditures $ 12,025 $ 4,932 $ 4,633<br />
By segment<br />
North America $ 7,936 $ 2,530 $ 3,355<br />
North Sea 646 387 608<br />
Offshore West Africa 134 439 295<br />
Other 11 5 1<br />
Horizon Project 3,185 1,499 291<br />
Midstream 12 4 16<br />
Abandonments (4) 75 46 32<br />
Head office 26 22 35<br />
Total $ 12,025 $ 4,932 $ 4,633<br />
(1) Net capital expenditures do not include non-cash property, plant and equipment additions or disposals.<br />
(2) Includes Business Combinations.<br />
(3) Certain prior period amounts have been reclassified with respect to stock-based compensation costs.<br />
(4) Abandonments represent expenditures to settle AROs and have been reflected as capital expenditures in this table.<br />
The Company’s strategy is focused on building a diversified asset base that is balanced among various products. In order to facilitate efficient<br />
operations, the Company concentrates its activities in core regions where it can dominate the land base and infrastructure. The Company<br />
focuses on maintaining its land inventories to enable the continuous exploitation of play types and geological trends, greatly reducing overall<br />
exploration risk. By dominating infrastructure, the Company is able to maximize utilization of its production facilities, thereby increasing<br />
control over production costs.<br />
Net capital expenditures in 2006 were $12,025 million compared to $4,932 million in 2005 (2004 – $4,633 million). The increase primarily<br />
reflected the $4,641 (1) million acquisition of ACC (including working capital and other adjustments) and continued progress on the Company’s<br />
larger, future growth projects, most notably the Horizon Project. Excluding the ACC acquisition and the Horizon Project, net capital expenditures<br />
were $4,085 million in 2006 compared to $3,433 million in 2005, reflecting the impact of $320 million in net property dispositions in 2005,<br />
and overall industry-wide inflationary pressures in 2006. During 2006, the Company drilled a total of 1,738 net wells consisting of 641 natural<br />
gas wells, 603 crude oil wells, 375 stratigraphic test and service wells, and 119 wells that were dry. The 375 stratigraphic test and service<br />
wells include 163 stratigraphic test wells related to the Horizon Project. This compared to 1,882 net wells drilled in 2005 (2004 – 1,449 net<br />
wells). The Company achieved an overall success rate of 91% in 2006, excluding the stratigraphic test and service wells (2005 - 93% and<br />
2004 -91%).<br />
(1) The preliminary allocation of the ACC purchase price to assets acquired and liabilities assumed based on their fair values was as follows:<br />
Property, plant and equipment $ 6,249<br />
Less – future income taxes (1,438)<br />
– asset retirement costs (56)<br />
Consideration for crude oil and natural gas properties 4,755<br />
Non-cash working capital deficit assumed and other (105)<br />
Long-term debt assumed (9)<br />
Net purchase price - cash consideration $ 4,641
Management’s Discussion & Analysis<br />
Page 59 of 107<br />
NORTH AMERICA<br />
North America, including the Horizon Project and the ACC acquisition, accounted for approximately 94% of the total capital expenditures<br />
for the year ended December 31, 2006 compared to approximately 83% in 2005 (2004 – 80%).<br />
During 2006, the Company targeted 732 net natural gas wells, including 181 wells in Northeast British Columbia, 262 wells in the Northern<br />
Plains region, 177 wells in Northwest Alberta, and 112 wells in the Southern Plains region. The Company also targeted 619 net crude oil<br />
wells during the year. The majority of these wells were concentrated in the Company’s crude oil Northern Plains region where 292 heavy<br />
crude oil wells, 144 Pelican Lake crude oil wells, and 8 light crude oil wells were drilled. Another 114 wells targeting light crude oil were<br />
drilled outside the Northern Plains as well as 61 thermal crude oil wells in the Company’s In-Situ Oil Sands area.<br />
Due to significant changes in relative commodity prices between crude oil and natural gas, the Company has taken the opportunity to access<br />
its large crude oil drilling inventory to maximize value in both the short and long term. To optimize netbacks in the short term, the Company<br />
will continue to focus on drilling crude oil wells in 2007 and, accordingly, will reduce natural gas drilling activity to manage overall capital<br />
spending. Deferred natural gas wells will be retained in the Company’s prospect inventory, and will be drilled as natural gas commodity prices<br />
improve. Drilling on ACC acquired lands will be optimized as part of the overall capital program.<br />
As part of the development of the Company’s In-Situ Oil Sands Assets, the Company is continuing to develop its Primrose thermal projects.<br />
At the end of 2006, the Company had drilled 186 stratigraphic test and observation wells and 61 thermal oil wells. With first steaming<br />
for the Primrose North expansion commencing November 2005, overall Primrose thermal production in 2006 increased to approximately<br />
64,000 bbl/d from 53,000 bbl/d in 2005. Initial steaming of the projects was completed late in 2006.<br />
In November of 2005, the Company announced a phased expansion of its In-Situ Oil Sands assets. The next phase of this development is the<br />
Primrose East expansion, a new facility located 15 kilometers from the existing Primrose South steam plant and 25 kilometers from the Wolf<br />
Lake central processing facility. This phase of the expansion is anticipated to add an additional 40,000 bbl/d and received Board of Director’s<br />
sanction in 2006. Detailed engineering and procurement is currently underway. The Company anticipates receiving regulatory approval for<br />
Primrose East in the first half of 2007, with drilling and construction planned to begin in the second half of 2007, and production expected<br />
to commence in 2009.<br />
The next phase of the Company’s In-Situ Oil Sands assets expansion is the Kirby project located 120 km north of the existing Primrose<br />
facilities. The Kirby project is anticipated to add an additional 30,000 bbl/d of production growth. The Company is targeting to file its formal<br />
regulatory application documents for this project in the second half of 2007. First steaming is anticipated to begin in 2011.<br />
Development of new acreage and secondary recovery conversion projects at Pelican Lake continued as expected through 2006. Drilling<br />
consisted of 144 horizontal wells, with plans to drill 132 additional horizontal wells in 2007. The response from the polymer flood pilot<br />
continues to be positive. Based on the results of the pilot, the Company commenced the installation of 12 additional polymer skids in 2006<br />
as part of the approval of the commercial polymer flood project. Pelican Lake production averaged approximately 30,000 bbl/d in 2006.<br />
Originally announced in the fall of 2005, the scoping study for the proposed <strong>Canadian</strong> <strong>Natural</strong> Upgrader, outside of the Horizon Project,<br />
continued during 2006 and into early 2007. The terms of reference for this study involved the evaluation of product alternatives, location,<br />
technology, gasification and integration with existing assets using the same disciplined approach utilized in the Horizon Project. The next<br />
steps in this process would include a Design Basis Memorandum (“DBM”) and Engineering Design Specification (“EDS”) which would be<br />
required to be completed prior to construction and sanctioning of the project by the Board of Directors.<br />
Based upon the results of the scoping study, which identified growing concerns relating to increased environmental costs for upgraders<br />
located in Canada, inflationary capital cost pressures and a narrowing Heavy Differential in North America, the Company has, at<br />
this point in time, deferred the DBM and EDS pending clarification on the cost of future environmental legislation and a more stable<br />
cost environment.<br />
In 2007, the Company’s overall drilling activity in North America is expected to comprise approximately 423 natural gas wells and 813 crude<br />
oil wells excluding stratigraphic and service wells.<br />
HORIZON PROJECT<br />
The Horizon Project is designed as a phased development and includes two components: the mining of bitumen and an onsite upgrader.<br />
Phase 1 production is expected to commence in the second half of 2008 at 110,000 bbl/d of 34° API SCO. The phased approach provides<br />
the Company with improved cost and project controls including labour and materials management, and directionally mitigates the effects<br />
of growth on local infrastructure. Extensive front end design and the high degree of project definition have enabled the Company to obtain<br />
approximately 68% of Phase 1 costs on a fixed price basis. The high degree of up front project engineering and pre-planning is expected to<br />
reduce the risks associated with scope changes.<br />
The Horizon Project continued on schedule and on budget with construction 57% complete at year end. The project status as at December<br />
31, 2006 was as follows:<br />
� � Detailed engineering was 94% complete;<br />
� � Over $5.1 billion in purchase orders and contracts have been awarded to date;
<strong>Canadian</strong> <strong>Natural</strong> AR2006<br />
Page 60 of 107<br />
� � Several key mechanical contracts, including general mechanical contracts for the hydrotreater and cogeneration areas, were awarded;<br />
� � Set 333 pipe rack modules, essentially forming the core infrastructure of the plant;<br />
� � Mine overburden removal was approximately 35% complete; and<br />
� � Site preparation and underground infrastructure was completed.<br />
In 2005, the Board of Directors of the Company approved the construction costs for Phase 1 of the Horizon Project, with an approved<br />
budget of $6.8 billion. Cumulative construction spending to December 31, 2006 was approximately $4.0 billion. Final construction costs for<br />
Phase 1 may differ from the approved budget due to changes in the final scope and timing of completion of the project, and/or inflationary<br />
cost pressures.<br />
NORTH SEA<br />
In 2006, the Company continued with its planned program of infill drilling, recompletions, workovers and waterflood optimizations. During<br />
2006, 9.2 net wells were drilled with an additional 4 net wells drilling at year end.<br />
The development of the Lyell Field progressed during the year with the completion of construction, installation and tie-in of subsea<br />
infrastructure. Tranche 1 of the Lyell Field development comprises the drilling of 4 net wells and the workover of 2 existing wells. Production<br />
from the Lyell Field is expected to be at full capacity in the second half of 2007.<br />
During 2006, construction of the Columba E Raw Water Injection project continued. The project consists of 2 injection wells.<br />
OFFSHORE WEST AFRICA<br />
During 2006, 5.8 net wells were drilled with 1 well drilling at year-end.<br />
First crude oil from West Espoir commenced from 3 wells brought on-line during 2006. Late in the year 2 water injector wells were added.<br />
The West Espoir area development drilling will continue until 2008 with producer and injector wells being brought on-line as they are<br />
completed.<br />
The Company purchased a 90% interest in the Olowi PSC offshore Gabon in October 2005, received Government approval of its development<br />
plan for this acquisition early in 2006 and received Board sanction for development in November 2006. Development plans include a FPSO<br />
handling input from 4 shallow-water producing platforms. Late in 2006 the Company signed a lease agreement for a FPSO with a primary<br />
term of ten years, commencing 2008.<br />
LIQUIDITY AND CAPITAL RESOURCES<br />
($ millions, except ratios) 2006 2005 2004<br />
Working capital deficit (1) $ 832 $ 1,774 $ 652<br />
Long-term debt<br />
Shareholders’ equity<br />
$ 11,043 $ 3,321 $ 3,538<br />
Share capital $ 2,562 $ 2,442 $ 2,408<br />
Retained earnings 8,141 5,804 4,922<br />
Foreign currency translation adjustment (13) (9) (6)<br />
Total $ 10,690 $ 8,237 $ 7,324<br />
Debt to book capitalization (2) 50.8% 28.7% 33.8%<br />
Debt to market capitalization 24.8% 9.7% 21.4%<br />
After tax return on average common shareholders’ equity (3) 26.9% 14.3% 21.4%<br />
After tax return on average capital employed (4) 17.2% 10.4% 15.3%<br />
(1) Calculated as current assets less current liabilities.<br />
(2) Calculated as current and long-term debt; divided by the book value of common shareholders’ equity plus current and long-term debt.<br />
(3) Calculated as net earnings for the year as a percentage of average common shareholders’ equity for the year.<br />
(4) Calculated as net earnings plus after-tax interest expense for the year; as a percentage of average capital employed. Average capital employed is the average<br />
shareholders’ equity and current and long-term debt for the year.<br />
The Company’s capital resources at December 31, 2006 consisted primarily of cash flow from operations, available credit facilities and access<br />
to debt capital markets. Cash flow from operations is dependent on factors discussed in the Risks and Uncertainties section of this MD&A.<br />
The Company’s ability to renew existing credit facilities and raise new debt is also dependent upon these factors, as well as maintaining<br />
an investment grade debt rating and the condition of capital and credit markets. Management believes internally generated cash flows<br />
supported by the implementation of the Company’s hedge policy, the flexibility of its capital expenditure programs supported by its five- and<br />
ten-year financial plans, the Company’s existing credit facilities and the Company’s ability to raise new debt on commercially acceptable<br />
terms, will be sufficient to sustain its operations and support its growth strategy. The Company’s current debt ratings are BBB (high) with a<br />
negative trend by DBRS, Baa2 with a stable outlook by Moody’s Investor Services, Inc. and BBB with a stable outlook by Standard and Poors<br />
Corporation.<br />
At December 31, 2006, the Company had undrawn bank lines of credit of $1,115 million. Details related to the Company’s credit facilities<br />
outstanding at December 31, 2006 are disclosed in note 5 to the Company’s audited annual consolidated financial statements.
Management’s Discussion & Analysis<br />
Page 61 of 107<br />
At December 31, 2006, the Company’s working capital deficit was $832 million and included the current portion of the stock-based<br />
compensation liability of $611 million and the current portion of the net mark-to-market asset for non-designated risk management<br />
financial derivative instruments of $88 million. The settlement of the stock-based compensation liability is dependant upon both the<br />
surrender of vested stock options for cash settlement by employees and the value of the Company’s share price at the time of surrender.<br />
The cash settlement amount of the risk management financial derivative instruments may vary materially depending upon the underlying<br />
crude oil and natural gas prices at the time of final settlement of the financial derivative instruments, as compared to their mark-to-market<br />
value at December 31, 2006.<br />
The Company believes it has the necessary financial capacity to complete the Horizon Project, while at the same time not compromising<br />
conventional crude oil and natural gas growth opportunities. The financing of Phase 1 of the Horizon Project development is guided by the<br />
competing principles of retaining as much direct ownership interest as possible while maintaining a strong balance sheet. Existing proved<br />
development projects, which have largely been funded prior to December 31, 2006, such as Baobab, Primrose and West Espoir, and the<br />
acquisition of ACC, are anticipated to provide identified growth in production volumes in 2007 through 2009, and generate incremental<br />
free cash flows during this period.<br />
Primarily due to the additional debt issued to complete the ACC acquisition, long-term debt increased to $11,043 million at December 31,<br />
2006, resulting in a debt to book capitalization level of 50.8% as at December 31, 2006 (December 31, 2005 - 28.7%). While this ratio<br />
is above the 35% to 45% range targeted by management, the Company remains committed to maintaining a strong balance sheet and<br />
flexible capital structure, and expects its debt to book capitalization ratio to be near the midpoint of the range in 2008. While the Company<br />
believes that its balance sheet has the strength and flexibility to accommodate the ACC acquisition, to ensure balance sheet strength going<br />
forward, the Company has hedged a significant portion of its natural gas and crude oil production for 2007 and 2008 at prices that protect<br />
investment returns. In the future, the Company may also consider the divestiture of non-strategic and non-core properties to gain additional<br />
balance sheet flexibility.<br />
The Company’s commodity hedging program reduces the risk of volatility in commodity price markets and supports the Company’s cash flow<br />
for its capital expenditure program throughout the Horizon Project construction period. This program allows for the hedging of up to 75% of<br />
the near 12 months budgeted production, up to 50% of the following 13 to 24 months expected production and up to 25% of production<br />
expected in months 25 to 48. For the purpose of this program, the purchase of crude oil put options is in addition to the above parameters. In<br />
accordance with the policy, approximately 65% of expected crude oil volumes and approximately 75% of expected natural gas volumes have<br />
beenhedgedfor2007.Inaddition,77,000bbl/dofcrudeoilvolumesareprotectedbyputoptionsfor2007atastrikepriceofUS$60.00perbarrel.<br />
The Company is extending its hedge program into 2008 whereby 150,000 bbl/d of crude oil volumes have been hedged (100,000 bbl/d of price<br />
collars with a US$60.00 floor and 50,000 bbl/d of put options with a US$55.00 strike price). In addition, 900,000 GJ/d of natural gas volumes<br />
have been hedged through the use of price collars for the first quarter of 2008 (400,000 GJ/d with a floor of $7.00 and 500,000 GJ/d with a<br />
floor of $7.50).<br />
In addition to the strategic location of the assets that ACC brings to the Company, this acquisition allows the Company to further high<br />
grade its project inventory and focus capital expenditures in the current highly inflationary service market. As a result of the acquisition, the<br />
Company has reduced its 2007 conventional crude oil and natural gas capital budget by $900 million compared to 2006 capital spending,<br />
while maintaining the capital expenditures to complete Phase I of the Horizon Project.<br />
LONG-TERM DEBT<br />
The Company’s long-term debt of $11,043 million at December 31, 2006 was comprised of drawings under its bank credit facilities and<br />
debt issuances under medium and long-term unsecured notes.<br />
BANK CREDIT FACILITIES<br />
As at December 31, 2006 the Company had in place unsecured bank credit facilities of $7,809 million, comprised of:<br />
� � a $100 million demand credit facility;<br />
� � a $500 million demand credit facility;<br />
� � a 3-year non-revolving syndicated credit facility of $3,850 million;<br />
� � a 5-year revolving syndicated credit facility of $1,825 million;<br />
� � a 5-year revolving syndicated credit facility of $1,500 million; and<br />
� � a £15 million demand credit facility related to the Company’s North Sea operations.<br />
The revolving syndicated credit facilities are fully revolving for a period of five years maturing June 2011. Both facilities are extendible<br />
annually for one year periods at the mutual agreement of the Company and the lenders. If the facilities are not extended, the full amount<br />
of the outstanding principal would be repayable on the maturity date.
<strong>Canadian</strong> <strong>Natural</strong> AR2006<br />
Page 62 of 107<br />
In conjunction with the closing of the acquisition of ACC, the Company executed a $3,850 million, three-year non-revolving syndicated<br />
credit facility maturing in October 2009. This facility is subject to certain prepayment requirements up to a maximum of $1,500 million.<br />
During 2006, the Company obtained a $500 million credit facility repayable on demand.<br />
The weighted average interest rate of the bank credit facilities outstanding at December 31, 2006, was 4.8% (2005 – 4.0%).<br />
In addition to the outstanding debt, letters of credit and financial guarantees aggregating $338 million, including $300 million related to<br />
the Horizon Project, were outstanding at December 31, 2006.<br />
MEDIUM-TERM NOTES<br />
In January 2006, the Company issued $400 million of debt securities maturing January 2013, bearing interest at 4.50%. Proceeds<br />
from the securities issued were used to repay bankers’ acceptances under the Company’s bank credit facilities. After issuing these<br />
securities, the Company has $1.6 billion remaining on its $2 billion shelf prospectus filed in August 2005 that allows for the<br />
issue of medium-term notes in Canada until September 2007. If issued, these securities will bear interest as determined at the date<br />
of issuance.<br />
In May 2005, the Company issued $400 million of debt securities maturing June 2015, bearing interest at 4.95%. Proceeds from the<br />
securities issued were used to repay bankers’ acceptances under the Company’s bank credit facilities.<br />
Subsequent to December 31, 2006, the 7.40% unsecured debentures due March 1, 2007 were repaid.<br />
SENIOR UNSECURED NOTES<br />
The adjustable rate senior unsecured notes bear interest at 6.54% and have annual principal repayments of US$31 million commencing in<br />
May 2007, through May 2009.<br />
In December 2005, the Company repaid the US$125 million 7.69% senior unsecured notes due December 19, 2005.<br />
PREFERRED SECURITIES<br />
In September 2005, the Company redeemed the US$80 million 8.30% preferred securities due May 25, 2011 for cash consideration of<br />
US$91 million, including an early repayment premium of US$11 million as required under the Note Purchase Program.<br />
US DOLLAR DEBT SECURITIES<br />
In August 2006, the Company issued US$250 million of unsecured notes maturing August 2016 and US$450 million of unsecured notes<br />
maturing February 2037, bearing interest at 6.00% and 6.50%, respectively. Concurrently, the Company entered into cross-currency<br />
interest-rate swaps to fix the <strong>Canadian</strong> dollar interest and principal repayment amounts on the US$250 million notes at 5.40% and<br />
C$279 million. Proceeds from the securities issued were used to repay bankers’ acceptances under the Company’s bank credit facilities.<br />
In November 2006, the US shelf prospectus, filed in June 2005, was increased from US$2,000 million to US$3,000 million, leaving<br />
US$2,300 million available for issue in the United States until July 2007.<br />
Subsequently, on March 12, 2007, the Company priced, for settlement on March 19, 2007, US$2,200 million of unsecured notes under<br />
the US shelf prospectus, comprised of US$1,100 million of unsecured notes maturing May 2017 and US$1,100 million of unsecured notes<br />
maturing March 2038, bearing interest at 5.70% and 6.25%, respectively. Concurrently, the Company entered into cross-currency interestrate<br />
swaps to fix the <strong>Canadian</strong> dollar interest and principal repayment amounts on US$1,100 million of unsecured notes due May 2017<br />
at 5.10% and C$1,287 million. The Company also entered into a cross-currency interest-rate swap to fix the <strong>Canadian</strong> dollar interest and<br />
principal repayment amounts on US$550 million of unsecured notes due March 2038 at 5.76% and C$644 million. Net proceeds on the<br />
debt issue will be used to repay outstanding amounts under the Company’s bank credit facilities.<br />
SHARE CAPITAL<br />
As at December 31, 2006, there were 537,903,000 common shares outstanding and 34,425,000 stock options outstanding. As at<br />
March 13, 2007, the Company had 538,970,000 common shares outstanding and 31,098,000 stock options outstanding.<br />
During 2006, the Company purchased 485,000 common shares for cancellation (2005 – 850,000 common shares;<br />
2004 – 873,400 common shares) at an average price of $57.33 per common share (2005 – $53.29 per common share; 2004 - $38.01<br />
per common share), for a total cost of $28 million (2005 – $45 million; 2004 - $33 million) pursuant to the Normal Course Issuer Bids<br />
previously filed.<br />
In January 2007, the Company renewed its Normal Course Issuer Bid to purchase, through the facilities of the Toronto Stock<br />
Exchange and the New York Stock Exchange, during the 12-month period beginning January 24, 2007 and ending January 23, 2008,<br />
up to 26,941,730 common shares or 5% of the outstanding common shares of the Company then outstanding on the date of the<br />
announcement. As at March 15, 2007, the Company had not purchased any additional shares under the Normal Course Issuer Bid.<br />
In March 2007, the Company’s Board of Directors approved an increase in the annual dividend paid by the Company to $0.34 per common<br />
share for 2007. The increase represented a 13% increase from the prior year, recognizes the stability of the Company’s cash flow, and<br />
provides a return to Shareholders. This is the seventh consecutive year in which the Company has paid dividends and the sixth consecutive
Management’s Discussion & Analysis<br />
Page 63 of 107<br />
year of an increase in the distribution paid to its Shareholders. The dividend policy undergoes a periodic review by the Board of Directors and<br />
is subject to change. In February 2006, an increase in the annual dividend paid by the Company was approved to $0.30 per common share<br />
for 2006. The increase represented a 27% increase from the prior year.<br />
COMMITMENTS AND OFF BALANCE SHEET ARRANGEMENTS<br />
In the normal course of business, the Company has entered into various commitments that will have an impact on the Company’s future<br />
operations. These commitments primarily relate to debt repayments, operating leases relating to office space and offshore FPSOs and drilling<br />
rigs, and firm commitments for gathering, processing and transmission services, as well as expenditures relating to AROs. As at December<br />
31, 2006, no entities have been consolidated under the <strong>Canadian</strong> Institute of Chartered Accountants Handbook Accounting Guideline 15,<br />
“Consolidation of Variable Interest Entities”. The following table summarizes the Company’s commitments as at December 31, 2006:<br />
($ millions) 2007 2008 2009 2010 2011 Thereafter<br />
Product transportation and pipeline (1) $ 213 $ 193 $ 134 $ 123 $ 99 $ 1,042<br />
Offshore equipment operating leases (2) $ 77 $ 52 $ 52 $ 52 $ 50 $ 131<br />
Offshore drilling $ 73 $ 83 $ 12 $ 12 $ 4 $ 4<br />
Asset retirement obligations (3) $ 3 $ 3 $ 3 $ 4 $ 4 $ 4,480<br />
Long-term debt (4) $ 161 $ 45 $ 3,876 $ – $ 466 $ 3,713<br />
Office leases $ 26 $ 32 $ 33 $ 34 $ 22 $ –<br />
Electricity and other $ 51 $ 10 $ 17 $ 18 $ 1 $ –<br />
(1) The Company entered into a 25 year pipeline transportation agreement commencing in 2008, related to future crude oil production. The agreement is renewable<br />
for successive 10-year periods at the Company’s option. During the initial term, annual toll payments before operating costs will be approximately $35 million.<br />
(2) Offshore equipment operating leases are primarily comprised of obligations related to FPSOs. During 2006, the Company entered into an agreement to lease an<br />
additional FPSO commencing in 2008, in connection with the planned offshore development in Gabon, Offshore West Africa. The new FPSO lease agreement<br />
contains cancellation provisions at the option of the Company, subject to escalating termination payments throughout 2007 to a maximum of US$395 million.<br />
(3) Amounts represent management’s estimate of the future undiscounted payments to settle AROs related to resource properties, facilities, and production platforms,<br />
based on current legislation and industry operating practices. Amounts disclosed for the period 2007 – 2011 represent the minimum required expenditures to meet<br />
these obligations. Actual expenditures in any particular year may exceed these minimum amounts.<br />
(4) The long-term debt represents principal repayments only. No debt repayments are reflected for $2,782 million of revolving bank credit facilities due to the<br />
extendable nature of the facilities.<br />
In 2005, the Board of Directors of the Company approved the construction costs for Phase 1 of the Horizon Project, with an approved<br />
budget of $6.8 billion. Cumulative construction spending to December 31, 2006 was approximately $4.0 billion. Final construction costs for<br />
Phase 1 may differ from the approved budget due to changes in the final scope and timing of completion of the project, and/or inflationary<br />
cost pressures.<br />
LEGAL PROCEEDINGS<br />
The Company is defendant and plaintiff in a number of legal actions that arise in the normal course of business. The Company<br />
believes that any liabilities that might arise pertaining to such matters would not have a material effect on its consolidated<br />
financial position.<br />
RESERVES<br />
For the year ended December 31, 2006, the Company retained qualified independent reserve evaluators, Sproule Associates Limited<br />
(“Sproule”) and Ryder Scott Company (“Ryder Scott”) to evaluate 100% of the Company’s conventional proved, as well as proved and<br />
probable crude oil, natural gas liquids (“NGL”) and natural gas reserves (1) and prepare Evaluation Reports on these reserves. Sproule evaluated<br />
the Company’s North America conventional assets and Ryder Scott evaluated the international conventional assets. The Company has been<br />
granted an exemption from National Instrument 51-101 – Standards of Disclosure for Oil and Gas Activities (“NI 51-101”), which prescribes<br />
the standards for the preparation and disclosure of reserves and related information for companies listed in Canada. This exemption allows<br />
the Company to substitute SEC requirements for certain disclosures required under NI 51-101. There are two principal differences between<br />
the two standards. The first is the additional requirement under NI 51-101 to disclose both proved, and proved and probable reserves, as<br />
well as the related net present value of future net revenues using forecast prices and costs. The second is in the definition of proved reserves;<br />
however, as discussed in the <strong>Canadian</strong> Oil and Gas Evaluation Handbook (“COGEH”), the standards that NI 51-101 employs, the difference<br />
in estimated proved reserves based on constant pricing and costs between the two standards is not material.<br />
The Company has disclosed proved conventional reserves and the Standardized Measure of discounted future net cash flows using year-end<br />
constant prices and costs as mandated by the SEC in the supplementary oil and gas information section of this Annual Report. The Company<br />
has elected to provide the net present value (2) of these same conventional proved reserves as well as its conventional proved and probable<br />
reserves and the net present value of these reserves under the same parameters as additional voluntary information. The Company has also<br />
elected to provide both proved, and proved and probable conventional reserves and the net present value of these reserves using forecast<br />
prices and costs as voluntary additional information, which is disclosed in the Company’s most recent Annual Information Form.
<strong>Canadian</strong> <strong>Natural</strong> AR2006<br />
Page 64 of 107<br />
For the year ended December 31, 2006, the Company retained a qualified independent reserves evaluator, GLJ Petroleum Consultants<br />
(“GLJ”), to evaluate 100% of Phases 1 through 3 of the Company’s Horizon Project and prepare an Evaluation Report on the Company’s<br />
proved, as well as proved and probable oil sands mining reserves incorporating both the mining and upgrading projects. These reserves were<br />
evaluated adhering to the requirements of SEC Industry Guide 7 using year-end constant pricing and have been disclosed separately from<br />
the Company’s conventional proved and probable crude oil, NGL and natural gas reserves.<br />
The Reserves Committee of the Company’s Board of Directors has met with and carried out independent due diligence procedures with<br />
each of Sproule, Ryder Scott and GLJ to review the qualifications of and procedures used by each evaluator in determining the estimate of<br />
the Company’s quantities and net present value of remaining conventional crude oil, NGL and natural gas reserves as well as the Company’s<br />
quantity of oil sands mining reserves.<br />
Additional reserves disclosure is contained in the supplementary oil and gas information of this Annual Report and in the Company’s most<br />
recent Annual Information Form.<br />
(1) Conventional crude oil, NGLs and natural gas includes all of the Company’s light/medium, heavy, and thermal crude oil, natural gas, coal bed methane and natural<br />
gas liquids activities. It does not include the Company’s oil sands mining assets.<br />
(2) Net present values of conventional reserves are based upon discounted cash flows prior to the consideration of income taxes and existing asset abandonment<br />
liabilities. Only future development costs and associated material well abandonment liabilities have been applied.<br />
RISKS AND UNCERTAINTIES<br />
The Company is exposed to various operational risks inherent in exploring, developing, producing and marketing crude oil and natural gas<br />
and the mining and upgrading of bitumen. These inherent risks include, but are not limited to, the following items:<br />
� � Economic risk of finding and producing reserves at a reasonable cost, including the risk of reserve revisions due to economic and<br />
technical factors. Reserve revisions can have a positive or negative impact on asset valuations, AROs and depletion rates;<br />
� � Pricing risk of marketing reserves at an acceptable price given current market conditions;<br />
� � Regulatory risk related to approval for exploration and development activities, which can add to costs or cause delays in projects;<br />
� � Labour risk associated with securing the manpower necessary to complete capital projects in a timely and cost effective manner;<br />
� � Operating hazards and other difficulties inherent in the exploration for and production and sale of crude oil and natural gas;<br />
� � Success of exploration and development activities;<br />
� � Timing and success of integrating the business and operations of acquired companies;<br />
� � Credit risk related to non-payment for sales contracts or non-performance by counterparties to contracts;<br />
� � Interest rate risk associated with the Company’s ability to secure financing at commercially acceptable terms;<br />
� � Foreign exchange risk due to fluctuating exchange rates, as the majority of sales are based in US dollars;<br />
� � Environmental impact risk associated with exploration and development activities;<br />
� � Risk of catastrophic loss due to fire, explosion or acts of nature;<br />
� � Geopolitical risks associated with changing governmental policies, social instability and other political, economic or diplomatic<br />
developments in the Company’s international operations; and<br />
� � Other circumstances affecting revenue and expenses.<br />
The Company uses a variety of means to help minimize these risks. The Company maintains a comprehensive insurance program to reduce<br />
risk to an acceptable level and to protect it against significant losses. Operational control is enhanced by focusing efforts on large core<br />
regions with high working interests and by assuming operatorship of all key facilities. Product mix is diversified, ranging from the production<br />
of natural gas to the production of crude oil of various grades. The Company believes this diversification reduces price risk when compared<br />
with over-leverage to one commodity. Sales of crude oil and natural gas are aimed at various markets to ensure that undue exposure to<br />
any one market does not exist. Financial instruments are utilized to help ensure targets are met and to manage commodity prices, foreign<br />
currency rates and interest rate exposure. The Company minimizes credit risks by only entering into sales contracts and financial derivatives<br />
with highly rated entities and financial institutions. The arrangements and policies concerning the Company’s financial instruments are<br />
under constant review and may change depending upon the prevailing market conditions. Refer to the “Risk management activities”<br />
section of this MD&A. In addition, the Company reviews its exposure to individual companies on a regular basis, and where appropriate<br />
ensures that parental guarantees or letters of credit are in place to minimize the impact in the event of default.<br />
The Company’s capital structure mix is also monitored on a continual basis to ensure that it optimizes flexibility, minimizes cost and offers<br />
the greatest opportunity for growth. This includes the determination of a reasonable level of debt and any interest rate exposure risk that<br />
may exist.<br />
For additional detail regarding the Company’s risks and uncertainties, refer to the Company’s most recent Annual Information Form.
Management’s Discussion & Analysis<br />
Page 65 of 107<br />
ENVIRONMENT<br />
The crude oil and natural gas industry is experiencing incremental increases in costs related to environmental regulation, particularly in North<br />
America and the North Sea. Existing and expected legislation and regulations will require the Company to address and mitigate the effect<br />
of its activities on the environment. This will include dismantling production facilities and remediating damage caused by the disposal or<br />
release of specified substances. Increasingly stringent laws and regulations may have an adverse effect on the Company’s future net earnings<br />
and cash flow from operations.<br />
The Company’s associated risk management strategies focus on working with legislators and regulators to ensure that any new or revised<br />
policies, legislation or regulations properly reflect a balanced approach to sustainable development. Specific measures in response to existing<br />
or new legislation include a focus on the Company’s energy efficiency, air emissions management, released water quality, reduced fresh<br />
water use and the minimization of the impact on the landscape. The Company’s strategy employs an Environmental Management Plan (the<br />
“Plan”), a detailed copy of which is presented to, and reviewed by, the Board of Directors annually. The Plan is updated quarterly at the<br />
Directors’ meetings.<br />
The Company’s Plan and operating guidelines focus on minimizing the impact of operations while meeting regulatory requirements and<br />
internal corporate standards. The Company, as part of this Plan, has implemented a proactive program that includes:<br />
� � An annual internal environmental compliance audit and inspection program of the Company’s operating facilities;<br />
� � A suspended well inspection program to support future development or eventual abandonment;<br />
� � Appropriate reclamation and decommissioning standards for wells and facilities ready for abandonment;<br />
� � An effective surface reclamation program;<br />
� � A due diligence program related to groundwater monitoring;<br />
� � An active program related to preventing and reclaiming spill sites;<br />
� � A solution gas reduction and conservation program; and<br />
� � A program to replace the majority of fresh water for steaming with brackish water.<br />
The Company has also established stringent operating standards in four areas:<br />
1. Using water-based, environmentally friendly drilling muds whenever possible;<br />
2. Implementing cost effective ways of reducing greenhouse gas emissions per unit of production;<br />
3. Exercising care with respect to all waste produced through effective waste management plans; and<br />
4. Minimizing produced water volumes onshore and offshore through cost-effective measures.<br />
In 2006, the Company’s capital expenditures included $75 million for abandonment expenditures, an increase from $46 million in 2005<br />
(2004 – $32 million).<br />
The Company’s estimated undiscounted ARO at December 31, 2006 was as follows:<br />
Estimated ARO, undiscounted ($ millions) 2006 2005<br />
North America $ 2,826 $ 2,050<br />
North Sea 1,543 1,185<br />
Offshore West Africa 128 90<br />
4,497 3,325<br />
North Sea PRT recovery (625) (370)<br />
$ 3,872 $ 2,955<br />
The estimate of the ARO is based on estimates of future costs to abandon and restore the wells, production facilities and offshore<br />
production platforms. Factors that affect costs include number of wells drilled, well depth and the specific environmental legislation. The<br />
estimated costs are based on engineering estimates using current costs in accordance with present legislation and industry operating<br />
practice. The Company’s strategy in the North Sea consists of developing commercial hubs around its core operated properties with the<br />
goal of increasing production, lowering costs and extending the economic lives of its production facilities, thereby delaying the eventual<br />
abandonment dates. The future abandonment costs incurred in the North Sea are expected to result in an estimated PRT recovery of<br />
$625 million (2005 – $370 million, 2004 – $600 million), as abandonment costs are an allowable deduction in determining PRT and may be<br />
carried back to reclaim PRT previously paid. The expected PRT recovery reduces the Company’s net abandonment liability to $3,872 million<br />
(2005 – $2,955 million).
<strong>Canadian</strong> <strong>Natural</strong> AR2006<br />
Page 66 of 107<br />
GREENHOUSE GAS AND OTHER AIR EMISSIONS<br />
The Company is concurrently working with legislators and regulators on the design of new greenhouse gas emission laws and regulations and<br />
is pursuing an integrated emissions reduction strategy, to ensure the Company is able to comply with existing and future emission reductions<br />
requirements. The Company continues to develop strategies that will enable it to deal with the risks and opportunities associated with new<br />
climate change policies. In addition, the Company is working with relevant parties to ensure that new policies encourage innovation, energy<br />
efficiency, targeted research and development while not impacting competitiveness.<br />
The Company continues to work with <strong>Canadian</strong> Federal and Provincial governments on the regulatory framework for greenhouse gases<br />
for larger emitters. The Company is actively promoting a harmonized regulatory framework between the two levels of government. Both<br />
levels of government have indicated that existing legislation will be amended in 2007 to create further requirements for reporting emissions,<br />
facility-based emission intensity targets and regulatory compliance. Compliance with emission intensity targets is expected for 2008 and<br />
possibly a part of 2007 for larger facilities in Alberta.<br />
Issues to be resolved include, but are not limited to: the outcome of discussions between the Federal and Provincial Governments, the<br />
impact of implementing legislation, the allocations of reduction obligations among industry sectors and international developments.<br />
Any required reductions in the greenhouse gases emitted from the Company’s operations could increase capital expenditures and operating<br />
expenses, especially those related to the Horizon Project and the Company’s other existing and planned large oil sands projects. This may<br />
have an adverse effect on the Company’s net earnings and cash flow from operations.<br />
CRITICAL ACCOUNTING ESTIMATES<br />
The preparation of financial statements requires the Company to make judgements, assumptions and estimates in the application of generally<br />
accepted accounting principles that have a significant impact on the Company’s financial position and reported results of operations.<br />
Actual results could differ from those estimates, and those differences could be material. Critical accounting estimates are reviewed by<br />
the Company’s Audit Committee annually. The Company believes the following are the most critical accounting estimates in preparing its<br />
consolidated financial statements.<br />
PROPERTY, PLANT AND EQUIPMENT/DEPLETION, DEPRECIATION AND AMORTIZATION<br />
The Company follows the full cost method of accounting for its conventional crude oil and natural gas properties and equipment.<br />
Accordingly, all costs relating to the exploration for and development of conventional crude oil and natural gas reserves, whether successful<br />
or not, are capitalized and accumulated in country-by-country cost centres. Proceeds on disposal of properties are ordinarily deducted from<br />
such costs without recognition of profit or loss except where such disposal constitutes a significant portion of the Company’s reserves<br />
in that country. Under <strong>Canadian</strong> GAAP, substantially all of the capitalized costs and future capital costs related to each cost centre from<br />
which there is production are depleted on the unit-of-production method based on the estimated proved reserves of that country using<br />
estimated future prices and costs, rather than constant dollar pricing as required by the SEC. The carrying amount of crude oil and natural<br />
gas properties in each cost centre may not exceed their recoverable amount (“the ceiling test”). The recoverable amount is calculated as<br />
the undiscounted cash flow using proved reserves and estimated future prices and costs. If the carrying amount of a cost centre exceeds its<br />
recoverable amount, an impairment loss equal to the amount by which the carrying amount of the properties exceeds their estimated fair<br />
value is charged against net earnings. Fair value is calculated as the cash flow from those properties using proved and probable reserves and<br />
estimated future prices and costs, discounted at a risk-free interest rate.<br />
The alternate acceptable method of accounting for crude oil and natural gas properties and equipment is the successful efforts method.<br />
A major difference in applying the successful efforts method is that exploratory dry holes and geological and geophysical exploration costs<br />
would be charged against net earnings in the year incurred rather than being capitalized to property, plant and equipment. In addition,<br />
under this method cost centres are defined based on reserve pools rather than by country. The use of the full cost method usually results in<br />
higher capitalized costs and increased DD&A rates compared to the successful efforts method.<br />
CRUDE OIL AND NATURAL GAS RESERVES<br />
The Company retains qualified independent reserves evaluators to evaluate the Company’s proved, and proved and probable crude oil and<br />
natural gas reserves. In 2006, 100% of the Company’s reserves were evaluated by qualified independent reserves evaluators.<br />
The estimation of reserves involves the exercise of judgement. Forecasts are based on engineering data, future prices, expected future rates<br />
of production and the timing of future capital expenditures, all of which are subject to many uncertainties and interpretations. The Company<br />
expects that over time its reserve estimates will be revised upward or downward based on updated information such as the results of future<br />
drilling, testing and production levels. Reserve estimates can have a significant impact on net earnings, as they are a key component in<br />
the calculation of depletion, depreciation and amortization and for determining potential asset impairment. For example, a revision to the<br />
proved reserve estimates would result in a higher or lower DD&A charge to net earnings. Downward revisions to reserve estimates could also<br />
result in a write-down of crude oil and natural gas property, plant and equipment carrying amounts under the ceiling test.
Management’s Discussion & Analysis<br />
Page 67 of 107<br />
ASSET RETIREMENT OBLIGATIONS<br />
Under CICA Handbook Section 3110, Asset Retirement Obligations, the Company is required to recognize a liability for the future retirement<br />
obligations associated with its property, plant and equipment. An ARO is recognized to the extent of a legal obligation associated with the<br />
retirement of a tangible long-lived asset the Company is required to settle as a result of an existing or enacted law, statute, ordinance or<br />
written or oral contract, or by legal construction of a contract under the doctrine of promissory estoppel. The ARO is based on estimated<br />
costs, taking into account the anticipated method and extent of restoration consistent with legal requirements, technological advances and<br />
the possible use of the site. Since these estimates are specific to the sites involved, there are many individual assumptions underlying the<br />
Company’s total ARO amount. These individual assumptions can be subject to change based on experience.<br />
The estimated fair values of ARO related to long-term assets are recognized as a liability in the period in which they are incurred. Retirement<br />
costs equal to the estimated fair value of the ARO is capitalized as part of the cost of associated capital assets and are amortized to expense<br />
through depletion over the life of the asset. The fair value of the ARO is estimated by discounting the expected future cash flows to settle the<br />
ARO at the Company’s average credit-adjusted risk-free interest rate, which is currently 6.7%. In subsequent periods, the ARO is adjusted<br />
for the passage of time and for any changes in the amount or timing of the underlying future cash flows. The estimates described impact<br />
earnings by way of depletion on the capital cost and accretion on the asset retirement liability. In addition, differences between actual and<br />
estimated costs to settle the ARO, timing of cash flows to settle the obligation and future inflation rates could result in gains or losses on<br />
the final settlement of the ARO.<br />
An ARO is not recognized for assets with an indeterminate useful life (e.g. pipeline assets) because an amount cannot be reasonably<br />
determined. An ARO for these assets will be recorded in the first period in which the lives of these assets are determinable.<br />
INCOME TAXES<br />
The Company follows the liability method of accounting for income taxes. Under this method, future income tax assets and liabilities are<br />
recognized based on the estimated tax effects of temporary differences in the carrying value of assets and liabilities in the consolidated<br />
financial statements and their respective tax bases, using income tax rates substantively enacted as of the consolidated balance sheet date.<br />
Accounting for income taxes is an inherently complex process that requires management to interpret frequently changing regulations (e.g.<br />
changing income tax rates) and make certain judgements with respect to the application of tax law. These interpretations and judgements<br />
impact the current and future income tax provisions, future income tax assets and liabilities and net earnings.<br />
RISK MANAGEMENT ACTIVITIES<br />
The Company utilizes various instruments to manage its commodity price, currency and interest rate exposures. These derivative and<br />
financial instruments are not intended for trading or speculative purposes.<br />
On January 1, 2004, the fair values of all outstanding derivative financial instruments that were not designated as hedges for accounting<br />
purposes were recorded on the consolidated balance sheet, with an offsetting net deferred revenue amount. Subsequent net changes in<br />
the fair value of non-designated financial instruments have been recognized on the consolidated balance sheet and in net earnings. The<br />
estimated fair value for all derivative financial instruments is based on third party indications. The cash settlement amount of the derivative<br />
financial instruments may vary materially depending upon the underlying crude oil and natural gas prices at the time of final settlement of<br />
the derivative financial instruments, as compared to their mark-to-market value at December 31, 2006.<br />
Effective January 1, 2007, the Company will adopt new accounting standards relating to the accounting for and disclosure of financial<br />
instruments. The estimated effects on the Company’s consolidated balance sheet are discussed in further detail on page 68 of this MD&A.<br />
PURCHASE PRICE ALLOCATIONS<br />
The costs of business combinations and asset acquisitions are allocated to the underlying acquired assets and liabilities based on their<br />
estimated fair value at the time of acquisition. The determination of fair value requires the Company to make assumptions and estimates<br />
regarding future events. The allocation process is inherently subjective and impacts the amounts assigned to individually identifiable assets<br />
and liabilities. As a result, the purchase price allocation impacts the Company’s reported assets and liabilities and future net earnings due to<br />
the impact on future DD&A expense and impairment tests.<br />
The Company has made various assumptions in determining the fair values of the acquired assets and liabilities. The most significant<br />
assumptions and judgments relate to the estimation of the fair value of the crude oil and natural gas properties. To determine the fair<br />
value of these properties, the Company estimates (a) crude oil and natural gas reserves, and (b) future prices of crude oil and natural gas.<br />
Reserve estimates are based on the work performed by the Company’s engineers and outside consultants. The judgments associated with<br />
these estimated reserves are described above in “Crude oil and natural gas reserves”. Estimates of future prices are based on prices derived<br />
from price forecasts among industry analysts and internal assessments. The Company applies estimated future prices to the estimated<br />
reserves quantities acquired, and estimates future operating and development costs, to arrive at estimated future net revenues for the<br />
properties acquired.
<strong>Canadian</strong> <strong>Natural</strong> AR2006<br />
Page 68 of 107<br />
CONTROL ENVIRONMENT<br />
The Company’s management, including the President and Chief Operating Officer and the Chief Financial Officer and Senior Vice-President,<br />
Finance, evaluated the effectiveness of disclosure controls and procedures as at December 31, 2006, and concluded that disclosure controls<br />
and procedures are effective to ensure that information required to be disclosed by the Company in its annual filings and other reports filed<br />
with securities regulatory authorities in Canada and the United States is recorded, processed, summarized and reported within the time<br />
periods specified and such information is accumulated and communicated to allow timely decisions regarding required disclosures.<br />
The President and Chief Operating Officer and the Chief Financial Officer and Senior Vice-President, Finance also performed an assessment<br />
of internal control over financial reporting as at December 31, 2006, and concluded that internal control over financial reporting is effective.<br />
Further, there were no changes in the Company’s internal control over financial reporting during 2006 that have materially affected, or are<br />
reasonably likely to materially affect, internal controls over financial reporting.<br />
While the Company believes that its disclosure controls and procedures and internal controls over financial reporting provide a reasonable<br />
level of assurance that they are effective, it recognizes that all internal control systems have inherent limitations. Because of its inherent<br />
limitations, the Company’s internal control system may not prevent or detect misstatements. Also, projections of any evaluation of<br />
effectiveness to future periods are subject to the risk that controls may become inadequate because of changes in conditions, or that the<br />
degree of compliance with the policies or procedures may deteriorate.<br />
NEW ACCOUNTING STANDARDS<br />
Effective January 1, 2007, the Company will adopt the following new accounting standards relating to the accounting for and disclosure<br />
of financial instruments:<br />
� � Section 1530 – “Comprehensive Income” introduces the concept of comprehensive income to <strong>Canadian</strong> GAAP. Comprehensive income<br />
is the change in equity (net assets) of the Company during a reporting period from transactions and other events and circumstances<br />
from non-owner sources. It includes all changes in equity during a period except those resulting from investments by owners and<br />
distributions to owners.<br />
Foreign currency translation adjustment, which is currently a separate component of shareholders’ equity, will be recorded as part of<br />
accumulated other comprehensive income.<br />
� � Section 3251 – “Equity” replaces Section 3250 – “Surplus” and establishes standards for the presentation of equity and changes<br />
in equity during a reporting period. Financial statements of prior periods will be restated only for the foreign currency translation<br />
adjustment.<br />
� � Section 3855 – “Financial Instruments – Recognition and Measurement” prescribes when a financial asset, financial liability, or nonfinancial<br />
derivative is to be recognized on the balance sheet as well as its measurement amount. This section also specifies how financial<br />
instruments gains and losses are to be presented.<br />
The Company will add all transaction costs that are directly attributable to the acquisition or issue of a financial asset or financial liability<br />
to the fair value of the financial asset or financial liability. These adjustments were previously recorded in deferred charges. Transaction<br />
costs added to the fair value of the financial asset or financial liability will be amortized using the effective interest method.<br />
� � Section 3865 – “Hedges” replaces Accounting Guideline 13 – “Hedging Relationships” and EIC 128 – “Accounting for Trading,<br />
Speculative or Non-Hedging Derivative Financial Instruments” and specifies how hedge accounting is to be applied and what disclosures<br />
are necessary when hedge accounting is applied.<br />
Adoption of this standard will require the Company to record all of its derivative financial instruments on the balance sheet at fair<br />
value, including those designated as hedges. Designated hedges are currently not recognized on the balance sheet but are disclosed<br />
in the notes to the financial statements. The adjustment to recognize the designated hedges on the balance sheet will be recorded as<br />
an adjustment to the opening balance of retained earnings or accumulated other comprehensive income, as appropriate.<br />
Subsequently, if the derivative is designated as a fair value hedge, changes in the fair value of the derivative and changes in the fair<br />
value of the hedged item attributable to the hedged risk are recognized in the consolidated statements of earnings each period. If the<br />
derivative is designated as a cash flow hedge, the effective portions of the changes in fair value of the derivative are initially recorded<br />
in other comprehensive income (“OCI”) each period and are recognized in the consolidated statements of earnings when the hedged<br />
item is recognized. Therefore, ineffective portions of changes in the fair value of hedging instruments are recognized in net earnings<br />
immediately for both fair value and cash flow hedges.<br />
Adoption of these standards will have the following estimated effects on the Company’s consolidated balance sheet as at<br />
January 1, 2007:<br />
($ millions)<br />
Decrease future income tax asset $ (62)<br />
Increase current portion of other long-term assets $ 193<br />
Decrease other long-term assets $ (16)<br />
Decrease long-term debt $ (72)<br />
Increase future income tax liability $ 18<br />
Increase retained earnings $ 10<br />
Increase foreign currency translation adjustment $ 13<br />
Increase accumulated other comprehensive income $ 146
Management’s Discussion & Analysis<br />
Page 69 of 107<br />
OUTLOOK<br />
The Company continues to implement its strategy of maintaining a large portfolio of varied projects, which the Company believes will<br />
enable it, over an extended period of time, to provide consistent growth in production and high shareholder returns. Annual budgets are<br />
developed, scrutinized throughout the year and changed if necessary in the context of project returns, product pricing expectations, and<br />
balance in project risk and time horizons. The Company maintains a high ownership level and operatorship level in all of its properties and<br />
can therefore control the nature, timing and extent of capital expenditures in each of its project areas.<br />
The Company expects production levels in 2007 to average between 315,000 bbl/d and 360,000 bbl/d of crude oil and NGLs and between<br />
1,594 mmcf/d and 1,664 mmcf/d of natural gas.<br />
The forecasted capital expenditures in 2007 are currently expected to be as follows:<br />
($ millions) 2007 Forecast<br />
North America natural gas $ 1,111<br />
North America crude oil and NGLs 1,350<br />
North Sea 521<br />
Offshore West Africa 114<br />
Property acquisitions and midstream 16<br />
3,112<br />
Horizon Project Phase 1 construction (1) 2,610<br />
Capitalized interest and other items 397<br />
Horizon Project Phases 2/3 engineering 109<br />
<strong>Canadian</strong> <strong>Natural</strong> Upgrader engineering 5<br />
Total $ 6,233<br />
(1) Forecast to be in the range of $2,410 million to $2,810 million, the final level of expenditure will be dependent upon the ability of certain contractors to advance<br />
portions of their efforts from 2008 into 2007 as well as the extent of any realized cost pressures on certain isolated portions of the Horizon Project.<br />
NORTH AMERICA NATURAL GAS<br />
The 2007 North America natural gas drilling program is highlighted by the high-grading of the Company’s natural gas asset base, including<br />
the properties acquired through the ACC acquisition, as follows:<br />
(number of wells) 2007 Forecast<br />
Northeast British Columbia 58<br />
Northwest Alberta 123<br />
Northern Plains 172<br />
Southern Plains 70<br />
Total 423<br />
NORTH AMERICA CRUDE OIL AND NGLS<br />
The 2007 North America crude oil drilling program is highlighted by continued development of its Primrose thermal projects, Pelican Lake,<br />
and a strong conventional heavy program, as follows:<br />
(number of wells) 2007 Forecast<br />
Conventional heavy crude oil 369<br />
Thermal heavy crude oil 58<br />
Light crude oil 107<br />
Pelican Lake crude oil 132<br />
Total 666<br />
The Company has reduced forecasted natural gas capital for 2007 by approximately 40% from 2006 levels due to the shift in capital<br />
allocation to higher return crude oil projects in the near term. Allocation of natural gas capital between existing and newly acquired ACC<br />
lands will be the result of a high-grading process focusing on the highest return projects. No changes to the long-term natural gas plans of<br />
the Company are being contemplated.<br />
The Company continues the disciplined development of its heavy crude oil resources. Crude oil capital has been maintained with 2006 levels<br />
as the Company continues to develop long-term production growth projects at Pelican Lake and in-situ oilsands at Primrose and Kirby.<br />
THE HORIZON PROJECT<br />
The final level of capital expenditure on the Horizon Project will be dependent upon the ability of certain of the contractors to advance<br />
portions of their efforts from 2008 into 2007, as well as the extent of any realized cost pressures on certain isolated portions of the<br />
project.<br />
The 2007 capital forecast for the Horizon Project targets the completion of most major plants with the commissioning process to be<br />
substantially underway. The Ore Preparation Plant and Tailings Systems are targeted to be mechanically complete and ready to commission
<strong>Canadian</strong> <strong>Natural</strong> AR2006<br />
Page 70 of 107<br />
with the majority of utilities and offsite systems operational. The Upgrader is targeted to be nearing completion, with half of the related<br />
plants completed. A total of 156 stratigraphic test wells are targeted to be drilled on the Horizon Project leases during 2007.<br />
NORTH SEA<br />
The 2007 capital forecast for the North Sea includes drilling 7.4 producer wells and 7.2 service wells. The development of the Lyell Field is<br />
targeted for completion in late 2007.<br />
OFFSHORE WEST AFRICA<br />
The 2007 capital forecast for Offshore West Africa includes drilling 3.0 producer wells and 1.2 service well at West Espoir.<br />
SENSITIVITY ANALYSIS (1)<br />
The following table is indicative of the annualized sensitivities of cash flow from operations and net earnings from changes in certain key<br />
variables. The analysis is based on business conditions and sales volumes during the fourth quarter of 2006, and is not necessarily indicative<br />
of future results. Each separate line item in the sensitivity analysis shows the effect of a change in that variable only; all other variables are<br />
held constant.<br />
Cash flow Cash flow<br />
from from Net Net<br />
operations operations earnings earnings<br />
($ millions) ($/share, basic) ($ millions) ($/share, basic)<br />
Price changes<br />
Crude oil – WTI US$1.00/bbl (2)<br />
Excluding financial derivatives $ 116 $ 0.22 $ 81 $ 0.15<br />
Including financial derivatives<br />
<strong>Natural</strong> gas – AECO C$0.10/mcf<br />
$ 26-110 $ 0.05-0.21 $ 20-77 $ 0.04-0.14<br />
(2)<br />
Excluding financial derivatives $ 26 $ 0.05 $ 14 $ 0.03<br />
Including financial derivatives<br />
Volume changes<br />
$ 1-8 $ 0.00-0.02 $ 2-4 $ 0.00-0.01<br />
Crude oil – 10,000 bbl/d $ 98 $ 0.18 $ 44 $ 0.08<br />
<strong>Natural</strong> gas – 10 mmcf/d<br />
Foreign currency rate change<br />
$0.01 change in C$ in relation to US$<br />
$ 17 $ 0.03 $ 6 $ 0.01<br />
(2)<br />
Excluding financial derivatives $ 80-82 $ 0.15 $ 23-24 $ 0.04<br />
Interest rate change – 1% $ 48 $ 0.09 $ 48 $ 0.09<br />
(1) The sensitivities are calculated based on 2006 fourth quarter results and exclude mark-to-market gains (losses) on risk management activities.<br />
(2) For details of financial instruments in place, refer to note 12 to the Company’s audited annual consolidated financial statements as at December 31, 2006.<br />
DAILY PRODUCTION BY SEGMENT, BEFORE ROYALTIES<br />
Q1 Q2 Q3 Q4 2006 2005 2004<br />
Crude oil and NGLs (bbl/d)<br />
North America 222,955 234,780 233,440 249,565 235,253 221,669 206,225<br />
North Sea 60,802 63,703 53,988 61,786 60,056 68,593 64,706<br />
Offshore West Africa 39,905 40,369 34,237 32,354 36,689 22,906 11,558<br />
Total<br />
<strong>Natural</strong> gas (mmcf/d)<br />
323,662 338,852 321,665 343,705 331,998 313,168 282,489<br />
North America 1,411 1,448 1,416 1,594 1,468 1,416 1,330<br />
North Sea 17 17 11 16 15 19 50<br />
Offshore West Africa 8 10 10 10 9 4 8<br />
Total<br />
Barrels of oil equivalent (boe/d)<br />
1,436 1,475 1,437 1,620 1,492 1,439 1,388<br />
North America 458,158 476,143 469,440 515,313 479,891 457,695 427,936<br />
North Sea 63,589 66,426 55,790 64,490 62,558 71,651 73,093<br />
Offshore West Africa 41,280 42,042 35,922 33,961 38,275 23,614 12,806<br />
Total 563,027 584,611 561,152 613,764 580,724 552,960 513,835
Management’s Discussion & Analysis<br />
Page 71 of 107<br />
PER UNIT RESULTS (1)<br />
Q1 Q2 Q3 Q4 2006 2005 2004<br />
Crude oil and NGLs ($/bbl)<br />
Sales price (2) $ 43.79 $ 60.05 $ 62.55 $ 47.27 $ 53.65 $ 46.86 $ 37.99<br />
Royalties 3.48 5.14 5.11 4.10 4.48 3.97 3.16<br />
Production expense 11.33 11.92 13.47 12.32 12.29 11.17 10.05<br />
Netback<br />
<strong>Natural</strong> gas ($/mcf)<br />
$ 28.98 $ 42.99 $ 43.97 $ 30.85 $ 36.88 $ 31.72 $ 24.78<br />
Sales price (2) $ 8.30 $ 6.16 $ 5.83 $ 6.66 $ 6.72 $ 8.57 $ 6.50<br />
Royalties 1.70 1.11 1.11 1.26 1.29 1.75 1.35<br />
Production expense 0.80 0.80 0.84 0.86 0.82 0.73 0.67<br />
Netback<br />
Barrels of oil equivalent ($/boe)<br />
$ 5.80 $ 4.25 $ 3.88 $ 4.54 $ 4.61 $ 6.09 $ 4.48<br />
Sales price (2) $ 46.30 $ 50.36 $ 51.21 $ 43.91 $ 47.92 $ 48.77 $ 38.45<br />
Royalties 6.44 5.80 5.75 5.62 5.89 6.82 5.37<br />
Production expense 8.46 8.85 10.01 9.16 9.14 8.21 7.35<br />
Netback $ 31.40 $ 35.71 $ 35.45 $ 29.13 $ 32.89 $ 33.74 $ 25.73<br />
(1) Amounts expressed on a per unit basis are based on sales volumes.<br />
(2) Net of transportation and blending costs and excluding risk management activities.<br />
NETBACK ANALYSIS<br />
($/boe) (1) 2006 2005 2004<br />
Sales price (2) $ 47.92 $ 48.77 $ 38.45<br />
Royalties 5.89 6.82 5.37<br />
Production expense (3) 9.14 8.21 7.35<br />
Netback 32.89 33.74 25.73<br />
Midstream contribution (3) (0.23) (0.26) (0.26)<br />
Administration (4) 0.85 0.75 0.66<br />
Interest, net 0.66 0.74 1.01<br />
Realized risk management activities 6.27 5.13 2.52<br />
Realized foreign exchange (gain) loss (0.06) (0.15) 0.02<br />
Taxes other than income tax – current 1.04 1.01 1.12<br />
Current income tax – North America 0.68 0.50 0.53<br />
Current income tax – North Sea 0.14 0.77 0.01<br />
Current income tax – Offshore West Africa 0.23 0.17 0.07<br />
Cash flow $ 23.31 $ 25.08 $ 20.05<br />
(1) Amounts expressed on a per unit basis are based on sales volumes.<br />
(2) Net of transportation and blending costs and excluding risk management activities.<br />
(3) Excluding inter-segment eliminations.<br />
(4) Restated to conform to current year presentation.<br />
TRADING AND SHARE STATISTICS<br />
Q1 Q2 Q3 Q4 2006 Total 2005 Total<br />
TSX–C$<br />
Trading volume (thousands)<br />
Share price ($/share)<br />
134,487 129,036 127,022 118,390 508,935 637,992<br />
High $ 73.91 $ 72.70 $ 63.30 $ 63.50 $ 73.91 $ 62.00<br />
Low $ 57.75 $ 50.78 $ 47.28 $ 45.49 $ 45.49 $ 24.28<br />
Close<br />
Market capitalization<br />
$ 64.90 $ 61.72 $ 50.94 $ 62.15 $ 62.15 $ 57.63<br />
at December 31 ($ millions) $ 33,431 $ 30,910<br />
Shares outstanding (thousands)<br />
NYSE – US$<br />
537,903 536,348<br />
Trading volume (thousands)<br />
Share price ($/share)<br />
78,836 102,472 101,438 119,163 401,909 251,554<br />
High $ 64.38 $ 63.93 $ 56.68 $ 55.48 $ 64.38 $ 54.05<br />
Low $ 49.62 $ 45.67 $ 42.38 $ 40.29 $ 40.29 $ 19.74<br />
Close<br />
Market capitalization at<br />
$ 55.39 $ 55.38 $ 45.58 $ 53.23 $ 53.23 $ 49.62<br />
December 31 ($ millions) $ 28,633 $ 26,614<br />
Shares outstanding (thousands) 537,903 536,348
<strong>Canadian</strong> <strong>Natural</strong> AR2006<br />
Page 72 of 107<br />
Management’s Report<br />
The accompanying consolidated financial statements and all other information contained elsewhere in this annual report are the responsibility<br />
of management. The consolidated financial statements have been prepared by management in accordance with the accounting policies<br />
described in the accompanying notes. Where necessary, management has made informed judgements and estimates in accounting for<br />
transactions that were not complete at the balance sheet date. In the opinion of management, the financial statements have been prepared<br />
in accordance with <strong>Canadian</strong> generally accepted accounting principles appropriate in the circumstances. The financial information presented<br />
elsewhere in the annual report has been reviewed to ensure consistency with that in the consolidated financial statements.<br />
Management maintains appropriate systems of internal control. Policies and procedures are designed to give reasonable assurance that<br />
transactions are appropriately authorized and recorded, assets are safeguarded from loss or unauthorized use and financial records are<br />
properly maintained to provide reliable information for preparation of financial statements.<br />
PricewaterhouseCoopers LLP, an independent firm of Chartered Accountants, has been engaged, as approved by a vote of the shareholders<br />
at the Company’s most recent Annual General Meeting, to audit and provide their independent audit opinions on the following:<br />
� � the Company’s consolidated financial statements as at December 31, 2006;<br />
� � the effectiveness of the Company’s internal control over financial reporting as at December 31, 2006; and<br />
� � management’s assessment of the Company’s internal control over financial reporting as at December 31, 2006.<br />
Their report is presented with the consolidated financial statements.<br />
The Board of Directors (the “Board”) is responsible for ensuring that management fulfills its responsibilities for financial reporting and<br />
internal controls. The Board exercises this responsibility through the Audit Committee of the Board, which is comprised of non-management<br />
directors. The Audit Committee meets with management and the independent auditors to satisfy itself that management responsibilities<br />
are properly discharged and to review the consolidated financial statements before they are presented to the Board for approval. The<br />
consolidated financial statements have been approved by the Board on the recommendation of the Audit Committee.<br />
Steve W. Laut Douglas A. Proll, CA Randall S. Davis, CA<br />
President & Chief Operating Officer Chief Financial Officer & Vice President, Finance & Accounting<br />
Senior Vice-President, Finance<br />
March 15, 2007<br />
Calgary, Alberta, Canada
Management’s and Auditor’s Reports<br />
Page 73 of 107<br />
Management’s Assessment of Internal<br />
Control Over Financial Reporting<br />
Management is responsible for establishing and maintaining adequate internal control over financial reporting for the Company as defined<br />
in Rule 15(d)-15(f) under the United States Securities Exchange Act of 1934, as amended.<br />
Management, together with the Company’s President and Chief Operating Officer and the Company’s Chief Financial Officer and Senior<br />
Vice-President, Finance, performed an assessment of the Company’s internal control over financial reporting based on the criteria established<br />
in Internal Control – Integrated Framework issued by the Committee of Sponsoring Organizations of the Treadway Commission (COSO).<br />
Based on the assessment, management, together with the Company’s President and Chief Operating Officer and the Company’s Chief<br />
Financial Officer and Senior Vice-President, Finance, has concluded that the Company’s internal control over financial reporting is effective as<br />
at December 31, 2006. Management recognizes that all internal control systems have inherent limitations. Because of its inherent limitations,<br />
internal control over financial reporting may not prevent or detect misstatements. Also, projections of any evaluation of effectiveness to<br />
future periods are subject to the risk that controls may become inadequate because of changes in conditions, or that the degree of<br />
compliance with the policies or procedures may deteriorate.<br />
Management’s assessment of the effectiveness of the Company’s internal control over financial reporting as at December 31, 2006, has<br />
been audited by PricewaterhouseCoopers LLP, independent auditors, as stated in their report presented with the audited consolidated<br />
financial statements.<br />
Steve W. Laut Douglas A. Proll, CA<br />
President & Chief Operating Officer Chief Financial Officer &<br />
Senior Vice-President, Finance<br />
March 15, 2007<br />
Calgary, Alberta, Canada
<strong>Canadian</strong> <strong>Natural</strong> AR2006<br />
Page 74 of 107<br />
Independent Auditor’s Report<br />
To the Shareholders of <strong>Canadian</strong> <strong>Natural</strong> <strong>Resources</strong> Limited<br />
We have completed an integrated audit of the consolidated financial statements and internal control over financial reporting of <strong>Canadian</strong><br />
<strong>Natural</strong> <strong>Resources</strong> Limited (the “Company”) as of December 31, 2006 and audits of its December 31, 2005 and December 31, 2004<br />
consolidated financial statements. Our opinions, based on our audits, are presented below.<br />
CONSOLIDATED FINANCIAL STATEMENTS<br />
We have audited the accompanying consolidated balance sheets of the Company as of December 31, 2006 and December 31, 2005, and the<br />
related consolidated statements of earnings, retained earnings and cash flows for each of the three years in the period ended December 31,<br />
2006. These financial statements are the responsibility of the Company’s management. Our responsibility is to express an opinion on these<br />
financial statements based on our audits.<br />
We conducted our audit of the Company’s financial statements as of December 31, 2006 and for the year then ended in accordance with<br />
<strong>Canadian</strong> generally accepted auditing standards and the standards of the Public Company Accounting Oversight Board (United States). We<br />
conducted our audits of the Company’s financial statements as of December 31, 2005 and for each of the two years in the period ended<br />
December 31, 2005 in accordance with <strong>Canadian</strong> generally accepted auditing standards. Those standards require that we plan and perform<br />
an audit to obtain reasonable assurance about whether the financial statements are free of material misstatement. An audit of financial<br />
statements includes examining, on a test basis, evidence supporting the amounts and disclosures in the financial statements. A financial<br />
statement audit also includes assessing the accounting principles used and significant estimates made by management, and evaluating the<br />
overall financial statement presentation.<br />
In our opinion, the consolidated financial statements referred to above present fairly, in all material respects, the financial position of the<br />
Company as of December 31, 2006 and December 31, 2005 and the results of its operations and its cash flows for each of the three years<br />
in the period ended December 31, 2006 in accordance with <strong>Canadian</strong> generally accepted accounting principles.<br />
INTERNAL CONTROL OVER FINANCIAL REPORTING<br />
We have also audited management’s assessment, included in the accompanying management’s assessment of internal control over financial<br />
reporting, that the Company maintained effective internal control over financial reporting as of December 31, 2006, based on criteria<br />
established in Internal Control - Integrated Framework issued by the Committee of Sponsoring Organizations of the Treadway Commission<br />
(COSO). The Company’s management is responsible for maintaining effective internal control over financial reporting and for its assessment<br />
of the effectiveness of internal control over financial reporting. Our responsibility is to express opinions on management’s assessment and<br />
on the effectiveness of the Company’s internal control over financial reporting based on our audit.<br />
We conducted our audit of internal control over financial reporting in accordance with the standards of the Public Company Accounting<br />
Oversight Board (United States). Those standards require that we plan and perform the audit to obtain reasonable assurance about<br />
whether effective internal control over financial reporting was maintained in all material respects. An audit of internal control over financial<br />
reporting includes obtaining an understanding of internal control over financial reporting, evaluating management’s assessment, testing<br />
and evaluating the design and operating effectiveness of internal control, and performing such other procedures as we consider necessary<br />
in the circumstances. We believe that our audit provides a reasonable basis for our opinions.<br />
A company’s internal control over financial reporting is a process designed to provide reasonable assurance regarding the reliability of<br />
financial reporting and the preparation of financial statements for external purposes in accordance with generally accepted accounting<br />
principles. A company’s internal control over financial reporting includes those policies and procedures that (i) pertain to the maintenance<br />
of records that, in reasonable detail, accurately and fairly reflect the transactions and dispositions of the assets of the company; (ii) provide<br />
reasonable assurance that transactions are recorded as necessary to permit preparation of financial statements in accordance with generally<br />
accepted accounting principles, and that receipts and expenditures of the company are being made only in accordance with authorizations of<br />
management and directors of the company; and (iii) provide reasonable assurance regarding prevention or timely detection of unauthorized<br />
acquisition, use, or disposition of the company’s assets that could have a material effect on the financial statements.<br />
Because of its inherent limitations, internal control over financial reporting may not prevent or detect misstatements. Also, projections of any<br />
evaluation of effectiveness to future periods are subject to the risk that controls may become inadequate because of changes in conditions,<br />
or that the degree of compliance with the policies or procedures may deteriorate.<br />
In our opinion, management’s assessment that the Company maintained effective internal control over financial reporting as of December<br />
31, 2006 is fairly stated, in all material respects, based on criteria established in Internal Control — Integrated Framework issued by the<br />
COSO. Furthermore, in our opinion, the Company maintained, in all material respects, effective internal control over financial reporting as<br />
of December 31, 2006 based on criteria established in Internal Control — Integrated Framework issued by the COSO.<br />
Chartered Accountants<br />
Calgary, Alberta, Canada<br />
March 15, 2007
Consolidated Financial Statements<br />
Page 75 of 107<br />
Consolidated Balance Sheets<br />
As at December 31<br />
(millions of <strong>Canadian</strong> dollars) 2006 2005<br />
ASSETS<br />
Current assets<br />
Cash and cash equivalents $ 23 $ 18<br />
Accounts receivable and other 1,947 1,546<br />
Future income tax (note 8) 163 487<br />
Current portion of other long-term assets (note 3) 106 –<br />
2,239 2,051<br />
Property, plant and equipment (note 4) 30,767 19,694<br />
Other long-term assets (note 3) 154 107<br />
$ 33,160 $ 21,852<br />
LIABILITIES<br />
Current liabilities<br />
Accounts payable $ 842 $ 573<br />
Accrued liabilities 1,618 1,781<br />
Current portion of other long-term liabilities (note 6) 611 1,471<br />
3,071 3,825<br />
Long-term debt (note 5) 11,043 3,321<br />
Other long-term liabilities (note 6) 1,393 1,434<br />
Future income tax (note 8) 6,963 5,035<br />
22,470 13,615<br />
SHAREHOLDERS’ EQUITY<br />
Share capital (note 9) 2,562 2,442<br />
Retained earnings 8,141 5,804<br />
Foreign currency translation adjustment (note 10) (13) (9)<br />
10,690 8,237<br />
$ 33,160 $ 21,852<br />
Commitments and contingencies (note 13)<br />
Approved by the Board of Directors:<br />
Catherine M. Best N. Murray Edwards<br />
Chair of the Audit Committee Vice-Chairman of the Board of Directors<br />
and Director and Director
<strong>Canadian</strong> <strong>Natural</strong> AR2006<br />
Page 76 of 107<br />
Consolidated Statements of Earnings<br />
For the years ended December 31<br />
(millions of <strong>Canadian</strong> dollars, except per common share amounts) 2006 2005 2004<br />
Revenue $ 11,643 $ 11,130 $ 8,269<br />
Less: royalties (1,245) (1,366) (1,011)<br />
Revenue, net of royalties<br />
Expenses<br />
10,398 9,764 7,258<br />
Production 1,949 1,663 1,400<br />
Transportation and blending 1,443 1,293 972<br />
Depletion, depreciation and amortization 2,391 2,013 1,769<br />
Asset retirement obligation accretion (note 6) 68 69 51<br />
Administration 180 151 125<br />
Stock-based compensation (note 6) 139 723 249<br />
Interest, net 140 149 189<br />
Risk management activities (note 12) 312 1,952 434<br />
Foreign exchange loss (gain) 122 (132) (91)<br />
6,744 7,881 5,098<br />
Earnings before taxes 3,654 1,883 2,160<br />
Taxes other than income tax (note 8) 256 194 165<br />
Current income tax (note 8) 222 286 116<br />
Future income tax (note 8) 652 353 474<br />
Net earnings $ 2,524 $ 1,050 $ 1,405<br />
Net earnings per common share (note 11)<br />
Basic $ 4.70 $ 1.96 $ 2.62<br />
Diluted $ 4.70 $ 1.95 $ 2.60<br />
Consolidated Statements<br />
of Retained Earnings<br />
For the years ended December 31<br />
(millions of <strong>Canadian</strong> dollars) 2006 2005 2004<br />
Balance – beginning of year $ 5,804 $ 4,922 $ 3,650<br />
Net earnings 2,524 1,050 1,405<br />
Dividends on common shares (note 9) (161) (127) (107)<br />
Purchase of common shares under Normal Course Issuer Bid (note 9) (26) (41) (26)<br />
Balance – end of year $ 8,141 $ 5,804 $ 4,922
Consolidated Financial Statements<br />
Page 77 of 107<br />
Consolidated Statements of Cash Flows<br />
For the years ended December 31<br />
(millions of <strong>Canadian</strong> dollars) 2006 2005 2004<br />
Operating activities<br />
Net earnings $ 2,524 $ 1,050 $ 1,405<br />
Non-cash items<br />
Depletion, depreciation and amortization 2,391 2,013 1,769<br />
Asset retirement obligation accretion 68 69 51<br />
Stock-based compensation 139 723 249<br />
Unrealized risk management activities (1,013) 925 (40)<br />
Unrealized foreign exchange loss (gain) 134 (103) (94)<br />
Deferred petroleum revenue tax expense (recovery) 37 (9) (45)<br />
Future income tax 652 353 474<br />
Deferred charges (2) (31) (33)<br />
Abandonment expenditures (75) (46) (32)<br />
Net change in non-cash working capital (note 14) (679) (147) (14)<br />
4,176 4,797 3,690<br />
Financing activities<br />
Issue (repayment) of bank credit facilities 6,499 (435) 357<br />
Issue (repayment) of medium-term notes 400 400 (125)<br />
Repayment of senior unsecured notes – (194) (54)<br />
Issue of US dollar debt securities 788 – 830<br />
Repayment of preferred securities – (107) –<br />
Repayment of obligations under capital leases – – (7)<br />
Issue of common shares on exercise of stock options 21 9 24<br />
Dividends on common shares (153) (121) (101)<br />
Purchase of common shares (28) (45) (33)<br />
Net change in non-cash working capital (note 14) 37 19 6<br />
7,564 (474) 897<br />
Investing activities<br />
Expenditures on property, plant and equipment (7,266) (5,340) (4,582)<br />
Net proceeds on sale of property, plant and equipment 71 454 7<br />
Net expenditures on property, plant and equipment (7,195) (4,886) (4,575)<br />
Acquisition of Anadarko Canada Corporation (note 2) (4,641) – –<br />
Net proceeds on sale of other assets – 11 –<br />
Net change in non-cash working capital (note 14) 101 542 (88)<br />
(11,735) (4,333) (4,663)<br />
Increase (decrease) in cash and cash equivalents 5 (10) (76)<br />
Cash and cash equivalents – beginning of year 18 28 104<br />
Cash and cash equivalents – end of year $ 23 $ 18 $ 28<br />
Supplemental disclosure of cash flow information (note 14)
<strong>Canadian</strong> <strong>Natural</strong> AR2006<br />
Page 78 of 107<br />
Notes to the Consolidated<br />
Financial Statements<br />
(tabular amounts in millions of <strong>Canadian</strong> dollars, unless otherwise stated)<br />
1. ACCOUNTING POLICIES<br />
<strong>Canadian</strong> <strong>Natural</strong> <strong>Resources</strong> Limited (the “Company”) is a senior independent crude oil and natural gas exploration, development and<br />
production company head-quartered in Calgary, Alberta, Canada. The Company’s operations are focused in North America, largely in<br />
Western Canada, the United Kingdom portion of the North Sea and Offshore West Africa. Within Western Canada, the Company is<br />
developing its Horizon Oil Sands Project (the “Horizon Project”) and maintains its midstream activities. The Horizon Project involves a plan<br />
to produce synthetic crude oil through mining and upgrading operations, while the midstream activities include the Company’s pipeline<br />
operations and an electricity co-generation system.<br />
The consolidated financial statements of the Company have been prepared in accordance with accounting principles generally accepted<br />
in Canada (“<strong>Canadian</strong> GAAP”). A summary of differences between accounting principles in Canada and those generally accepted in the<br />
United States (“US GAAP”) is contained in note 16.<br />
Significant accounting policies are summarized as follows:<br />
(A) PRINCIPLES OF CONSOLIDATION<br />
The consolidated financial statements include the accounts of the Company and all of its subsidiary companies and partnerships. A significant<br />
portion of the Company’s activities are conducted jointly with others and the consolidated financial statements reflect only the Company’s<br />
proportionate interest in such activities.<br />
(B) MEASUREMENT UNCERTAINTY<br />
Management has made estimates and assumptions regarding certain assets, liabilities, revenues and expenses in the preparation of the<br />
consolidated financial statements. Such estimates primarily relate to unsettled transactions and events as of the date of the consolidated<br />
financial statements. Accordingly, actual results may differ from estimated amounts.<br />
Purchase price allocations, depletion, depreciation and amortization, and amounts used for ceiling test calculations are based on estimates<br />
of crude oil and natural gas reserves and commodity prices, production expenses and capital costs required to develop and produce those<br />
reserves. Substantially all of the Company’s reserve estimates are evaluated annually by independent engineering firms. By their nature,<br />
estimates of reserves and the related future cash flows are subject to measurement uncertainty, and the impact of differences between<br />
actual and estimated amounts on the consolidated financial statements of future periods could be material.<br />
The calculation of asset retirement obligations includes estimates of the future costs to settle the asset retirement obligation, the timing of<br />
the cash flows to settle the obligation, and the future inflation rates. The impact of differences between actual and estimated costs, timing<br />
and inflation on the consolidated financial statements of future periods could be material.<br />
The measurement of petroleum revenue tax expense in the United Kingdom and the related provision in the consolidated financial statements<br />
are subject to uncertainty associated with future recoverability of crude oil and natural gas reserves, commodity prices and the timing of<br />
future events, which could result in material changes to deferred amounts.<br />
(C) CASH AND CASH EQUIVALENTS<br />
Cash comprises cash on hand and demand deposits. Other investments (term deposits and certificates of deposit) with an original term to<br />
maturity at purchase of three months or less are reported as cash equivalents on the balance sheet.<br />
(D) PROPERTY, PLANT AND EQUIPMENT<br />
The Company follows the full cost method of accounting for its conventional crude oil and natural gas properties and equipment as<br />
prescribed by Accounting Guideline 16 (“AcG 16”) by the <strong>Canadian</strong> Institute of Chartered Accountants (“CICA”). Accordingly, all costs<br />
relating to the exploration for and development of crude oil and natural gas reserves are capitalized and accumulated in country-by-country<br />
cost centres. Administrative overhead incurred during the development phase of large capital projects is capitalized until the projects are<br />
available for their intended use. Proceeds on disposal of properties are ordinarily deducted from such costs without recognition of profit or<br />
loss except where such disposal constitutes a significant portion of the Company’s reserves in that country.<br />
Contractual arrangements that meet the definition of a lease are accounted for as capital leases or operating leases as appropriate.<br />
Property acquisition, construction and development costs related to the Company’s Horizon Project are not accounted for under the full cost<br />
method of accounting and accordingly, are excluded from the Company’s <strong>Canadian</strong> conventional oil and gas cost centre. Construction costs<br />
are capitalized separately to each phase of the Horizon Project. The Company will review the recoverability of the carrying amount of the<br />
Horizon Project costs if events or circumstances indicate that the carrying amount may not be recoverable.
Notes to the Consolidated Financial Statements<br />
Page 79 of 107<br />
(E) DEPLETION, DEPRECIATION AND AMORTIZATION<br />
Substantially all costs related to each country-by-country cost centre are depleted on the unit-of-production method based on the estimated<br />
proved reserves of that country. Volumes of net production and net reserves before royalties are converted to equivalent units on the basis<br />
of estimated relative energy content. In determining its depletion base, the Company includes estimated future costs to be incurred in<br />
developing proved reserves and excludes the cost of unproved properties and major development projects. Unproved properties are assessed<br />
periodically to determine whether impairment has occurred. When proved reserves are assigned or the value of unproved property is<br />
considered to be impaired, the cost of the unproved property or the amount of the impairment is added to costs subject to depletion. Costs<br />
for major development projects, as identified by management, are not subject to depletion until the projects are available for their intended<br />
uses. Processing and production facilities are depreciated on a straight-line basis over their estimated lives.<br />
The Company reviews the carrying amount of its crude oil and natural gas properties (“the properties”) relative to their recoverable<br />
amount (“the ceiling test”) for each cost centre at each annual balance sheet date, or more frequently if circumstances or events indicate<br />
impairment may have occurred. The recoverable amount is calculated as the undiscounted cash flow from the properties using proved<br />
reserves and expected future prices and costs. If the carrying amount of the properties exceeds their recoverable amount, an impairment<br />
loss is recognized in depletion equal to the amount by which the carrying amount of the properties exceeds their fair value. Fair value is<br />
calculated as the cash flow from those properties using proved and probable reserves and expected future prices and costs, discounted at<br />
a risk-free interest rate.<br />
Midstream assets are depreciated on a straight-line basis over their estimated lives. The Company reviews the recoverability of the carrying<br />
amount of the midstream assets when events or circumstances indicate that the carrying amount might not be recoverable. If the carrying<br />
amount of the midstream assets exceeds their recoverable amount, an impairment loss equal to the amount by which the carrying amount<br />
of the midstream assets exceeds their fair value is recognized in depreciation.<br />
Head office capital assets are amortized on a declining balance basis over their estimated useful lives.<br />
(F) CAPITALIZED INTEREST<br />
Following the Board of Directors’ approval of Phase 1 of the Horizon Project in 2005, the Company commenced capitalization of construction<br />
period interest based on costs incurred and the Company’s cost of borrowing. Interest capitalization on Phase 1 will cease once construction<br />
is substantially complete and this phase of the Horizon Project is available for its intended use. The Company will continue to capitalize a<br />
portion of interest costs related to subsequent phases of the Horizon Project.<br />
(G) DEFERRED CHARGES<br />
Deferred charges primarily include deferred financing costs associated with the issuance of long-term debt and settlement costs of longterm<br />
natural gas contracts. Deferred charges are amortized over the original term of the related instrument. Refer to policy note (R) for the<br />
effect of new financial instrument policies on deferred charges.<br />
(H) ASSET RETIREMENT OBLIGATIONS<br />
The Company provides for future asset retirement obligations on its resource properties, facilities, production platforms and gathering<br />
systems based on current legislation and industry operating practices. The fair values of asset retirement obligations related to property,<br />
plant and equipment are recognized as a liability in the period in which they are incurred. Retirement costs equal to the fair value of the<br />
asset retirement obligations are capitalized as part of the cost of the associated property, plant and equipment and are amortized to expense<br />
through depletion and depreciation over the lives of the respective assets. The fair value of an asset retirement obligation is estimated by<br />
discounting the expected future cash flows to settle the asset retirement obligation at the Company’s average credit-adjusted risk-free<br />
interest rate. In subsequent periods, the asset retirement obligation is adjusted for the passage of time and for changes in the amount<br />
or timing of the underlying future cash flows. Actual expenditures are charged against the accumulated asset retirement obligation as<br />
incurred.<br />
The Company’s pipelines have an indeterminate life and therefore the fair values of the related asset retirement obligations cannot be<br />
reasonably determined. The asset retirement obligations for these assets will be recorded in the year in which the lives of the assets are<br />
determinable.<br />
(I) FOREIGN CURRENCY TRANSLATION<br />
Foreign operations that are self-sustaining are translated using the current rate method. Under this method, assets and liabilities are<br />
translated to <strong>Canadian</strong> dollars from their functional currency using the exchange rate in effect at the consolidated balance sheet date.<br />
Revenues and expenses are translated to <strong>Canadian</strong> dollars at the monthly average exchange rates. Gains or losses on translation are included<br />
in the foreign currency translation adjustment in shareholders’ equity in the consolidated balance sheets.<br />
Foreign operations that are integrated are translated using the temporal method. For foreign currency balances and integrated subsidiaries,<br />
monetary assets and liabilities are translated to <strong>Canadian</strong> dollars at the exchange rate in effect at the consolidated balance sheet date.<br />
Non-monetary assets and liabilities are translated at the exchange rate in effect when the assets were acquired or obligations incurred.<br />
Revenues and expenses are translated to <strong>Canadian</strong> dollars at the monthly average exchange rates. Provisions for depletion, depreciation and<br />
amortization are translated at the same rate as the related assets.
<strong>Canadian</strong> <strong>Natural</strong> AR2006<br />
Page 80 of 107<br />
Gains or losses on translation of integrated foreign operations are included in the consolidated statement of earnings. Gains or losses on the<br />
translation of foreign currency balances are either recognized in net earnings immediately, or in the foreign currency translation adjustment<br />
(note 10) for translation gains or losses for that portion of the US dollar denominated debt designated as a hedge of the net investment in<br />
self-sustaining foreign operations.<br />
(J) REVENUE RECOGNITION<br />
Revenue from the production of crude oil and natural gas is recognized when title passes to the customer, delivery has taken place and<br />
collection is reasonably assured. The Company assesses customer creditworthiness, both before entering into contracts and throughout the<br />
revenue recognition process.<br />
Revenue as reported represents the Company’s share and is presented before royalty payments to governments and other mineral interest<br />
owners. Revenue, net of royalties represents the Company’s share after royalty payments to governments and other mineral interest<br />
owners.<br />
(K) TRANSPORTATION AND BLENDING<br />
Transportation and blending costs incurred to transport crude oil and natural gas to customers are recorded as a separate cost in the<br />
consolidated statement of earnings.<br />
(L) PRODUCTION SHARING CONTRACTS<br />
Production generated from Offshore West Africa is currently shared under the terms of various Production Sharing Contracts (“PSCs”).<br />
Revenues are divided into cost recovery revenues and profit revenues. Cost recovery revenues allow the Company to recover its share and<br />
the government’s share of capital and operating costs carried by the Company. Profit revenues are allocated to the Company in accordance<br />
with its respective equity interest, after a portion has been allocated to the government. Cost recovery and profit revenues are reported as<br />
sales revenues. The government’s share of revenues attributable to the Company’s equity interest, except for income tax, is reported as a<br />
royalty expense in accordance with the PSCs.<br />
(M) PETROLEUM REVENUE TAX<br />
The Company accounts for the United Kingdom petroleum revenue tax (“PRT”) by the life-of-the-field method. The total future liability or<br />
recovery of PRT is estimated using current reserves and anticipated sales prices and costs. The estimated future PRT is then apportioned to<br />
accounting periods on the basis of total estimated future operating income. Changes in the estimated total future PRT are accounted for<br />
prospectively.<br />
(N) INCOME TAX<br />
The Company follows the liability method of accounting for income taxes. Under this method, future income tax assets and liabilities are<br />
recognized based on the estimated tax effects of temporary differences in the carrying value of assets and liabilities in the consolidated<br />
financial statements and their respective tax bases, using income tax rates substantively enacted as of the consolidated balance sheet date.<br />
The effect of a change in income tax rates on the future income tax assets and liabilities is recognized in net earnings in the period of the<br />
change.<br />
Taxable income from the conventional crude oil and natural gas business in Canada is primarily generated through partnerships, with the<br />
related income taxes payable in a future period. North America current income taxes have been provided on the basis of the corporate<br />
structure and available income tax deductions and will vary depending upon the nature and amount of capital expenditures incurred in<br />
Canada in any particular year.<br />
(O) STOCK-BASED COMPENSATION PLANS<br />
The Company accounts for stock-based compensation using the intrinsic value method as the Company’s Stock Option Plan (the “Option<br />
Plan”) provides current employees with the right to elect to receive common shares or direct cash payment in exchange for options<br />
surrendered. A liability for potential cash settlements under the Option Plan is accrued over the vesting period of the stock options based<br />
on the difference between the exercise price of the stock options and the market price of the Company’s common shares and an estimated<br />
forfeiture rate. This liability is revalued at each reporting date to reflect changes in the market price of the Company’s common shares and<br />
actual forfeitures, with the net change recognized in net earnings, or adjusted to capitalized costs during the construction period in the case<br />
of the Horizon Project. When stock options are surrendered for cash, the cash settlement paid reduces the outstanding liability. When stock<br />
options are exercised for common shares under the Option Plan, consideration paid by employees and any previously recognized liability<br />
associated with the stock options are recorded as share capital.<br />
The Company has an employee stock savings plan and a stock bonus plan. Contributions to the employee stock savings plan are recorded<br />
as compensation expense at the time of the contribution. Contributions to the stock bonus plan are recognized as compensation expense<br />
over the related vesting period.<br />
(P) RISK MANAGEMENT ACTIVITIES<br />
The Company utilizes various derivative financial instruments to manage its commodity price, currency and interest rate exposures. These<br />
derivative financial instruments are not intended for trading or speculative purposes. Changes in fair value of derivative financial instruments<br />
formally designated as hedges are not recognized in net earnings until such time as the corresponding gains or losses on the related hedged
Notes to the Consolidated Financial Statements<br />
Page 81 of 107<br />
items are also recognized. Changes in fair value of derivative financial instruments not formally designated as hedges are recognized in the<br />
balance sheet each period with the offset reflected in risk management activities in the consolidated statements of earnings.<br />
The Company formally documents all derivative financial instruments designated as hedging transactions at the inception of the hedging<br />
relationship, in accordance with the Company’s risk management policies. The effectiveness of the hedging relationship is evaluated, both<br />
at inception of the hedge and on an ongoing basis.<br />
The Company enters into commodity price contracts to manage anticipated sales of crude oil and natural gas production in order to protect<br />
cash flow for capital expenditure programs. All realized and unrealized gains or losses on these contracts are included in risk management<br />
activities, regardless of whether or not these contracts have been formally designated as hedges.<br />
The Company enters into interest rate swap agreements to manage its fixed to floating interest rate mix on long-term debt. The interest rate<br />
swap contracts require the periodic exchange of payments without the exchange of the notional principal amounts on which the payments<br />
are based. Gains or losses on interest rate swap contracts formally designated as hedges are included in interest expense. Gains or losses on<br />
non-designated interest rate contracts are included in risk management activities.<br />
The Company enters into cross-currency swap agreements to manage currency exposure on US dollar denominated long-term debt. The<br />
cross-currency swap contracts require the periodic exchange of payments with the exchange at maturity of notional principal amounts on<br />
which the payments are based. Gains or losses on the foreign exchange component of all cross-currency swap contracts are included in risk<br />
management activities. Gains or losses on the interest component of cross-currency swap contracts designated as hedges are included in<br />
interest expense.<br />
Gains or losses on the termination of derivative financial instruments that have been accounted for as hedges are deferred under other<br />
assets or liabilities on the consolidated balance sheets and amortized into net earnings in the period in which the underlying hedged<br />
transaction is recognized. In the event a designated hedged item is sold, extinguished or matures prior to the termination of the related<br />
derivative instrument, any unrealized derivative gain or loss is recognized immediately in net earnings. Gains or losses on the termination of<br />
financial instruments that have not been accounted for as hedges are recognized in net earnings immediately.<br />
Risk management activities are included in operating activities in the consolidated statements of cash flows.<br />
Refer to policy note (R) for the effect of new accounting standards related to the accounting for risk management activities.<br />
(Q) PER COMMON SHARE AMOUNTS<br />
The Company uses the treasury stock method to determine the dilutive effect of stock options and other dilutive instruments.<br />
This method assumes that proceeds received from the exercise of in-the-money stock options not accounted for as a liability are<br />
used to purchase common shares at the average market price during the year. The Company’s Option Plan described in note<br />
9 results in a liability and expense for all outstanding stock options. As such, the potential common shares associated with the stock<br />
options are not included in diluted earnings per share. The dilutive effect of other convertible securities is calculated by applying<br />
the “if-converted” method, which assumes that the securities are converted at the beginning of the period and that income items are<br />
adjusted to net earnings.<br />
(R) RECENTLY ISSUED ACCOUNTING STANDARDS UNDER CANADIAN GAAP<br />
FINANCIAL INSTRUMENTS<br />
Effective January 1, 2007, the Company will adopt the following new accounting standards issued by the CICA relating to the accounting<br />
for and disclosure of financial instruments:<br />
� � Section 1530 – “Comprehensive Income” introduces the concept of comprehensive income to <strong>Canadian</strong> GAAP. Comprehensive income<br />
is the change in equity (net assets) of the Company during a reporting period from transactions and other events and circumstances<br />
from non-owner sources. It includes all changes in equity during a period except those resulting from investments by owners and<br />
distributions to owners.<br />
Foreign currency translation adjustment, which is currently a separate component of shareholders’ equity, will be recorded as part of<br />
accumulated other comprehensive income.<br />
� � Section 3251 – “Equity” replaces Section 3250 – “Surplus” and establishes standards for the presentation of equity and changes<br />
in equity during a reporting period. Financial statements of prior periods will be restated only for the foreign currency translation<br />
adjustment.<br />
� � Section 3855 – “Financial Instruments – Recognition and Measurement” prescribes when a financial asset, financial liability, or nonfinancial<br />
derivative is to be recognized on the balance sheet as well as its measurement amount. This section also specifies how financial<br />
instruments gains and losses are to be presented.<br />
The Company will include all transaction costs that are directly attributable to the acquisition or issue of a financial asset or financial liability<br />
with the fair value of the financial asset or financial liability. These adjustments were previously recorded in deferred charges. Transaction<br />
costs included with the fair value of the financial asset or financial liability will be amortized using the effective interest method.
<strong>Canadian</strong> <strong>Natural</strong> AR2006<br />
Page 82 of 107<br />
� � Section 3865 – “Hedges” replaces Accounting Guideline 13 – “Hedging Relationships” and EIC 128 – “Accounting for Trading,<br />
Speculative or Non-Hedging Derivative Financial Instruments” and specifies how hedge accounting is to be applied and what disclosures<br />
are necessary when hedge accounting is applied.<br />
Adoption of this standard will require the Company to record all of its derivative financial instruments on the balance sheet at fair<br />
value, including those designated as hedges. Designated hedges are currently not recognized on the balance sheet but are disclosed<br />
in the notes to the financial statements. The adjustment to recognize the designated hedges on the balance sheet will be recorded as<br />
an adjustment to the opening balance of retained earnings or accumulated other comprehensive income, as appropriate.<br />
Subsequently, if the derivative is designated as a fair value hedge, changes in the fair value of the derivative and changes in the fair<br />
value of the hedged item attributable to the hedged risk are recognized in the consolidated statements of earnings each period.<br />
If the derivative is designated as a cash flow hedge, the effective portions of the changes in fair value of the derivative are initially<br />
recorded in comprehensive income each period and are recognized in the consolidated statements of earnings when the hedged item<br />
is recognized. Ineffective portions of changes in the fair value of hedging instruments are recognized in net earnings immediately for<br />
both fair value and cash flow hedges.<br />
Adoption of these standards will have the following estimated effects on the Company’s consolidated balance sheet as at<br />
January 1, 2007:<br />
Decrease future income tax asset $ (62)<br />
Increase current portion of other long-term assets $ 193<br />
Decrease other long-term assets $ (16)<br />
Decrease long-term debt $ (72)<br />
Increase future income tax liability $ 18<br />
Increase retained earnings $ 10<br />
Increase foreign currency translation adjustment $ 13<br />
Increase accumulated other comprehensive income $ 146<br />
(S) COMPARATIVE FIGURES<br />
Certain figures related to the presentation of gross revenues and gross transportation and blending provided for prior years have been<br />
reclassified to conform to the presentation adopted in 2006.<br />
Common share data has been restated to reflect the two-for-one share split in May 2005.<br />
2. BUSINESS COMBINATIONS<br />
ANADARKO CANADA CORPORATION<br />
In November 2006, the Company completed the acquisition of all of the issued and outstanding common shares of Anadarko Canada<br />
Corporation (“ACC”), a subsidiary of Anadarko Petroleum Corporation, for net cash consideration of $4,641 million including working<br />
capital and other adjustments. Substantially all of ACC’s land and production base are located in Western Canada.<br />
The acquisition was accounted for using the purchase method. Operating results from ACC have been consolidated with the results of<br />
the Company effective from November 2, 2006, the date of acquisition, and are reported in the North America segment. The preliminary<br />
allocation of the net purchase price is subject to change as actual amounts are determined. The preliminary allocation of the net purchase<br />
price to assets acquired and liabilities assumed based on their fair values was as follows:<br />
Net purchase price:<br />
Net cash consideration (1) Net purchase price allocated as follows:<br />
$ 4,641<br />
Non-cash working capital deficit assumed and other $ (105)<br />
Property, plant and equipment 6,249<br />
Long-term debt (9)<br />
Asset retirement obligation (56)<br />
Future income tax (1,438)<br />
$ 4,641<br />
(1) Net cash consideration was reduced by $88 million to reflect the settlement of US dollar currency forward contracts designated as hedges of the ACC share<br />
purchase price.
Notes to the Consolidated Financial Statements<br />
Page 83 of 107<br />
3. OTHER LONG-TERM ASSETS<br />
2006 2005<br />
Deferred charges $ 109 $ 107<br />
Risk management (note 12) 128 –<br />
Other 23 –<br />
260 107<br />
Less: current portion 106 –<br />
$ 154 $ 107<br />
4. PROPERTY, PLANT AND EQUIPMENT<br />
2006 2005<br />
Accumulated Accumulated<br />
depletion and depletion and<br />
Cost depreciation Net Cost depreciation Net<br />
Crude oil and natural gas<br />
North America $ 31,715 $ 9,836 $ 21,879 $ 22,258 $ 7,948 $ 14,310<br />
North Sea 3,370 1,341 2,029 2,703 1,022 1,681<br />
Offshore West Africa 1,685 481 1,204 1,547 294 1,253<br />
Other 38 14 24 27 14 13<br />
Horizon Project 5,350 – 5,350 2,169 – 2,169<br />
Midstream 263 56 207 251 48 203<br />
Head office 150 76 74 124 59 65<br />
$ 42,571 $ 11,804 $ 30,767 $ 29,079 $ 9,385 $ 19,694<br />
During the year ended December 31, 2006, the Company capitalized administrative overhead of $41 million (2005 – $41 million,<br />
2004 – $49 million) relating to exploration and development in the North Sea and Offshore West Africa and $456 million<br />
(2005 – $236 million, 2004 – $35 million) relating primarily to the Horizon Project in North America.<br />
During the year ended December 31, 2006, the Company capitalized $196 million (2005 - $72 million, 2004 - $nil) in construction period<br />
interest costs related to the Horizon Project.<br />
Included in property, plant and equipment are unproved land and major development projects that are not currently subject to depletion<br />
or depreciation:<br />
2006 2005<br />
Crude oil and natural gas<br />
North America $ 2,244 $ 1,372<br />
North Sea 24 28<br />
Offshore West Africa 84 182<br />
Other 24 13<br />
Horizon Project 5,350 2,169<br />
$ 7,726 $ 3,764<br />
The Company has used the following estimated benchmark future prices (“escalated pricing”) in its ceiling test prepared in accordance with<br />
<strong>Canadian</strong> GAAP, as at December 31, 2006:<br />
2007 2008 2009 2010 2011<br />
Average<br />
annual<br />
increase<br />
thereafter<br />
Crude oil and NGLs<br />
North America<br />
WTI at Cushing (US$/bbl) $ 65.73 $ 68.82 $ 62.42 $ 58.37 $ 55.20 2.0%<br />
Hardisty Heavy 12˚ API (C$/bbl) $ 42.98 $ 45.02 $ 40.74 $ 38.03 $ 35.90 2.0%<br />
Edmonton Par (C$/bbl)<br />
North Sea and Offshore West Africa<br />
$ 74.10 $ 77.62 $ 70.25 $ 65.56 $ 61.90 2.0%<br />
North Sea Brent (US$/bbl)<br />
<strong>Natural</strong> gas<br />
North America<br />
$ 63.73 $ 66.78 $ 60.34 $ 56.24 $ 53.04 2.0%<br />
Henry Hub Louisiana (US$/mmbtu) $ 7.85 $ 8.39 $ 7.65 $ 7.48 $ 7.63 2.0%<br />
AECO (C$/mmbtu) $ 7.72 $ 8.59 $ 7.74 $ 7.55 $ 7.72 2.0%<br />
Huntingdon/Sumas (C$/mmbtu) $ 7.48 $ 8.45 $ 7.60 $ 7.41 $ 7.58 2.0%
<strong>Canadian</strong> <strong>Natural</strong> AR2006<br />
Page 84 of 107<br />
5. LONG-TERM DEBT<br />
2006 2005<br />
Bank credit facilities<br />
Bankers’ acceptances<br />
Medium-term notes<br />
$ 6,621 $ 122<br />
7.40% unsecured debentures due March 1, 2007 125 125<br />
4.50% unsecured debentures due January 23, 2013 400 –<br />
4.95% unsecured debentures due June 1, 2015<br />
Senior unsecured notes<br />
400 400<br />
Adjustable rate due May 27, 2009 (2006 – US$93 million, 2005 – US$93 million)<br />
US dollar debt securities<br />
108 108<br />
7.80% due July 2, 2008 (2006 – US$8 million, 2005 – US$nil) 9 –<br />
6.70% due July 15, 2011 (2006 – US$400 million, 2005 – US$400 million) 466 467<br />
5.45% due October 1, 2012 (2006 – US$350 million , 2005 – US$350 million) 408 408<br />
4.90% due December 1, 2014 (2006 – US$350 million, 2005 – US$350 million) 408 408<br />
6.00% due August 15, 2016 (2006 – US$250 million, 2005 – US$nil) 291 –<br />
7.20% due January 15, 2032 (2006 – US$400 million, 2005 – US$400 million) 466 467<br />
6.45% due June 30, 2033 (2006 – US$350 million, 2005 – US$350 million) 408 408<br />
5.85% due February 1, 2035 (2006 – US$350 million, 2005 – US$350 million) 408 408<br />
6.50% due February 15, 2037 (2006 – US$450 million, 2005 – US$nil) 525 –<br />
$ 11,043 $ 3,321<br />
BANK CREDIT FACILITIES<br />
As at December 31, 2006, the Company had in place unsecured bank credit facilities of $7,809 million, comprised of:<br />
� � a $100 million demand credit facility;<br />
� � a $500 million demand credit facility;<br />
� � a 3-year non-revolving syndicated credit facility of $3,850 million;<br />
� � a 5-year revolving syndicated credit facility of $1,825 million;<br />
� � a 5-year revolving syndicated credit facility of $1,500 million; and<br />
� � a £15 million demand credit facility related to the Company’s North Sea operations.<br />
The revolving syndicated credit facilities are fully revolving for a period of five years maturing June 2011. Both facilities are extendible<br />
annually for one year periods at the mutual agreement of the Company and the lenders. If the facilities are not extended, the full amount<br />
of the outstanding principal would be repayable on the maturity date.<br />
In conjunction with the closing of the acquisition of ACC (note 2), the Company executed a $3,850 million, three-year non-revolving<br />
syndicated credit facility maturing in October 2009. This facility is subject to certain prepayment requirements up to a maximum of $1,500<br />
million.<br />
During 2006, the Company obtained a $500 million credit facility repayable on demand.<br />
The weighted average interest rate of the bank credit facilities outstanding at December 31, 2006, was 4.8% (2005 – 4.0%).<br />
In addition to the outstanding debt, letters of credit and financial guarantees aggregating $338 million, including $300 million related to<br />
the Horizon Project, were outstanding at December 31, 2006.<br />
MEDIUM-TERM NOTES<br />
In January 2006, the Company issued $400 million of debt securities maturing January 2013, bearing interest at 4.50%. Proceeds from<br />
the securities issued were used to repay bankers’ acceptances under the Company’s bank credit facilities. After issuing these securities, the<br />
Company has $1.6 billion remaining on its $2 billion shelf prospectus filed in August 2005 that allows for the issue of medium-term notes<br />
in Canada until September 2007. If issued, these securities will bear interest as determined at the date of issuance.<br />
In May 2005, the Company issued $400 million of debt securities maturing June 2015, bearing interest at 4.95%. Proceeds from the<br />
securities issued were used to repay bankers’ acceptances under the Company’s bank credit facilities.<br />
Subsequent to December 31, 2006, the 7.40% unsecured debentures due March 1, 2007 were repaid.<br />
SENIOR UNSECURED NOTES<br />
The adjustable rate senior unsecured notes bear interest at 6.54% and have annual principal repayments of US$31 million commencing in<br />
May 2007, through May 2009.<br />
In December 2005, the Company repaid the US$125 million 7.69% senior unsecured notes due December 19, 2005.
Notes to the Consolidated Financial Statements<br />
Page 85 of 107<br />
PREFERRED SECURITIES<br />
In September 2005, the Company redeemed the US$80 million 8.30% preferred securities due May 25, 2011 for cash consideration of<br />
US$91 million, including an early repayment premium of US$11 million as required under the Note Purchase Program.<br />
US DOLLAR DEBT SECURITIES<br />
In August 2006, the Company issued US$250 million of unsecured notes maturing August 2016 and US$450 million of unsecured<br />
notes maturing February 2037, bearing interest at 6.00% and 6.50%, respectively. Concurrently, the Company entered into<br />
cross-currency interest-rate swaps to fix the <strong>Canadian</strong> dollar interest and principal repayment amounts on the US$250 million notes at<br />
5.40% and C$279 million (note 12). Proceeds from the securities issued were used to repay bankers’ acceptances under the Company’s<br />
bank credit facilities.<br />
In November 2006, the US shelf prospectus, filed in June 2005, was increased from US$2,000 million to US$3,000 million, leaving<br />
US$2,300 million available for issue in the United States until July 2007.<br />
Subsequently, on March 12, 2007, the Company priced, for settlement on March 19, 2007, US$2,200 million of unsecured notes under<br />
the US shelf prospectus, comprised of US$1,100 million of unsecured notes maturing May 2017 and US$1,100 million of unsecured notes<br />
maturing March 2038, bearing interest at 5.70% and 6.25%, respectively. Concurrently, the Company entered into cross-currency interestrate<br />
swaps to fix the <strong>Canadian</strong> dollar interest and principal repayment amounts on US$1,100 million of unsecured notes due May 2017<br />
at 5.10% and C$1,287 million. The Company also entered into a cross-currency interest-rate swap to fix the <strong>Canadian</strong> dollar interest and<br />
principal repayment amounts on US$550 million of unsecured notes due March 2038 at 5.76% and C$644 million. Net proceeds on the<br />
debt issue will be used to repay outstanding amounts under the Company’s bank credit facilities.<br />
REQUIRED DEBT REPAYMENTS<br />
Required debt repayments are as follows:<br />
Year Repayment<br />
2007 $ 161<br />
2008 $ 45<br />
2009 $ 3,876<br />
2010 $ –<br />
2011 $ 466<br />
Thereafter $ 3,713<br />
No debt repayments are reflected for $2,782 million of revolving bank credit facilities due to the extendable nature of<br />
the facilities.<br />
6. OTHER LONG-TERM LIABILITIES<br />
2006 2005<br />
Asset retirement obligations $ 1,166 $ 1,112<br />
Stock-based compensation 744 891<br />
Risk management (note 12) – 885<br />
Other 94 17<br />
2,004 2,905<br />
Less: current portion 611 1,471<br />
$ 1,393 $ 1,434<br />
ASSET RETIREMENT OBLIGATIONS<br />
At December 31, 2006, the Company’s total estimated undiscounted costs to settle its asset retirement obligations with respect to crude oil<br />
and natural gas properties and facilities was approximately $4,497 million (2005 – $3,325 million). Payments to settle these asset retirement<br />
obligations will occur on an ongoing basis over a period of approximately 60 years and have been discounted using an average creditadjusted<br />
risk-free interest rate of 6.7%. A reconciliation of the discounted asset retirement obligations is as follows:<br />
2006 2005 2004<br />
Asset retirement obligations<br />
Balance – beginning of year $ 1,112 $ 1,119 $ 897<br />
Liabilities incurred 26 47 53<br />
Liabilities acquired (note 2) 56 – 286<br />
Liabilities settled (75) (46) (32)<br />
Asset retirement obligation accretion 68 69 51<br />
Revision of estimates (21) (56) (86)<br />
Foreign exchange – (21) (50)<br />
Balance – end of year $ 1,166 $ 1,112 $ 1,119
<strong>Canadian</strong> <strong>Natural</strong> AR2006<br />
Page 86 of 107<br />
STOCK-BASED COMPENSATION<br />
The Company recognizes a liability for the potential cash settlements under its Option Plan. The current portion represents the maximum<br />
amount of the liability payable within the next twelve month period if all vested options are surrendered for cash settlement.<br />
2006 2005 2004<br />
Stock-based compensation<br />
Balance – beginning of year $ 891 $ 323 $ 171<br />
Stock-based compensation 139 723 249<br />
Cash payment for options surrendered (264) (227) (80)<br />
Transferred to common shares (101) (29) (38)<br />
Capitalized to Horizon Project 79 101 21<br />
Balance – end of year 744 891 323<br />
Less: current portion of stock-based compensation 611 629 243<br />
$ 133 $ 262 $ 80<br />
7. EMPLOYEE FUTURE BENEFITS<br />
In connection with the acquisition of ACC, the Company assumed obligations to provide defined contribution pension benefits to certain<br />
ACC employees continuing their employment with the Company, and defined benefit pension and other post-retirement benefits to former<br />
ACC employees, under registered and unregistered pension plans.<br />
The estimated future cost of providing defined benefit pension and other post-retirement benefits to former ACC employees is actuarially<br />
determined using management’s best estimates of demographic and financial assumptions. The discount rate of 5% used to determine<br />
accrued benefit obligations is based on a year end market rate of interest for high-quality debt instruments with cash flows that match the<br />
timing and amount of expected benefit payments. Company contributions to the defined contribution plan are expensed as incurred.<br />
The benefit obligation under the registered pension plan at December 31, 2006 was $29 million. As required by government<br />
regulations, the Company has set aside funds with an independent trustee to meet these benefit obligations. As at December 31, 2006,<br />
these plan assets had a fair value of $54 million. The unregistered pension plans are unfunded and have a benefit obligation of<br />
$15 million at December 31, 2006.<br />
8. TAXES<br />
TAXES OTHER THAN INCOME TAX<br />
2006 2005 2004<br />
Current petroleum revenue tax $ 196 $ 181 $ 190<br />
Deferred petroleum revenue tax 37 (9) (45)<br />
Provincial capital taxes and surcharges 23 22 20<br />
$ 256 $ 194 $ 165<br />
INCOME TAX<br />
The provision for income tax is as follows:<br />
2006 2005 2004<br />
Current income tax<br />
Current income tax – North America $ 143 $ 99 $ 101<br />
Current income tax – North Sea 30 155 2<br />
Current income tax – Offshore West Africa 49 32 13<br />
222 286 116<br />
Future income tax 652 353 474<br />
Income tax $ 874 $ 639 $ 590
Notes to the Consolidated Financial Statements<br />
Page 87 of 107<br />
The provision for income tax is different from the amount computed by applying the combined statutory <strong>Canadian</strong> federal and provincial<br />
income tax rates to earnings before taxes. The reasons for the difference are as follows:<br />
2006 2005 2004<br />
<strong>Canadian</strong> statutory income tax rate 34.9% 38.0% 39.3%<br />
Income tax provision at statutory rate<br />
Effect on income taxes of:<br />
$ 1,275 $ 716 $ 849<br />
Non-deductible portion of <strong>Canadian</strong> crown payments 131 309 221<br />
<strong>Canadian</strong> resource allowance (129) (293) (270)<br />
Large Corporations Tax (16) 16 11<br />
Deductible UK petroleum revenue tax (82) (65) (57)<br />
Foreign tax rate differentials 92 (1) (31)<br />
North America income tax rate changes (438) (19) (66)<br />
UK income tax rate changes 110 – –<br />
Côte d’Ivoire income tax rate changes (67) – –<br />
Non-taxable portion of foreign exchange 5 (15) (36)<br />
Attributed <strong>Canadian</strong> Royalty Income (27) (21) (4)<br />
Other 20 12 (27)<br />
Income tax $ 874 $ 639 $ 590<br />
The following table summarizes the temporary differences that give rise to the net future income tax asset and liability:<br />
2006 2005<br />
Future income tax liabilities<br />
Property, plant and equipment $ 6,088 $ 3,960<br />
Timing of partnership items 1,394 1,646<br />
Unrealized foreign exchange gain on long-term debt 93 112<br />
Risk management activities 40 –<br />
Other<br />
Future income tax assets<br />
13 31<br />
Asset retirement obligations (487) (384)<br />
Capital loss carryforwards (85) (79)<br />
Attributed <strong>Canadian</strong> Royalty Income – (75)<br />
Stock-based compensation (232) (300)<br />
Risk management activities – (304)<br />
Deferred petroleum revenue tax (24) (59)<br />
Net future income tax liability 6,800 4,548<br />
Less: current portion future income tax asset (163) (487)<br />
Future income tax liability $ 6,963 $ 5,035<br />
During 2006, income tax rate changes resulted in a reduction of future income tax liabilities of approximately $438 million in North America,<br />
an increase of future income tax liabilities of approximately $110 million in the UK North Sea and a reduction of future income tax liabilities<br />
of approximately $67 million in Côte d’Ivoire.<br />
During 2005, North America income tax rate changes resulted in a reduction of future income tax liabilities of approximately<br />
$19 million.<br />
During 2004, North America income tax rate changes resulted in a reduction of future income tax liabilities of approximately<br />
$66 million.<br />
During 2003, the <strong>Canadian</strong> Federal Government enacted legislation to change the taxation of resource income. The legislation reduces the<br />
corporate income tax rate on resource income from 28% to 21% over five years beginning January 1, 2003. Over the same period, the<br />
deduction for resource allowance is being phased out and a deduction for actual crown royalties paid is being phased in.
<strong>Canadian</strong> <strong>Natural</strong> AR2006<br />
Page 88 of 107<br />
9. SHARE CAPITAL<br />
AUTHORIZED<br />
200,000 Class 1 preferred shares with a stated value of $10.00 each.<br />
Unlimited number of common shares without par value.<br />
ISSUED<br />
2006 2005<br />
Number of Number of<br />
shares shares<br />
Common shares (thousands) Amount (thousands) Amount<br />
Balance – beginning of year 536,348 $ 2,442 536,361 $ 2,408<br />
Issued upon exercise of stock options<br />
Previously recognized liability on stock options<br />
2,040 21 837 9<br />
exercised for common shares – 101 – 29<br />
Purchase of common shares under Normal Course Issuer Bid (485) (2) (850) (4)<br />
Balance – end of year 537,903 $ 2,562 536,348 $ 2,442<br />
NORMAL COURSE ISSUER BID<br />
During 2006, the Company purchased 485,000 common shares for cancellation (2005 – 850,000 common shares, 2004 – 1,746,800<br />
common shares) at an average price of $57.33 per common share (2005 – $53.29 per common share, 2004 - $19.00 per common<br />
share), for a total cost of $28 million (2005 – $45 million, 2004 - $33 million). Retained earnings was reduced by $26 million<br />
(2005 – $41 million, 2004 - $26 million), representing the excess of the purchase price of the common shares over their average carrying<br />
value.<br />
In January 2007, the Company renewed its Normal Course Issuer Bid to purchase, through the facilities of the Toronto Stock<br />
Exchange and the New York Stock Exchange, during the 12-month period beginning January 24, 2007 and ending January 23, 2008,<br />
up to 26,941,730 common shares or 5% of the outstanding common shares of the Company then outstanding on the date of the<br />
announcement. As at March 15, 2007, the Company had not purchased any additional shares under the Normal Course Issuer Bid.<br />
DIVIDEND POLICY<br />
The Company has paid regular quarterly dividends in January, April, July and October of each year since 2001. The dividend policy undergoes<br />
a periodic review by the Board of Directors and is subject to change.<br />
In March 2007, the Board of Directors set the Company’s regular quarterly dividend at $0.085 per common share (2006 – $0.075 per<br />
common share, 2005 – $0.059 per common share).<br />
SHARE SPLIT<br />
The Company’s shareholders approved a subdivision or share split of its issued and outstanding common shares on a two-for-one basis at<br />
the Company’s Annual and Special Meeting held on May 5, 2005. All common share and per common share amounts were restated to<br />
retroactively reflect the share split.<br />
STOCK OPTIONS<br />
The Company’s Option Plan provides for granting of stock options to employees. Stock options granted under the Option Plan have terms<br />
ranging from five to six years to expiry and vest equally over a five-year period. The exercise price of each stock option granted is determined<br />
at the closing market price of the common shares on the Toronto Stock Exchange on the day prior to the grant. Each stock option granted<br />
provides the holder the choice to purchase one common share of the Company at the stated exercise price or receive a cash payment equal<br />
to the difference between the stated exercise price and the market price of the Company’s common shares on the date of surrender.<br />
The following table summarizes information relating to stock options outstanding at December 31, 2006 and 2005:<br />
2006 2005<br />
Weighted Weighted<br />
Stock average Stock average<br />
options exercise options exercise<br />
(thousands) price (thousands) price<br />
Outstanding – beginning of year 30,510 $ 17.79 32,522 $ 12.37<br />
Granted 13,084 $ 59.61 7,959 $ 32.51<br />
Exercised for common shares (2,040) $ 10.67 (837) $ 9.81<br />
Surrendered for cash settlement (5,180) $ 12.60 (7,523) $ 10.49<br />
Forfeited (1,949) $ 37.51 (1,611) $ 19.36<br />
Outstanding – end of year 34,425 $ 33.77 30,510 $ 17.79<br />
Exercisable – end of year 9,177 $ 14.73 8,677 $ 11.21
Notes to the Consolidated Financial Statements<br />
Page 89 of 107<br />
The range of exercise prices of stock options outstanding and exercisable at December 31, 2006 is as follows:<br />
Stock options Stock options<br />
outstanding<br />
Weighted<br />
exercisable<br />
Stock average Weighted Stock Weighted<br />
options remaining average options average<br />
outstanding term exercise exercisable exercise<br />
Range of exercise prices (thousands) (years) price (thousands) price<br />
$9.63 – $9.99 4,672 0.76 $ 9.71 3,603 $ 9.74<br />
$10.00 – $19.99 9,807 2.20 $ 14.68 4,202 $ 13.78<br />
$20.00 – $29.99 5,099 3.34 $ 25.41 957 $ 25.00<br />
$30.00 – $39.99 1,227 3.79 $ 33.23 175 $ 33.24<br />
$40.00 – $49.99 686 5.02 $ 46.50 69 $ 43.84<br />
$50.00 – $59.99 7,033 4.81 $ 57.85 166 $ 55.14<br />
$60.00 – $69.14 5,901 4.27 $ 61.70 5 $ 61.60<br />
34,425 3.17 $ 33.77 9,177 $ 14.73<br />
10. FOREIGN CURRENCY TRANSLATION ADJUSTMENT<br />
The foreign currency translation adjustment represents the unrealized loss on the Company’s net investment in self-sustaining foreign<br />
operations. Commencing July 1, 2002, the Company designated certain US dollar denominated debt as a hedge against its net investment<br />
in US dollar-based self-sustaining foreign operations. Accordingly, translation gains and losses on this US dollar denominated debt are<br />
included in the foreign currency translation adjustment.<br />
2006 2005<br />
Balance – beginning of year $ (9) $ (6)<br />
Unrealized loss on translation of net investment (4) (12)<br />
Hedge of net investment with US dollar denominated debt, net of tax – 9<br />
Balance – end of year $ (13) $ (9)<br />
11. NET EARNINGS PER COMMON SHARE<br />
The following table provides a reconciliation between basic and diluted amounts per common share:<br />
(thousands of shares) 2006 2005 2004 (1)<br />
Weighted average common shares outstanding – basic 537,339 536,650 536,223<br />
Assumed settlement of preferred securities with common shares (2) – 1,775 4,461<br />
Weighted average common shares outstanding – diluted 537,339 538,425 540,684<br />
Net earnings $ 2,524 $ 1,050 $ 1,405<br />
Interest on preferred securities, net of tax (2) – 4 5<br />
Revaluation of preferred securities, net of tax (2) – (2) (4)<br />
Diluted net earnings<br />
Net earnings per common share<br />
$ 2,524 $ 1,052 $ 1,406<br />
Basic $ 4.70 $ 1.96 $ 2.62<br />
Diluted $ 4.70 $ 1.95 $ 2.60<br />
(1) Restated to reflect two-for-one share split in May 2005.<br />
(2) The preferred securities were redeemed in September 2005.
<strong>Canadian</strong> <strong>Natural</strong> AR2006<br />
Page 90 of 107<br />
12. FINANCIAL INSTRUMENTS<br />
RISK MANAGEMENT<br />
On January 1, 2004, the fair values of all outstanding derivative financial instruments that were not designated as hedges for accounting<br />
purposes were recorded on the consolidated balance sheet, with an offsetting net deferred revenue amount. Subsequent net changes in<br />
the fair value of non-designated financial instruments have been recognized on the consolidated balance sheet and in net earnings. The<br />
estimated fair value for all derivative financial instruments is based on third party indications.<br />
As at December 31, 2006 and 2005, the estimated fair values of non-designated financial derivatives were comprised as follows:<br />
2006 2005<br />
Risk Risk<br />
management management<br />
mark-to- Deferred mark-to- Deferred<br />
Asset (liability) market revenue market revenue<br />
Balance – beginning of year $ (877) $ (8) $ 66 $ (26)<br />
Net cost of outstanding put options<br />
Net change in fair value of outstanding<br />
455 – 190 –<br />
derivative financial instruments 1,005 – (943) –<br />
Amortization of deferred revenue – 8 – 18<br />
583 – (687) (8)<br />
Add: put premium financing obligations (1) (455) – (190) –<br />
Balance – end of year 128 – (877) (8)<br />
Less: current portion 88 – (834) (8)<br />
$ 40 $ – $ (43) $ –<br />
(1) The Company has negotiated payment of put option premiums with various counter-parties at the time of actual settlement of the respective options. These<br />
obligations have been reflected in the net risk management asset (liability).<br />
Net losses (gains) from risk management activities for the years ended December 31 were as follows:<br />
2006 2005 2004<br />
Net realized risk management loss $ 1,325 $ 1,027 $ 474<br />
Net unrealized risk management (gain) loss (1,013) 925 (40)<br />
$ 312 $ 1,952 $ 434<br />
As at December 31, 2006, the net unrecognized asset related to the estimated fair values of derivative financial instruments designated as<br />
hedges was $222 million (December 31, 2005 – net unrecognized liability of $990 million).<br />
FINANCIAL CONTRACTS<br />
The Company’s financial instruments recognized in the consolidated balance sheets consist of cash and cash equivalents, accounts receivable,<br />
accounts payable, accrued liabilities, risk management activities, stock-based compensation, and long-term debt.<br />
The estimated fair values of financial instruments have been determined based on the Company’s assessment of available market information,<br />
appropriate valuation methodologies and third party indications. However, these estimates may not necessarily be indicative of the amounts<br />
that could be realized or settled in a current market transaction and the differences may be material.<br />
The carrying value of cash and cash equivalents, accounts receivable, accounts payable, accrued liabilities, stock-based compensation, and<br />
long-term debt with variable interest rates approximate their fair value.<br />
The estimated fair values of other financial instruments were as follows:<br />
2006 2005<br />
Asset (liability) Carrying value Fair value Carrying value Fair value<br />
Derivative financial instruments $ 583 $ 805 $ (687) $ (1,700)<br />
Fixed rate notes $ (4,410) $ (4,434) $ (3,199) $ (3,367)
Notes to the Consolidated Financial Statements<br />
Page 91 of 107<br />
COMMODITY PRICE RISK MANAGEMENT<br />
The Company uses certain derivative financial instruments to manage its commodity price exposures. These financial instruments are entered<br />
into solely for hedging purposes and are not intended for trading or other speculative purposes. The following summarizes instruments<br />
outstanding as at December 31, 2006:<br />
Remaining term Volume Average price Index<br />
Crude oil<br />
Crude oil price collars Jan 2007 – Dec 2007 15,000 bbl/d US$50.00 – US$66.25 Mayan Heavy<br />
Jan 2007 – Dec 2007 50,000 bbl/d US$60.00 – US$71.49 WTI<br />
Jan 2007 – Dec 2007 100,000 bbl/d US$60.00 – US$78.11 WTI<br />
Jan 2007 – Dec 2007 50,000 bbl/d US$65.00 – US$84.52 WTI<br />
Jan 2008 – Dec 2008 50,000 bbl/d US$60.00 – US$76.05 WTI<br />
Jan 2008 – Dec 2008 50,000 bbl/d US$60.00 – US$76.98 WTI<br />
Crude oil puts (1) Jan 2007 – Dec 2007 100,000 bbl/d US$45.00 WTI<br />
Jan 2007 – Dec 2007 100,000 bbl/d US$60.00 WTI<br />
Jan 2008 – Dec 2008 50,000 bbl/d US$55.00 WTI<br />
Brent differential swaps Jan 2007 – Dec 2007 50,000 bbl/d US$1.34 WTI/Dated Brent<br />
The cost of outstanding put options and their respective years of settlement are as follows:<br />
2007 2008<br />
Cost (1) ($ millions) US$ 331 US$ 59<br />
(1) Subsequent to December 31, 2006, the Company unwound 23,000 bbl/d of US$60.00 WTI put options for the period February 2007 to December 2007, for cash<br />
consideration of US$40 million.<br />
Remaining term Volume Average price Index<br />
<strong>Natural</strong> gas<br />
AECO collars Jan 2007 – Mar 2007 100,000 GJ/d C$7.00 – C$11.63 AECO<br />
Jan 2007 – Mar 2007 200,000 GJ/d C$7.25 – C$8.38 AECO<br />
Jan 2007 – Mar 2007 162,500 GJ/d C$7.25 – C$9.48 AECO<br />
Jan 2007 – Mar 2007 162,500 GJ/d C$7.50 – C$8.94 AECO<br />
Jan 2007 – Mar 2007 300,000 GJ/d C$7.50 – C$18.77 AECO<br />
Jan 2007 – Mar 2007 400,000 GJ/d C$8.50 – C$11.22 AECO<br />
Jan 2007 – Dec 2007 60,000 GJ/d C$8.00 – C$8.79 AECO<br />
Apr 2007 – Oct 2007 500,000 GJ/d C$6.00 – C$10.13 AECO<br />
Apr 2007 – Oct 2007 500,000 GJ/d C$7.00 – C$8.24 AECO<br />
Nov 2007 – Mar 2008 400,000 GJ/d C$7.00 – C$14.08 AECO<br />
Nov 2007 – Mar 2008 500,000 GJ/d C$7.50 – C$10.81 AECO<br />
Commodity related derivative financial instruments designated as hedges at December 31, 2006, were all classified as cash<br />
flow hedges.<br />
The Company’s outstanding derivatives will be settled monthly based on the applicable index pricing for the respective contract month.<br />
In addition to the financial derivatives noted above, the Company also entered into natural gas physical sales contracts for<br />
325,000 GJ/d at an average fixed price of C$9.17 per GJ at AECO for the period January to March 2007 and 300,000 GJ/d at an average<br />
fixed price of C$7.33 per GJ at AECO for the period April 2007 to October 2007.<br />
As at December 31, 2006, the net unrealized loss related to the de-designation of commodity cash flow hedges was $41 million. This<br />
unrealized loss will be recognized in earnings in 2007.<br />
INTEREST RATE RISK MANAGEMENT<br />
The Company is exposed to interest rate price risk on its fixed rate long-term debt and to interest rate cash flow-risk on its floating rate longterm<br />
debt. The Company enters into interest rate swap agreements to manage its fixed to floating interest rate mix on long-term debt. The<br />
interest rate swap contracts require the periodic exchange of payments without the exchange of the notional principal amounts on which<br />
the payments are based. At December 31, 2006, the Company had the following interest rate swap contracts outstanding:<br />
Remaining term<br />
Amount<br />
($ millions) Fixed rate Floating rate<br />
Interest rate<br />
Swaps – fixed to floating Jan 2007 – Oct 2012 US$350 5.45% LIBOR (1) + 0.81%<br />
Jan 2007 – Dec 2014 US$350 4.90% LIBOR (1) + 0.38%<br />
Swaps – floating to fixed Jan 2007 – Mar 2007 C$2 7.36% CDOR (2)<br />
(1) London Interbank Offered Rate<br />
(2) <strong>Canadian</strong> Deposit Overnight Rate
<strong>Canadian</strong> <strong>Natural</strong> AR2006<br />
Page 92 of 107<br />
Interest rate related derivative financial instruments designated as hedges at December 31, 2006, were all classified as fair<br />
value hedges.<br />
FOREIGN CURRENCY EXCHANGE RATE RISK MANAGEMENT<br />
The Company is exposed to foreign exchange rate risk in Canada on its US dollar denominated debt and on product sales based on US<br />
dollar denominated benchmarks. The Company is also exposed to foreign exchange rate risk on transactions conducted in foreign currencies<br />
in its foreign subsidiaries and in the carrying value of its self-sustaining foreign subsidiaries. The Company enters into cross-currency swap<br />
agreements to manage currency exposure on US dollar denominated long-term debt. The cross-currency swap contracts require the periodic<br />
exchange of payments with the exchange at maturity of notional principal amounts on which the payments are based. The Company may<br />
also enter into foreign currency denominated financial contracts to manage future US dollar denominated crude oil and natural gas sales.<br />
The Company has designated certain US dollar denominated debt as a hedge against its net investment in US dollar-based self-sustaining<br />
foreign operations (note 10). At December 31, 2006, the Company had the following cross-currency swap contracts outstanding:<br />
Amount Exchange Interest Interest<br />
Remaining term ($ millions) rate (US$/C$) rate (US$) rate (C$)<br />
Currency<br />
Swaps Jan 2007 – Aug 2016 US$250 1.116 6.00% 5.40%<br />
Cross-currency related derivative financial instruments designated as hedges at December 31, 2006, were all classified as cash<br />
flow hedges.<br />
COUNTERPARTY CREDIT RISK MANAGEMENT<br />
Accounts receivable are mainly with customers in the crude oil and natural gas industry and are subject to normal industry credit risks. The<br />
Company manages this risk by only entering into sales contracts with highly rated entities. In addition, the Company reviews its exposure to<br />
individual companies on a regular basis and where appropriate, ensures that parental guarantees or letters of credit are in place to minimize<br />
the impact in the event of default.<br />
The Company is also exposed to possible losses in the event of nonperformance by counterparties to derivative financial instruments;<br />
however, the Company manages this credit risk by only entering into agreements with highly rated financial institutions and other entities.<br />
At December 31, 2006, the Company had net risk management assets of $161 million with specific counterparties related to derivative<br />
financial instruments.<br />
13. COMMITMENTS AND CONTINGENCIES<br />
The Company has committed to certain payments as follows:<br />
2007 2008 2009 2010 2011 Thereafter<br />
Product transportation and pipeline (1) $ 213 $ 193 $ 134 $ 123 $ 99 $ 1,042<br />
Offshore equipment operating leases (2) $ 77 $ 52 $ 52 $ 52 $ 50 $ 131<br />
Offshore drilling $ 73 $ 83 $ 12 $ 12 $ 4 $ 4<br />
Asset retirement obligations (3) $ 3 $ 3 $ 3 $ 4 $ 4 $ 4,480<br />
Office leases $ 26 $ 32 $ 33 $ 34 $ 22 $ –<br />
Electricity and other $ 51 $ 10 $ 17 $ 18 $ 1 $ –<br />
(1) The Company has entered into a 25 year pipeline transportation agreement commencing in 2008, related to future crude oil production. The agreement is<br />
renewable for successive 10-year periods at the Company’s option. During the initial term, the annual toll payments before operating costs will be approximately<br />
$35 million.<br />
(2) Offshore equipment operating leases are primarily comprised of obligations related to floating production, storage and offtake vessels (“FPSO”). During 2006, the<br />
Company entered into an agreement to lease an additional FPSO commencing in 2008, in connection with the planned offshore development in Gabon, Offshore<br />
West Africa. The new FPSO lease agreement contains cancellation provisions at the option of the Company, subject to escalating termination payments throughout<br />
2007 to a maximum of US$395 million.<br />
(3) Amounts represent management’s estimate of the future undiscounted payments to settle asset retirement obligations related to resource properties, facilities, and<br />
production platforms, based on current legislation and industry operating practices. Amounts disclosed for the period 2007 – 2011 represent the minimum required<br />
expenditures to meet these obligations. Actual expenditures in any particular year may exceed these minimum amounts.<br />
In 2005, the Board of Directors approved the construction costs for Phase 1 of the Horizon Project, with an approved budget of<br />
$6.8 billion. Cumulative construction spending to December 31, 2006 was approximately $4.0 billion. Final construction costs for Phase 1<br />
may differ from the approved budget due to changes in the final scope and timing of completion of the project, and/or inflationary cost<br />
pressures.<br />
The Company is defendant and plaintiff in a number of legal actions that arise in the normal course of business. The Company<br />
believes that any liabilities that might arise pertaining to such matters would not have a material effect on its consolidated<br />
financial position.
Notes to the Consolidated Financial Statements<br />
Page 93 of 107<br />
14. SUPPLEMENTAL DISCLOSURE OF CASH FLOW INFORMATION<br />
Changes in non-cash working capital were as follows:<br />
2006 2005 2004<br />
(Increase) decrease in non-cash working capital<br />
Accounts receivable and other $ (116) $ (498) $ (329)<br />
Accounts payable 157 196 39<br />
Accrued liabilities (582) 716 194<br />
Net change in non-cash working capital<br />
Relating to:<br />
$ (541) $ 414 $ (96)<br />
Operating activities $ (679) $ (147) $ (14)<br />
Financing activities 37 19 6<br />
Investing activities 101 542 (88)<br />
$ (541) $ 414 $ (96)<br />
Other cash flow information: 2006 2005 2004<br />
Interest paid $ 262 $ 200 $ 192<br />
Taxes paid $ 703 $ 430 $ 218<br />
15. SEGMENTED INFORMATION<br />
The Company’s crude oil and natural gas activities are conducted in three geographic segments: North America, North Sea and Offshore<br />
West Africa. These activities relate to the exploration, development, production and marketing of crude oil, natural gas liquids and natural<br />
gas.<br />
The Company’s Horizon Project has been classified as a separate segment. As the bitumen will be recovered through mining operations, this<br />
project constitutes a distinct segment from crude oil and natural gas activities. There are currently no revenues for this project and all directly<br />
related expenditures have been capitalized.<br />
Midstream activities include the Company’s pipeline operations and an electricity co-generation system.<br />
Activities that are not included in the above segments are included in the segmented information as other.<br />
Inter-segment eliminations include internal transportation and electricity charges.
<strong>Canadian</strong> <strong>Natural</strong> AR2006<br />
Page 94 of 107<br />
North America<br />
Crude Oil and <strong>Natural</strong> Gas<br />
North Sea Offshore West Africa<br />
2006 2005 2004 2006 2005 2004 2006 2005 2004<br />
Segmented revenue $ 9,066 $ 8,955 $ 6,701 $ 1,616 $ 1,659 $ 1,317 $ 950 $ 485 $ 222<br />
Less: royalties<br />
Revenue,<br />
(1,203) (1,350) (1,003) (3) (3) (2) (39) (13) (6)<br />
net of royalties<br />
Segmented expenses<br />
7,863 7,605 5,698 1,613 1,656 1,315 911 472 216<br />
Production<br />
Transportation<br />
1,436 1,211 976 390 379 370 106 53 36<br />
and blending 1,465 1,310 978 15 20 32 1 – –<br />
Depletion, depreciation<br />
and amortization<br />
Asset retirement<br />
1,897 1,595 1,444 297 306 265 189 104 53<br />
obligation accretion<br />
Realized risk<br />
35 34 28 31 34 22 2 1 1<br />
management activities<br />
Total segmented<br />
1,022 870 362 303 157 112 – – –<br />
expenses<br />
Segmented earnings<br />
5,855 5,020 3,788 1,036 896 801 298 158 90<br />
before the following $ 2,008 $ 2,585 $ 1,910 $ 577 $ 760 $ 514 $ 613 $ 314 $ 126<br />
Non-segmented expenses<br />
Administration<br />
Stock-based compensation<br />
Interest, net<br />
Unrealized risk management activities<br />
Foreign exchange loss (gain)<br />
Total non-segmented expenses<br />
Earnings before taxes<br />
Taxes other than income tax<br />
Current income tax<br />
Future income tax<br />
Net earnings
Notes to the Consolidated Financial Statements<br />
Page 95 of 107<br />
Midstream Inter-segment elimination and other Total<br />
2006 2005 2004 2006 2005 2004 2006 2005 2004<br />
$ 72 $ 77 $ 68 $ (61) $ (46) $ (39) $ 11,643 $ 11,130 $ 8,269<br />
– – – – – – (1,245) (1,366) (1,011)<br />
72 77 68 (61) (46) (39) 10,398 9,764 7,258<br />
23 24 20 (6) (4) (2) 1,949 1,663 1,400<br />
– – – (38) (37) (38) 1,443 1,293 972<br />
8 8 7 – – – 2,391 2,013 1,769<br />
– – – – – – 68 69 51<br />
– – – – – – 1,325 1,027 474<br />
31 32 27 (44) (41) (40) 7,176 6,065 4,666<br />
$ 41 $ 45 $ 41 $ (17) $ (5) $ 1 3,222 3,699 2,592<br />
CAPITAL EXPENDITURES<br />
2006 2005<br />
Non-cash Non-cash<br />
and and<br />
Cash fair value Capitalized Cash fair value Capitalized<br />
expenditures adjustments (1) costs expenditures adjustments (1) costs<br />
Crude oil and natural gas<br />
North America $ 7,936 $ 1,521 $ 9,457 $ 2,530 $ (22) $ 2,508<br />
North Sea 646 (14) 632 387 (136) 251<br />
Offshore West Africa 134 1 135 439 27 466<br />
Other 11 – 11 5 – 5<br />
8,727 1,508 10,235 3,361 (131) 3,230<br />
Horizon Project (2) 3,185 – 3,185 1,499 – 1,499<br />
Midstream 12 – 12 4 – 4<br />
Head office 26 – 26 22 – 22<br />
$ 11,950 $ 1,508 $ 13,458 $ 4,886 $ (131) $ 4,755<br />
(1) Asset retirement obligations, future income tax adjustments on non-tax base assets, and other fair value adjustments.<br />
(2) Cash expenditures for the Horizon Project also include capitalized interest and stock-based compensation.<br />
180 151 125<br />
139 723 249<br />
140 149 189<br />
(1,013) 925 (40)<br />
122 (132) (91)<br />
(432) 1,816 432<br />
3,654 1,883 2,160<br />
256 194 165<br />
222 286 116<br />
652 353 474<br />
$ 2,524 $ 1,050 $ 1,405
<strong>Canadian</strong> <strong>Natural</strong> AR2006<br />
Page 96 of 107<br />
Segmented property, plant and equipment, net<br />
Crude oil and natural gas<br />
2006 2005<br />
North America $ 21,879 $ 14,310<br />
North Sea 2,029 1,681<br />
Offshore West Africa 1,204 1,253<br />
Other 24 13<br />
Horizon Project 5,350 2,169<br />
Midstream 207 203<br />
Head office 74 65<br />
$ 30,767 $ 19,694<br />
Segmented assets<br />
Crude oil and natural gas<br />
2006 2005<br />
North America $ 23,670 $ 15,939<br />
North Sea 2,248 1,950<br />
Offshore West Africa 1,323 1,371<br />
Other 46 30<br />
Horizon Project 5,444 2,239<br />
Midstream 355 258<br />
Head office 74 65<br />
$ 33,160 $ 21,852<br />
16. DIFFERENCES BETWEEN CANADIAN AND UNITED STATES GENERALLY ACCEPTED<br />
ACCOUNTING PRINCIPLES<br />
The Company’s consolidated financial statements have been prepared in accordance with <strong>Canadian</strong> GAAP. These principles conform in all<br />
material respects with US GAAP except for those noted below. Certain differences arising from US GAAP disclosure requirements are not<br />
addressed.<br />
The application of US GAAP would have the following effects on consolidated net earnings as reported:<br />
(millions of <strong>Canadian</strong> dollars, except per common share amounts) Notes 2006 2005 2004<br />
Net earnings – <strong>Canadian</strong> GAAP<br />
Adjustments<br />
Depletion, net of tax of $1 million<br />
$ 2,524 $ 1,050 $ 1,405<br />
(2005 - $3 million, 2004 - $2 million)<br />
Stock-based compensation, net of tax<br />
(A,C) 2 4 4<br />
of $18 million (2005 - $nil, 2004 - $nil)<br />
Derivative financial instruments and hedging activities,<br />
(B) (40) – –<br />
net of tax of $15 million (2005 - $11 million, 2004 - $7 million) (C) 117 (19) (9)<br />
Capitalized interest, net of tax of $nil (2005 - $nil, 2004 - $11 million)<br />
Net earnings before cumulative effect of<br />
(D) – – 16<br />
change in accounting policy – US GAAP<br />
Cumulative effect of change in accounting policy,<br />
2,603 1,035 1,416<br />
net of tax of $3 million (2005 - $nil, 2004 - $nil) (B) (8) – –<br />
Net earnings – US GAAP<br />
Net earnings before cumulative effect of change in accounting<br />
policy – US GAAP per common share<br />
$ 2,595 $ 1,035 $ 1,416<br />
Basic $ 4.84 $ 1.93 $ 2.64<br />
Diluted<br />
Net earnings – US GAAP per common share<br />
(F) $ 4.77 $ 1.88 $ 2.57<br />
Basic $ 4.83 $ 1.93 $ 2.64<br />
Diluted (F) $ 4.75 $ 1.88 $ 2.57<br />
Comprehensive income under US GAAP would be as follows:<br />
(millions of <strong>Canadian</strong> dollars) Notes 2006 2005 2004<br />
Net earnings – US GAAP<br />
Derivative financial instruments and hedging activities,<br />
$ 2,595 $ 1,035 $ 1,416<br />
net of tax of $394 million (2005 - $312 million; 2004 - $3 million)<br />
Foreign currency translation adjustment,<br />
(C) 805 (635) 8<br />
net of tax of $nil (2005 - $2 million, 2004 - $4 million) (E) (4) (3) (9)<br />
Comprehensive income $ 3,396 $ 397 $ 1,415
Notes to the Consolidated Financial Statements<br />
Page 97 of 107<br />
The application of US GAAP would have the following effects on the consolidated balance sheets as reported:<br />
2006<br />
<strong>Canadian</strong> Increase<br />
(millions of <strong>Canadian</strong> dollars) Notes GAAP (Decrease) US GAAP<br />
Current assets (C) $ 2,239 $ 131 $ 2,370<br />
Property, plant and equipment (A,B,C,D) 30,767 89 30,856<br />
Other long-term assets (C) 154 29 183<br />
$ 33,160 $ 249 $ 33,409<br />
Current liabilities (B) $ 3,071 $ 30 $ 3,101<br />
Long-term debt (C) 11,043 (26) 11,017<br />
Other long-term liabilities (B) 1,393 20 1,413<br />
Future income tax (A,B,C,D) 6,963 21 6,984<br />
Share capital 2,562 – 2,562<br />
Retained earnings 8,141 45 8,186<br />
Foreign currency translation adjustment (E) (13) 13 –<br />
Accumulated other comprehensive income (C,E) – 146 146<br />
$ 33,160 $ 249 $ 33,409<br />
2005<br />
<strong>Canadian</strong> Increase<br />
(millions of <strong>Canadian</strong> dollars) Notes GAAP (Decrease) US GAAP<br />
Current assets (C) $ 2,051 $ 338 $ 2,389<br />
Property, plant and equipment (A,D) 19,694 (20) 19,674<br />
Other long-term assets 107 – 107<br />
$ 21,852 $ 318 $ 22,170<br />
Current liabilities (C) $ 3,825 $ 1,005 $ 4,830<br />
Long-term debt (C) 3,321 (18) 3,303<br />
Other long-term liabilities (C) 1,434 8 1,442<br />
Future income tax (A,C,D) 5,035 (5) 5,030<br />
Share capital 2,442 – 2,442<br />
Retained earnings 5,804 (26) 5,778<br />
Foreign currency translation adjustment (E) (9) 9 –<br />
Accumulated other comprehensive income (C,E) – (655) (655)<br />
$ 21,852 $ 318 $ 22,170<br />
NOTES:<br />
(A) Under <strong>Canadian</strong> full cost accounting rules, costs capitalized in each cost centre are limited to an amount equal to the undiscounted,<br />
future net revenues from proved reserves using estimated future prices and costs, plus the carrying amount of unproved properties<br />
and major development projects (the “ceiling test”). Under the full cost method of accounting as set forth by the US Securities and<br />
Exchange Commission, the ceiling test differs from <strong>Canadian</strong> GAAP in that future net revenues from proved reserves are based on<br />
prices and costs as at the balance sheet date (“constant dollar pricing”) and are discounted at 10%. Capitalized costs and future net<br />
revenues are determined on a net of tax basis. These differences in applying the ceiling test to prior years resulted in the recognition of<br />
a ceiling test impairment under US GAAP, decreasing property, plant and equipment.<br />
For the year ended December 31, 2006, US GAAP net earnings would have increased by $3 million (2005 – $4 million,<br />
2004 – $4 million), net of income taxes of $2 million (2005 – $3 million, 2004 – $2 million) to reflect the impact of lower depletion<br />
charges.<br />
(B) The Company accounts for its stock-based compensation liability under <strong>Canadian</strong> GAAP using the intrinsic value method, as described<br />
in note 1(O). Under US GAAP, effective January 1, 2006, the Company would have adopted Financial Accounting Standards Board<br />
Statement (“FAS”) 123(R), which requires companies to account for all stock-based compensation liabilities using the fair value<br />
method, where fair value is measured using an option pricing model. The Company uses the Black Scholes option pricing model to<br />
determine the fair value of its stock-based compensation liability for US GAAP purposes. The previous US GAAP standard, FAS 123,<br />
required companies to account for cash settled stock-based compensation liabilities using the intrinsic value method. For the year<br />
ended December 31, 2006 US GAAP net earnings would have decreased by $48 million, net of income taxes of $21 million, including<br />
the cumulative effect of the change in accounting policy of $8 million, net of income taxes of $3 million. There was no difference from<br />
<strong>Canadian</strong> GAAP prior to 2006.<br />
(C) The Company accounts for its derivative financial instruments under <strong>Canadian</strong> GAAP as described in note 1(P). For US GAAP purposes,<br />
FAS 133, “Accounting for Derivative Financial Instruments and Hedging Activities,” as amended by FAS 138 and FAS 149, establishes<br />
US GAAP accounting and reporting standards for derivative instruments, including certain derivative instruments embedded in other<br />
contracts, and for hedging activities. Generally, all derivatives, whether designated in hedging relationships or not, and excluding
<strong>Canadian</strong> <strong>Natural</strong> AR2006<br />
Page 98 of 107<br />
normal purchases and normal sales, are required to be recorded on the balance sheet at fair value. If the derivative is designated as a<br />
fair value hedge, changes in the fair value of the derivative and changes in the fair value of the hedged item attributable to the hedged<br />
risk are recognized in the consolidated statements of earnings each period. If the derivative is designated as a cash flow hedge, the<br />
effective portions of the changes in fair value of the derivative are initially recorded in comprehensive income each period and are<br />
recognized in the consolidated statements of earnings when the hedged item is recognized. Therefore, ineffective portions of changes<br />
in the fair value of hedging instruments are recognized in net earnings immediately for both fair value and cash flow hedges.<br />
The determination of hedge effectiveness and the measurement of hedge ineffectiveness of cash flow hedges are based on a<br />
combination of third party valuations and internally derived valuations. The Company uses these valuations to estimate the fair values<br />
of the underlying physical commodity contracts.<br />
For the year ended December 31, 2006, assets would have increased by $160 million (2005 - $338 million), liabilities would have<br />
decreased by $9 million (2005 – increased by $997 million), and accumulated other comprehensive income would have increased by<br />
$159 million (2005 – decreased by $646 million) as a result of recording all derivative financial instruments at fair value in accordance<br />
with US GAAP.<br />
The net earnings associated with realized and unrealized hedge ineffectiveness on derivative contracts designated as cash<br />
flow hedges during the year would have been $29 million, net of income taxes of $15 million (2005 – loss of $19 million,<br />
net of income taxes of $11 million; 2004 – loss of $9 million, net of income taxes of $7 million). The company estimates that<br />
$122 million of after-tax hedging gains will be reclassified from accumulated other comprehensive income to current period earnings<br />
within the next twelve month period as a result of forecasted sales occurring.<br />
Under <strong>Canadian</strong> GAAP, the Company hedged the foreign currency component of the US dollar purchase price of ACC using derivative<br />
financial instruments formally designated as cash flow hedges. Under US GAAP, the foreign currency component of a business<br />
combination is not eligible for cash flow hedging, and therefore, the $88 million after-tax gain on the derivative financial instruments<br />
and related depletion expense of $1 million, net of income taxes of $1 million, would have been included in net earnings.<br />
Accordingly, for the year ended December 31, 2006 US GAAP net earnings would have increased in total by $117 million, net of<br />
income taxes of $15 million (2005 – decreased net earnings of $19 million, net of income taxes of $11 million; 2004 – decreased net<br />
earnings of $9 million, net of income taxes of $7 million) to reflect the impact of derivative financial instruments.<br />
(D) Under <strong>Canadian</strong> GAAP, the Company began capitalizing interest on the Horizon Project when the Board of Directors approval was<br />
received in 2005. For US GAAP, capitalization of interest on projects constructed over time is mandatory and interest would have been<br />
capitalized to the costs of construction beginning in 2004. For the year ended December 31, 2004, $27 million would have been<br />
capitalized to property, plant and equipment for US GAAP.<br />
(E) Under US GAAP, exchange losses of $4 million, net of income taxes of $nil (2005 - $3 million, net of income taxes of $2 million;<br />
2004 - $9 million, net of income taxes of $4 million) arising from the translation of self-sustaining foreign operations would have been<br />
included in comprehensive income.<br />
(F) Under <strong>Canadian</strong> GAAP, the Company is not required to include potential common shares related to stock options in the calculation<br />
of diluted earnings per share since the Company has recorded the potential settlement of the stock options as a liability. Under<br />
US GAAP FAS 128 “Earnings per Share”, the Company would have included potential common shares related to stock options<br />
in the calculation of diluted earnings per share. For the year ended December 31, 2006, an additional 8,762,000 shares would<br />
have been included in the calculation of diluted earnings per share for US GAAP (2005 – 13,593,000 additional shares,<br />
2004 – 10,111,000 additional shares).<br />
(G) Recently issued accounting standards under US GAAP:<br />
UNCERTAIN TAX POSITIONS<br />
In July 2006, the FASB issued Interpretation (“FIN”) No. 48 “Accounting for Uncertainty in Tax Positions – an Interpretation of FASB<br />
Statement No. 109”, effective for fiscal years beginning after December 15, 2006. FIN 48 prescribes thresholds for recognizing the<br />
benefits of uncertain tax positions in the financial statements. It also provides guidance on derecognition, classification, interest and<br />
penalties, disclosure and transition. The Company is currently assessing the impact of FIN 48 on its consolidated financial statements.
Supplementary Oil & Gas Information<br />
Page 99 of 107<br />
Supplementary Oil & Gas Information<br />
(unaudited)<br />
This supplementary crude oil and natural gas information is provided in accordance with the United States FAS 69, “Disclosures about Oil<br />
and Gas Producing Activities”, and where applicable is reconciled to the US GAAP financial information.<br />
NET PROVED CRUDE OIL AND NATURAL GAS RESERVES<br />
The Company retains qualified independent reserves evaluators to evaluate the Company’s proved crude oil and natural gas reserves.<br />
� � For the years ended December 31, 2006, 2005, and 2004 the reports by Sproule Associates Limited (“Sproule”) and Ryder Scott<br />
Company covered 100% of the Company’s conventional reserves;<br />
� � For the year ended December 31, 2003, the reports by Sproule covered 100% of the Company’s conventional reserves.<br />
Proved crude oil and natural gas reserves are the estimated quantities of crude oil, natural gas and natural gas liquids that geological and<br />
engineering data demonstrate with reasonable certainty to be recoverable in future years from known reservoirs under existing economic<br />
and operating conditions. Proved developed reserves are reserves that can be expected to be recovered from existing wells with existing<br />
equipment and operating methods.<br />
Estimates of crude oil and natural gas reserves are subject to uncertainty and will change as additional information regarding producing<br />
fields and technology becomes available and as future economic and operating conditions change.<br />
The following table summarizes the Company’s proved and proved developed conventional crude oil and natural gas reserves, net of<br />
royalties, as at December 31, 2006, 2005, 2004 and 2003:<br />
North North Offshore<br />
Crude oil and NGLs (mmbbl)<br />
Net proved reserves<br />
America Sea West Africa Total<br />
Reserves, December 31, 2003 588 222 85 895<br />
Extensions and discoveries 17 – – 17<br />
Improved recovery 25 45 – 70<br />
Purchases of reserves in place 36 38 – 74<br />
Sales of reserves in place – – – –<br />
Production (66) (24) (4) (94)<br />
Revisions of previous estimates 48 22 34 104<br />
Reserves, December 31, 2004 648 303 115 1,066<br />
Extensions and discoveries 98 – – 98<br />
Improved recovery 3 3 2 8<br />
Purchases of reserves in place – – 15 15<br />
Sales of reserves in place (3) – – (3)<br />
Production (70) (25) (8) (103)<br />
Revisions of previous estimates 18 9 10 37<br />
Reserves, December 31, 2005 694 290 134 1,118<br />
Extensions and discoveries 53 3 – 56<br />
Improved recovery 190 26 – 216<br />
Purchases of reserves in place 26 – – 26<br />
Sales of reserves in place – – – –<br />
Production (75) (22) (13) (110)<br />
Revisions of previous estimates (1) 2 9 10<br />
Reserves, December 31, 2006<br />
Net proved developed reserves:<br />
887 299 130 1,316<br />
December 31, 2003 348 138 23 509<br />
December 31, 2004 367 218 20 605<br />
December 31, 2005 402 214 80 696<br />
December 31, 2006 420 214 63 697
<strong>Canadian</strong> <strong>Natural</strong> AR2006<br />
Page 100 of 107<br />
North North Offshore<br />
<strong>Natural</strong> gas (bcf)<br />
Net proved reserves<br />
America Sea West Africa Total<br />
Reserves, December 31, 2003 2,426 62 64 2,552<br />
Extensions and discoveries 334 – – 334<br />
Improved recovery 80 – – 80<br />
Purchases of reserves in place 182 10 – 192<br />
Sales of reserves in place (8) – – (8)<br />
Production (383) (18) (3) (404)<br />
Revisions of previous estimates (40) (27) 11 (56)<br />
Reserves, December 31, 2004 2,591 27 72 2,690<br />
Extensions and discoveries 506 – – 506<br />
Improved recovery 30 – – 30<br />
Purchases of reserves in place 6 – – 6<br />
Sales of reserves in place (23) – – (23)<br />
Production (411) (7) (1) (419)<br />
Revisions of previous estimates 42 9 1 52<br />
Reserves, December 31, 2005 2,741 29 72 2,842<br />
Extensions and discoveries 250 – – 250<br />
Improved recovery 74 – – 74<br />
Purchases of reserves in place 1,111 – – 1,111<br />
Sales of reserves in place (1) – – (1)<br />
Production (433) (5) (3) (441)<br />
Revisions of previous estimates (37) 13 (13) (37)<br />
Reserves, December 31, 2006<br />
Net proved developed reserves:<br />
3,705 37 56 3,798<br />
December 31, 2003 2,140 46 12 2,198<br />
December 31, 2004 2,213 12 5 2,230<br />
December 31, 2005 2,300 16 10 2,326<br />
December 31, 2006 2,934 17 12 2,963<br />
CAPITALIZED COSTS RELATED TO CRUDE OIL AND NATURAL GAS ACTIVITIES<br />
North North<br />
2006<br />
Offshore<br />
(millions of <strong>Canadian</strong> dollars) America Sea West Africa Other Total<br />
Proved properties $ 29,596 $ 3,346 $ 1,601 $ 14 $ 34,557<br />
Unproved properties 2,244 24 84 24 2,376<br />
31,840 3,370 1,685 38 36,933<br />
Less: accumulated depletion and depreciation (9,878) (1,341) (481) (14) (11,714)<br />
Net capitalized costs $ 21,962 $ 2,029 $ 1,204 $ 24 $ 25,219<br />
North North<br />
2005<br />
Offshore<br />
(millions of <strong>Canadian</strong> dollars) America Sea West Africa Other Total<br />
Proved properties $ 20,886 $ 2,675 $ 1,365 $ 14 $ 24,940<br />
Unproved properties 1,372 28 182 13 1,595<br />
22,258 2,703 1,547 27 26,535<br />
Less: accumulated depletion and depreciation (7,993) (1,022) (294) (14) (9,323)<br />
Net capitalized costs $ 14,265 $ 1,681 $ 1,253 $ 13 $ 17,212<br />
North North<br />
2004<br />
Offshore<br />
(millions of <strong>Canadian</strong> dollars) America Sea West Africa Other Total<br />
Proved properties $ 18,722 $ 2,506 $ 563 $ 14 $ 21,805<br />
Unproved properties 1,028 44 528 8 1,608<br />
19,750 2,550 1,091 22 23,413<br />
Less: accumulated depletion and depreciation (6,410) (727) (190) (14) (7,341)<br />
Net capitalized costs $ 13,340 $ 1,823 $ 901 $ 8 $ 16,072
Supplementary Oil & Gas Information<br />
Page 101 of 107<br />
COSTS INCURRED IN CRUDE OIL AND NATURAL GAS ACTIVITIES<br />
North North<br />
2006<br />
Offshore<br />
(millions of <strong>Canadian</strong> dollars)<br />
Property acquisitions<br />
America Sea West Africa Other Total<br />
Proved $ 5,627 $ – $ 1 $ – $ 5,628<br />
Unproved 910 – – – 910<br />
Exploration 238 4 1 11 254<br />
Development 2,807 628 133 – 3,568<br />
Costs incurred $ 9,582 $ 632 $ 135 $ 11 $ 10,360<br />
North North<br />
2005<br />
Offshore<br />
(millions of <strong>Canadian</strong> dollars)<br />
Property acquisitions<br />
America Sea West Africa Other Total<br />
Proved $ (448) $ (3) $ 63 $ – $ (388)<br />
Unproved 210 – (52) – 158<br />
Exploration 360 22 16 5 403<br />
Development 2,386 232 439 – 3,057<br />
Costs incurred $ 2,508 $ 251 $ 466 $ 5 $ 3,230<br />
North North<br />
2004<br />
Offshore<br />
(millions of <strong>Canadian</strong> dollars)<br />
Property acquisitions<br />
America Sea West Africa Other Total<br />
Proved $ 1,806 $ 530 $ – $ – $ 2,336<br />
Unproved 298 4 – – 302<br />
Exploration 290 11 36 1 338<br />
Development 1,443 235 259 – 1,937<br />
Costs incurred $ 3,837 $ 780 $ 295 $ 1 $ 4,913<br />
RESULTS OF OPERATIONS FROM CRUDE OIL AND NATURAL GAS PRODUCING<br />
ACTIVITIES<br />
The Company’s results of operations from crude oil and natural gas producing activities for the years ended December 31, 2006, 2005 and<br />
2004 are summarized in the following tables:<br />
2006<br />
North North Offshore<br />
(millions of <strong>Canadian</strong> dollars) America Sea West Africa Total<br />
Crude oil and natural gas revenue, net of royalties and blending costs $ 5,707 $ 1,310 $ 911 $ 7,928<br />
Production (1,436) (390) (106) (1,932)<br />
Transportation (326) (15) (1) (342)<br />
Depletion, depreciation and amortization (1,894) (297) (189) (2,380)<br />
Asset retirement obligation accretion (35) (31) (2) (68)<br />
Petroleum revenue tax – (234) – (234)<br />
Income tax (706) (172) (172) (1,050)<br />
Results of operations $ 1,310 $ 171 $ 441 $ 1,922<br />
2005<br />
North North Offshore<br />
(millions of <strong>Canadian</strong> dollars) America Sea West Africa Total<br />
Crude oil and natural gas revenue, net of royalties and blending costs $ 5,727 $ 1,499 $ 472 $ 7,698<br />
Production (1,211) (379) (53) (1,643)<br />
Transportation (287) (20) – (307)<br />
Depletion, depreciation and amortization (1,588) (306) (104) (1,998)<br />
Asset retirement obligation accretion (34) (34) (1) (69)<br />
Petroleum revenue tax – (172) – (172)<br />
Income tax (1,007) (235) (110) (1,352)<br />
Results of operations $ 1,600 $ 353 $ 204 $ 2,157
<strong>Canadian</strong> <strong>Natural</strong> AR2006<br />
Page 102 of 107<br />
2004<br />
North North Offshore<br />
(millions of <strong>Canadian</strong> dollars) America Sea West Africa Total<br />
Crude oil and natural gas revenue, net of royalties and blending costs $ 4,579 $ 1,203 $ 216 $ 5,998<br />
Production (976) (370) (36) (1,382)<br />
Transportation (256) (32) – (288)<br />
Depletion, depreciation and amortization (1,438) (265) (53) (1,756)<br />
Asset retirement obligation accretion (28) (22) (1) (51)<br />
Petroleum revenue tax – (145) – (145)<br />
Income tax (690) (148) (44) (882)<br />
Results of operations $ 1,191 $ 221 $ 82 $ 1,494<br />
STANDARDIZED MEASURE OF DISCOUNTED FUTURE NET CASH FLOWS FROM<br />
PROVED CRUDE OIL AND NATURAL GAS RESERVES AND CHANGES THEREIN<br />
The following standardized measure of discounted future net cash flows from proved crude oil and natural gas reserves has been computed<br />
using year-end sales prices and costs and year-end statutory income tax rates. A discount factor of 10% has been applied in determining<br />
the standardized measure of discounted future net cash flows. The Company does not believe that the standardized measure of discounted<br />
future net cash flows will be representative of actual future net cash flows and should not be considered to represent the fair value of the<br />
crude oil and natural gas properties. Actual net cash flows will differ from the presented estimated future net cash flows due to several<br />
factors including:<br />
� � Future production will include production not only from proved properties, but may also include production from probable and<br />
potential reserves;<br />
� � Future production of crude oil and natural gas from proved properties will differ from reserves estimated;<br />
� � Future production rates will vary from those estimated;<br />
� � Future rather than year-end sales prices and costs will apply;<br />
� � Economic factors such as interest rates, income tax rates, regulatory and fiscal environments and operating conditions will change;<br />
� � Future estimated income taxes do not take into account the effects of future exploration expenditures; and<br />
� � Future development and asset retirement obligations will differ from those estimated.<br />
Future net revenues, development, production and restoration costs have been based upon the estimates referred to above. The following<br />
tables summarize the Company’s future net cash flows relating to proved crude oil and natural gas reserves based on the standardized<br />
measure as prescribed in FAS 69:<br />
2006<br />
North North Offshore<br />
(millions of <strong>Canadian</strong> dollars) America Sea West Africa Total<br />
Future cash inflows $ 63,368 $ 20,815 $ 7,779 $ 91,962<br />
Future production costs (21,634) (8,077) (2,517) (32,228)<br />
Future development and asset retirement obligations (7,029) (4,348) (824) (12,201)<br />
Future income taxes (9,118) (5,623) (1,372) (16,113)<br />
Future net cash flows 25,587 2,767 3,066 31,420<br />
10% annual discount for timing of future cash flows (11,214) (956) (1,258) (13,428)<br />
Standardized measure of future net cash flows $ 14,373 $ 1,811 $ 1,808 $ 17,992<br />
2005<br />
North North Offshore<br />
(millions of <strong>Canadian</strong> dollars) America Sea West Africa Total<br />
Future cash inflows $ 52,266 $ 19,961 $ 8,515 $ 80,742<br />
Future production costs (17,310) (6,130) (1,803) (25,243)<br />
Future development and asset retirement obligations (3,916) (3,099) (1,032) (8,047)<br />
Future income taxes (10,272) (6,631) (2,092) (18,995)<br />
Future net cash flows 20,768 4,101 3,588 28,457<br />
10% annual discount for timing of future cash flows (7,793) (1,144) (1,068) (10,005)<br />
Standardized measure of future net cash flows $ 12,975 $ 2,957 $ 2,520 $ 18,452
Supplementary Oil & Gas Information<br />
Page 103 of 107<br />
2004<br />
North North Offshore<br />
(millions of <strong>Canadian</strong> dollars) America Sea West Africa Total<br />
Future cash inflows $ 31,727 $ 15,526 $ 5,249 $ 52,502<br />
Future production costs (10,995) (6,302) (1,137) (18,434)<br />
Future development and asset retirement obligations (2,944) (2,832) (631) (6,407)<br />
Future income taxes (6,438) (3,783) (1,242) (11,463)<br />
Future net cash flows 11,350 2,609 2,239 16,198<br />
10% annual discount for timing of future cash flows (4,385) (691) (634) (5,710)<br />
Standardized measure of future net cash flows $ 6,965 $ 1,918 $ 1,605 $ 10,488<br />
The principal sources of change in the standardized measure of discounted future net cash flows are summarized in the<br />
following table:<br />
(millions of <strong>Canadian</strong> dollars) 2006 2005 2004<br />
Sales of crude oil and natural gas produced, net of production costs $ (5,635) $ (5,785) $ (4,331)<br />
Net changes in sales prices and production costs (2,420) 11,056 (553)<br />
Extensions, discoveries and improved recovery 4,769 3,596 2,120<br />
Changes in estimated future development costs (1,885) (971) (894)<br />
Purchases of proved reserves in place 2,406 469 1,386<br />
Sales of proved reserves in place (2) (130) (20)<br />
Revisions of previous reserve estimates 81 961 1,431<br />
Accretion of discount 3,112 1,812 1,558<br />
Changes in production timing and other (2,156) 1,414 1,357<br />
Net change in income taxes 1,270 (4,458) (997)<br />
Net change (460) 7,964 1,057<br />
Balance – beginning of year 18,452 10,488 9,431<br />
Balance – end of year $ 17,992 $ 18,452 $ 10,488
<strong>Canadian</strong> <strong>Natural</strong> AR2006<br />
Page 104 of 107<br />
Ten-Year Review<br />
Years ended December 31<br />
FINANCIAL INFORMATION<br />
(Cdn $ millions, except per share amounts)<br />
2006 2005 2004 2003 2002 2001 2000 1999 1998 1997<br />
Net earnings 2,524 1,050 1,405 1,403 539 639 758 213 31 104<br />
Per share - basic (1) $ 4.70 $ 1.96 $ 2.62 $ 2.62 $ 1.06 $ 1.32 $ 1.62 $ 0.51 $ 0.08 $ 0.26<br />
Cash flow from operations (2) 4,932 5,021 3,769 3,160 2,254 1,920 1,884 724 444 503<br />
Per share - basic (1) $ 9.18 $ 9.36 $ 7.03 $ 5.88 $ 4.41 $ 3.96 $ 4.04 $ 1.74 $ 1.12 $ 1.28<br />
Capital expenditures, net of dispositions<br />
(including business combinations) 12,025<br />
Balance Sheet information<br />
4,932 4,633 2,506 4,069 1,885 2,823 1,901 610 1,119<br />
Working capital (deficiency) surplus (832) (1,774) (652) (505) (14) (6) (77) 36 58 (19)<br />
Property, plant and equipment, net 30,767 19,694 17,064 13,714 12,934 8,766 7,439 4,679 3,135 2,831<br />
Total assets 33,160 21,852 18,372 14,643 13,793 9,290 8,051 4,976 3,329 3,016<br />
Long-term debt 11,043 3,321 3,538 2,748 4,200 2,788 2,573 2,157 1,426 1,136<br />
Shareholders’ equity 10,690 8,237 7,324 6,006 4,754 3,928 3,297 1,962 1,317 1,250<br />
SHARE INFORMATION<br />
Common shares outstanding<br />
(thousands)<br />
Weighted average shares<br />
537,903 536,348 536,361 534,926 535,104 484,804 489,116 445,816 399,236 395,276<br />
outstanding (thousands)<br />
Dividends declared<br />
537,339 536,650 536,223 536,940 511,532 485,200 466,804 415,624 397,324 392,168<br />
per common share $ 0.30 $ 0.24 $ 0.20 $ 0.15 $ 0.13 $ 0.10 $ – $ – $ – $ –<br />
Trading statistics (1)<br />
TSX-C$<br />
Trading volume (thousands) 508,935 637,992 606,024 590,702 619,316 534,976 567,412 430,460 410,440 402,152<br />
Share Price ($/share)<br />
High $ 73.91 $ 62.00 $ 27.58 $ 16.81 $ 13.64 $ 13.09 $ 14.05 $ 9.65 $ 7.88 $ 11.06<br />
Low $ 45.49 $ 24.28 $ 15.96 $ 11.30 $ 9.40 $ 8.98 $ 7.45 $ 4.95 $ 4.56 $ 7.23<br />
Close $ 62.15 $ 57.63 $ 25.63 $ 16.34 $ 11.70 $ 9.58 $ 10.38 $ 8.81 $ 5.75 $ 7.65<br />
NYSE - US$<br />
Trading volume (thousands) 401,909 251,554 125,468 46,916 31,864 20,764 3,172 – – –<br />
Share Price ($/share)<br />
High $ 64.38 $ 54.05 $ 22.37 $ 12.85 $ 8.72 $ 8.63 $ 9.46 $ – $ – $ –<br />
Low $ 40.29 $ 19.74 $ 11.94 $ 7.32 $ 5.89 $ 5.70 $ 6.19 $ – $ – $ –<br />
Close $ 53.23 $ 49.62 $ 21.39 $ 12.61 $ 7.42 $ 6.10 $ 6.88 $ – $ – $ –<br />
RATIOS<br />
Debt to book capitalization (3) 50.8% 28.7% 33.8% 32.8% 47.1% 41.7% 44.0% 52.4% 52.0% 47.6%<br />
Return on average common<br />
shareholders’ equity, after tax (3) 26.9% 14.3% 21.4% 25.6% 13.0% 17.7% 28.8% 13.0% 2.4% 8.8%<br />
Daily production before royalties per<br />
thousand common shares (boe/d) (1) 10.8 10.3 9.6 8.5 8.2 7.4 6.6 5.0 4.7 4.5<br />
Conventional proved and probable<br />
reserves per common share (boe) (1)(4) 6.4 4.8 4.3 4.0 3.3 3.1 2.9 2.4 1.9 1.7<br />
Net asset value per common share (1)(5) $ 56.41 $ 60.44 $ 33.13 $ 23.35 $ 19.57 $ 16.88 $ 20.54 $ 12.33 $ 8.08 $ 6.80<br />
(1) Restated to reflect two-for-one share splits in May 2004 and May 2005.<br />
(2) Cash flow from operations is a non-GAAP term that represents net earnings adjusted for non-cash items. The Company evaluates its performance based onnet<br />
earnings and cash flow. Cash flow from operations may not be comparable to similar measures used by other companies.<br />
(3) Refer to the MD&A, page 60, “Liquidity and Capital <strong>Resources</strong>”, for the definitions of these items.<br />
(4) Based upon constant dollar Company gross reserves (before royalties), using year-end common shares outstanding.<br />
(5) Based upon 10% discounted, forecast price pre-tax proved and probable net present values as reported in the Company’s AIF for conventional reserves, with<br />
$250/acre added for core undeveloped land in 2005 and 2006, $75/acre for all years prior, less long-term debt and existing asset liabilities and adjusted for working<br />
capital. See reserves disclosures on pages 37 to 41.
Ten-Year Review<br />
Page 105 of 107<br />
Years ended December 31 2006 2005 2004 2003 2002 2001 2000 1999 1998 1997<br />
OPERATING INFORMATION<br />
Conventional crude oil and NGLs (mmbbl)<br />
Company gross proved reserves<br />
(before royalties)<br />
North America 1,043 785 695 672 665 644 643 554 284 257<br />
North Sea 299 290 303 222 203 83 102 – – –<br />
Offshore West Africa 145 148 125 106 94 61 36 – – –<br />
1,487 1,223 1,123 1,000 962 788 781 554 284 257<br />
Company gross proved and<br />
probable reserves (before royalties)<br />
North America 1,753 1,154 992 977 742 740 731 640 380 329<br />
North Sea 421 417 415 317 277 106 134 – – –<br />
Offshore West Africa 223 230 214 187 162 111 46 – – –<br />
2,397 1,801 1,621 1,481 1,181 957 911 640 380 329<br />
Conventional <strong>Natural</strong> gas (bcf)<br />
Company gross proved reserves<br />
(before royalties)<br />
North America 4,507 3,378 3,202 3,006 3,048 2,566 2,360 2,183 1,901 1,716<br />
North Sea 37 29 27 62 71 94 91 – – –<br />
Offshore West Africa 69 83 81 86 90 69 65 – – –<br />
4,613 3,490 3,310 3,154 3,209 2,729 2,516 2,183 1,901 1,716<br />
Company gross proved and<br />
probable reserves (before royalties)<br />
North America 5,898 4,372 4,100 3,611 3,450 2,915 2,762 2,547 2,211 2,078<br />
North Sea 93 69 57 101 89 118 114 – – –<br />
Offshore West Africa 121 127 102 111 120 96 84 – – –<br />
6,112 4,568 4,259 3,823 3,659 3,129 2,960 2,547 2,211 2,078<br />
Total proved reserves<br />
(before royalties) (mmboe)<br />
Total proved and probable reserves<br />
2,256 1,804 1,674 1,526 1,497 1,243 1,200 918 601 543<br />
(before royalties) (mmboe) 3,416 2,562 2,330 2,118 1,791 1,479 1,404 1,065 749 675<br />
Oil Sands, mining (mmbbl)<br />
Gross proved and probable reserves<br />
(before royalties)<br />
Bitumen 3,530 3,430 – – – – – – – –<br />
Synthetic crude oil (1) 2,962 2,878 – – – – – – – –<br />
Daily production (before royalties)<br />
Crude oil and NGLs (mbbl/d)<br />
North America 235 222 206 175 169 167 155 87 76 71<br />
North Sea 60 68 65 57 39 36 17 – – –<br />
Offshore West Africa 37 23 12 10 7 3 2 – – –<br />
<strong>Natural</strong> gas (mmcf/d)<br />
332 313 283 242 215 206 174 87 76 71<br />
North America 1,468 1,416 1,330 1,245 1,204 906 793 721 673 626<br />
North Sea 15 19 50 46 27 12 1 – – –<br />
Offshore West Africa 9 4 8 8 1 – – – – –<br />
1,492 1,439 1,388 1,299 1,232 918 794 721 673 626<br />
Total production<br />
(before royalties) (mboe/d) 581 553 514 459 421 359 306 207 188 175<br />
Product Pricing<br />
Average crude oil<br />
and NGLs price ($/bbl) 53.65 46.86 37.99 32.66 31.22 23.45 31.89 22.26 11.98 18.99<br />
Average natural gas price ($/mcf) 6.72 8.57 6.50 6.21 3.77 5.45 4.92 2.52 2.11 1.97<br />
(1) SCO reserves are based upon upgrading of the bitumen reserves. The reserves shown for bitumen and SCO are not additive.
<strong>Canadian</strong> <strong>Natural</strong> AR2006<br />
Page 106 of 107<br />
Corporate Information<br />
Board of Directors<br />
(1 – Chair) (2)<br />
*Catherine M. Best<br />
Executive Vice-President, Risk Management & Chief Financial Officer,<br />
Calgary Health Region Calgary, Alberta<br />
N. Murray Edwards (4)<br />
President, Edco Financial Holdings <strong>Ltd</strong>.<br />
Calgary, Alberta<br />
(1) (3)<br />
*Honourable Gary A. Filmon, P.C., O.M.<br />
Consultant, Exchange Group<br />
Winnipeg, Manitoba<br />
(1) (3 – Chair)<br />
*Ambassador Gordon D. Giffin<br />
Senior Partner, McKenna Long & Aldridge LLP<br />
Atlanta, Georgia<br />
John G. Langille<br />
Vice-Chairman of the Board<br />
<strong>Canadian</strong> <strong>Natural</strong> <strong>Resources</strong> Limited<br />
Calgary, Alberta<br />
Steve W. Laut<br />
President & Chief Operating Officer,<br />
<strong>Canadian</strong> <strong>Natural</strong> <strong>Resources</strong> Limited<br />
Calgary, Alberta<br />
(4) (5)<br />
Keith A. J. MacPhail<br />
Chairman, President & Chief Executive Officer,<br />
Bonavista Energy Trust<br />
Calgary, Alberta<br />
Allan P. Markin (5)<br />
Chairman of the Board,<br />
<strong>Canadian</strong> <strong>Natural</strong> <strong>Resources</strong> Limited<br />
Calgary, Alberta<br />
(2) (4) (5)<br />
*Norman F. McIntyre<br />
Independent Businessman<br />
Calgary, Alberta<br />
(2) (3)<br />
*Honourable Frank J. McKenna, P.C., O.N.B., Q.C.<br />
Deputy Chair, TD Bank Financial Group<br />
Cap Pelé, New Brunswick<br />
(2 – Chair) (4) (5)<br />
*James S. Palmer, C.M., A.O.E., Q.C.<br />
Chairman and Partner,<br />
Burnet, Duckworth & Palmer LLP<br />
Calgary, Alberta<br />
(2) (5 – Chair)<br />
*Eldon R. Smith, OC, M.D.<br />
Emeritus Professor and Former Dean,<br />
Faculty of Medicine, University of Calgary<br />
Calgary, Alberta<br />
(1) (3) (4 – Chair)<br />
*David A. Tuer<br />
Executive Vice-Chairman, BA Energy Inc.<br />
Calgary, Alberta<br />
(1) Audit Committee member<br />
(2) Compensation Committee member<br />
(3) Nominating and Corporate Governance Committee member<br />
(4) Reserves Committee member<br />
(5) Health, Safety and Environmental Committee member<br />
*Determined to be independent by the Nominating and Corporate Governance<br />
Committee and the Board of Directors and pursuant to the independent<br />
standards established under National Instrument 58-101 and the New York<br />
Stock Exchange Corporate Governance Listing Standards.<br />
Management Committee<br />
Allan P. Markin<br />
Chairman of the Board<br />
N. Murray Edwards<br />
Vice-Chairman of the Board<br />
John G. Langille<br />
Vice-Chairman of the Board<br />
Steve W. Laut<br />
President & Chief Operating Officer<br />
Réal M. Cusson<br />
Senior Vice-President, Marketing<br />
Réal J.H. Doucet<br />
Senior Vice-President, Oil Sands<br />
Allen M. Knight<br />
Senior Vice-President, International & Corporate Development<br />
Tim S. McKay<br />
Senior Vice-President, Operations<br />
Douglas A. Proll<br />
Chief Financial Officer & Senior Vice-President, Finance<br />
Lyle G. Stevens<br />
Senior Vice-President, Exploitation<br />
Jeff W. Wilson<br />
Senior Vice-President, Exploration<br />
Mary-Jo E. Case<br />
Vice-President, Land<br />
Randall S. Davis<br />
Vice-President, Finance & Accounting
Corporate Information<br />
Page 107 of 107<br />
Corporate Offices<br />
HEAD OFFICE<br />
<strong>Canadian</strong> <strong>Natural</strong> <strong>Resources</strong> Limited<br />
2500, 855 - 2 Street S.W.<br />
Calgary, AB T2P 4J8<br />
Telephone: (403) 517-6700<br />
Facsimile: (403) 517-7350<br />
Website: www.cnrl.com<br />
INVESTOR RELATIONS<br />
Telephone: (403) 514-7777<br />
Facsimile: (403) 514-7888<br />
Email: ir@cnrl.com<br />
INTERNATIONAL OFFICE<br />
CNR International (U.K.) Limited<br />
St. Magnus House, Guild Street<br />
Aberdeen AB11 6NJ Scotland<br />
Corporate Governance<br />
<strong>Canadian</strong> <strong>Natural</strong>’s corporate governance practices and<br />
disclosure of those practices are in compliance with National<br />
Policy 58-201 Corporate Governance Guidelines and National<br />
Instrument 58-101 Disclosure of Corporate Governance<br />
Practices. <strong>Canadian</strong> <strong>Natural</strong>, as a “foreign private issuer” in the<br />
United States, may rely on home jurisdiction listing standards<br />
for compliance with most of the New York Stock Exchange<br />
(“NYSE”) Corporate Governance Listing Standards but must<br />
disclose any significant differences between its corporate<br />
governance practices and those required for U.S. companies<br />
listed on the NYSE.<br />
Toronto Stock Exchange (“TSX”) rules provide that only the<br />
creation of or material amendments to equity compensation<br />
plans which provide for new issuance of securities are<br />
subject to shareholder approval. However, the NYSE requires<br />
shareholder approval of all equity compensation plans and<br />
material revisions to such plans. <strong>Canadian</strong> <strong>Natural</strong> follows<br />
TSX rules with respect to shareholder approval of equity<br />
compensation plans.<br />
<strong>Canadian</strong> <strong>Natural</strong> has included as exhibits to its Annual Report<br />
on Form 40-F for the 2006 fiscal year filed with the United<br />
States Securities and Exchange Commission certificates of the<br />
Chief Executive Officer and Chief Financial Officer certifying<br />
the quality of its public disclosure.<br />
Registrar and Transfer Agent<br />
Computershare Trust Company of Canada<br />
Calgary, Alberta<br />
Toronto, Ontario<br />
Computershare Investor Services LLC<br />
New York, New York<br />
Auditors<br />
PricewaterhouseCoopers LLP<br />
Calgary, Alberta<br />
Independent Qualified<br />
Reserves Evaluators<br />
GLJ Petroleum Consultants<br />
Calgary, Alberta<br />
Ryder Scott Company<br />
Calgary, Alberta<br />
Sproule Associates Limited<br />
Calgary, Alberta<br />
Stock Listing<br />
CNQ<br />
The Toronto Stock Exchange<br />
The New York Stock Exchange<br />
Printed in Canada by Sundog Printing.<br />
Management photography by Gary Campbell.<br />
Additional photography by Christine Flatt,<br />
Edwin Herrenschmidt and<br />
<strong>Canadian</strong> <strong>Natural</strong> team members.
<strong>Canadian</strong> <strong>Natural</strong> <strong>Resources</strong> Limited<br />
2500, 855 - 2 Street SW<br />
Calgary, Alberta<br />
Canada T2P 4J8<br />
Phone: 403.517.6700<br />
Fax: 403.517.7350<br />
www.cnrl.com<br />
<strong>Discipline</strong><br />
<strong>Opportunity</strong><br />
<strong>Strategy</strong>