

SVY - Stata
SVY - Stata
SVY - Stata

Create successful ePaper yourself
Turn your PDF publications into a flip-book with our unique Google optimized e-Paper software.
20 survey — Introduction to survey commands<br />
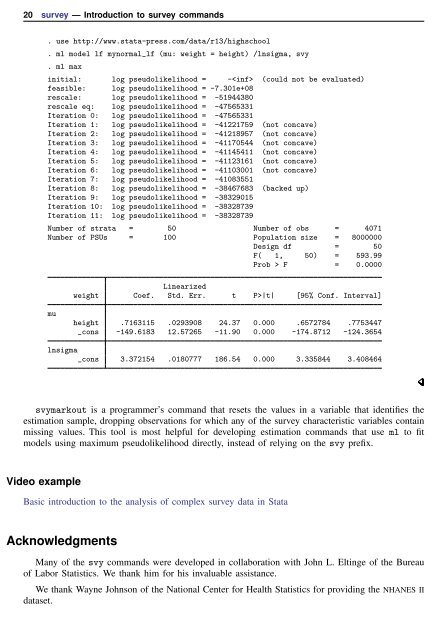
. use http://www.stata-press.com/data/r13/highschool<br />
. ml model lf mynormal_lf (mu: weight = height) /lnsigma, svy<br />
. ml max<br />
initial: log pseudolikelihood = - (could not be evaluated)<br />
feasible: log pseudolikelihood = -7.301e+08<br />
rescale: log pseudolikelihood = -51944380<br />
rescale eq: log pseudolikelihood = -47565331<br />
Iteration 0: log pseudolikelihood = -47565331<br />
Iteration 1: log pseudolikelihood = -41221759 (not concave)<br />
Iteration 2: log pseudolikelihood = -41218957 (not concave)<br />
Iteration 3: log pseudolikelihood = -41170544 (not concave)<br />
Iteration 4: log pseudolikelihood = -41145411 (not concave)<br />
Iteration 5: log pseudolikelihood = -41123161 (not concave)<br />
Iteration 6: log pseudolikelihood = -41103001 (not concave)<br />
Iteration 7: log pseudolikelihood = -41083551<br />
Iteration 8: log pseudolikelihood = -38467683 (backed up)<br />
Iteration 9: log pseudolikelihood = -38329015<br />
Iteration 10: log pseudolikelihood = -38328739<br />
Iteration 11: log pseudolikelihood = -38328739<br />
Number of strata = 50 Number of obs = 4071<br />
Number of PSUs = 100 Population size = 8000000<br />
Design df = 50<br />
F( 1, 50) = 593.99<br />
Prob > F = 0.0000<br />
Linearized<br />
weight Coef. Std. Err. t P>|t| [95% Conf. Interval]<br />
mu<br />
height .7163115 .0293908 24.37 0.000 .6572784 .7753447<br />
_cons -149.6183 12.57265 -11.90 0.000 -174.8712 -124.3654<br />
lnsigma<br />
_cons 3.372154 .0180777 186.54 0.000 3.335844 3.408464<br />
svymarkout is a programmer’s command that resets the values in a variable that identifies the<br />
estimation sample, dropping observations for which any of the survey characteristic variables contain<br />
missing values. This tool is most helpful for developing estimation commands that use ml to fit<br />
models using maximum pseudolikelihood directly, instead of relying on the svy prefix.<br />
Video example<br />
Basic introduction to the analysis of complex survey data in <strong>Stata</strong><br />
Acknowledgments<br />
Many of the svy commands were developed in collaboration with John L. Eltinge of the Bureau<br />
of Labor Statistics. We thank him for his invaluable assistance.<br />
We thank Wayne Johnson of the National Center for Health Statistics for providing the NHANES II<br />
dataset.


