

SVY - Stata
SVY - Stata
SVY - Stata

You also want an ePaper? Increase the reach of your titles
YUMPU automatically turns print PDFs into web optimized ePapers that Google loves.
survey — Introduction to survey commands 11<br />
All the standard postestimation commands (for example, estimates, lincom, margins, nlcom,<br />
test, testnl) are also available after svy.<br />
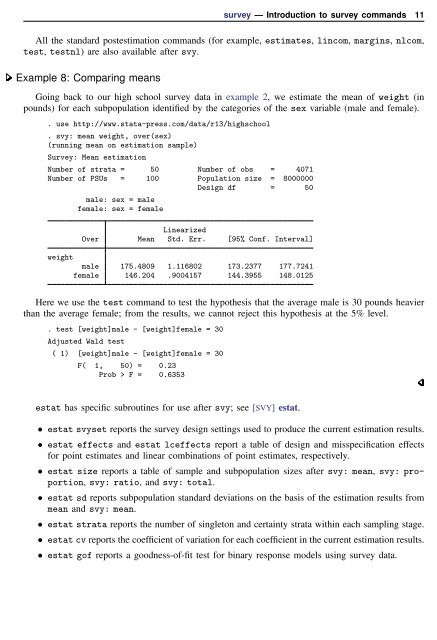
Example 8: Comparing means<br />
Going back to our high school survey data in example 2, we estimate the mean of weight (in<br />
pounds) for each subpopulation identified by the categories of the sex variable (male and female).<br />
. use http://www.stata-press.com/data/r13/highschool<br />
. svy: mean weight, over(sex)<br />
(running mean on estimation sample)<br />
Survey: Mean estimation<br />
Number of strata = 50 Number of obs = 4071<br />
Number of PSUs = 100 Population size = 8000000<br />
Design df = 50<br />
male: sex = male<br />
female: sex = female<br />
Linearized<br />
Over Mean Std. Err. [95% Conf. Interval]<br />
weight<br />
male 175.4809 1.116802 173.2377 177.7241<br />
female 146.204 .9004157 144.3955 148.0125<br />
Here we use the test command to test the hypothesis that the average male is 30 pounds heavier<br />
than the average female; from the results, we cannot reject this hypothesis at the 5% level.<br />
. test [weight]male - [weight]female = 30<br />
Adjusted Wald test<br />
( 1) [weight]male - [weight]female = 30<br />
F( 1, 50) = 0.23<br />
Prob > F = 0.6353<br />
estat has specific subroutines for use after svy; see [<strong>SVY</strong>] estat.<br />
• estat svyset reports the survey design settings used to produce the current estimation results.<br />
• estat effects and estat lceffects report a table of design and misspecification effects<br />
for point estimates and linear combinations of point estimates, respectively.<br />
• estat size reports a table of sample and subpopulation sizes after svy: mean, svy: proportion,<br />
svy: ratio, and svy: total.<br />
• estat sd reports subpopulation standard deviations on the basis of the estimation results from<br />
mean and svy: mean.<br />
• estat strata reports the number of singleton and certainty strata within each sampling stage.<br />
• estat cv reports the coefficient of variation for each coefficient in the current estimation results.<br />
• estat gof reports a goodness-of-fit test for binary response models using survey data.


