

mixed - Stata
mixed - Stata
mixed - Stata

Create successful ePaper yourself
Turn your PDF publications into a flip-book with our unique Google optimized e-Paper software.
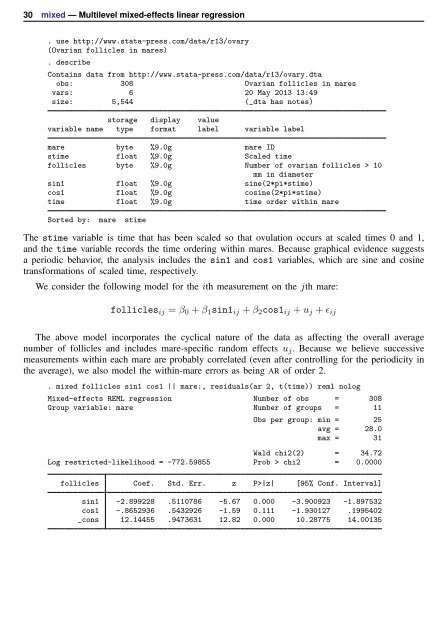
30 <strong>mixed</strong> — Multilevel <strong>mixed</strong>-effects linear regression<br />
. use http://www.stata-press.com/data/r13/ovary<br />
(Ovarian follicles in mares)<br />
. describe<br />
Contains data from http://www.stata-press.com/data/r13/ovary.dta<br />
obs: 308 Ovarian follicles in mares<br />
vars: 6 20 May 2013 13:49<br />
size: 5,544 (_dta has notes)<br />
storage display value<br />
variable name type format label variable label<br />
mare byte %9.0g mare ID<br />
stime float %9.0g Scaled time<br />
follicles byte %9.0g Number of ovarian follicles > 10<br />
mm in diameter<br />
sin1 float %9.0g sine(2*pi*stime)<br />
cos1 float %9.0g cosine(2*pi*stime)<br />
time float %9.0g time order within mare<br />
Sorted by: mare stime<br />
The stime variable is time that has been scaled so that ovulation occurs at scaled times 0 and 1,<br />
and the time variable records the time ordering within mares. Because graphical evidence suggests<br />
a periodic behavior, the analysis includes the sin1 and cos1 variables, which are sine and cosine<br />
transformations of scaled time, respectively.<br />
We consider the following model for the ith measurement on the jth mare:<br />
follicles ij = β 0 + β 1 sin1 ij + β 2 cos1 ij + u j + ɛ ij<br />
The above model incorporates the cyclical nature of the data as affecting the overall average<br />
number of follicles and includes mare-specific random effects u j . Because we believe successive<br />
measurements within each mare are probably correlated (even after controlling for the periodicity in<br />
the average), we also model the within-mare errors as being AR of order 2.<br />
. <strong>mixed</strong> follicles sin1 cos1 || mare:, residuals(ar 2, t(time)) reml nolog<br />
Mixed-effects REML regression Number of obs = 308<br />
Group variable: mare Number of groups = 11<br />
Obs per group: min = 25<br />
avg = 28.0<br />
max = 31<br />
Wald chi2(2) = 34.72<br />
Log restricted-likelihood = -772.59855 Prob > chi2 = 0.0000<br />
follicles Coef. Std. Err. z P>|z| [95% Conf. Interval]<br />
sin1 -2.899228 .5110786 -5.67 0.000 -3.900923 -1.897532<br />
cos1 -.8652936 .5432926 -1.59 0.111 -1.930127 .1995402<br />
_cons 12.14455 .9473631 12.82 0.000 10.28775 14.00135


