

On the Analysis of Optical Mapping Data - University of Wisconsin ...
On the Analysis of Optical Mapping Data - University of Wisconsin ...
On the Analysis of Optical Mapping Data - University of Wisconsin ...

You also want an ePaper? Increase the reach of your titles
YUMPU automatically turns print PDFs into web optimized ePapers that Google loves.
78<br />
−2 0 2<br />
Observed Quantiles<br />
4<br />
2<br />
0<br />
−2<br />
−4<br />
Raw errors<br />
Average errors<br />
−2 0 2<br />
Quantiles <strong>of</strong> Standard Normal<br />
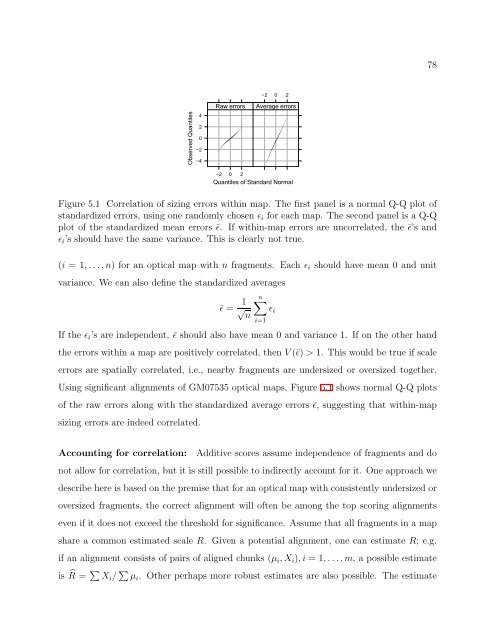
Figure 5.1 Correlation <strong>of</strong> sizing errors within map. The first panel is a normal Q-Q plot <strong>of</strong><br />
standardized errors, using one randomly chosen ǫ i for each map. The second panel is a Q-Q<br />
plot <strong>of</strong> <strong>the</strong> standardized mean errors ¯ǫ. If within-map errors are uncorrelated, <strong>the</strong> ¯ǫ’s and<br />
ǫ i ’s should have <strong>the</strong> same variance. This is clearly not true.<br />
(i = 1, . . .,n) for an optical map with n fragments. Each ǫ i should have mean 0 and unit<br />
variance. We can also define <strong>the</strong> standardized averages<br />
¯ǫ = √ 1 n∑<br />
n<br />
If <strong>the</strong> ǫ i ’s are independent, ¯ǫ should also have mean 0 and variance 1. If on <strong>the</strong> o<strong>the</strong>r hand<br />
<strong>the</strong> errors within a map are positively correlated, <strong>the</strong>n V (¯ǫ) > 1. This would be true if scale<br />
errors are spatially correlated, i.e., nearby fragments are undersized or oversized toge<strong>the</strong>r.<br />
Using significant alignments <strong>of</strong> GM07535 optical maps, Figure 5.1 shows normal Q-Q plots<br />
<strong>of</strong> <strong>the</strong> raw errors along with <strong>the</strong> standardized average errors ¯ǫ, suggesting that within-map<br />
sizing errors are indeed correlated.<br />
i=1<br />
ǫ i<br />
Accounting for correlation: Additive scores assume independence <strong>of</strong> fragments and do<br />
not allow for correlation, but it is still possible to indirectly account for it. <strong>On</strong>e approach we<br />
describe here is based on <strong>the</strong> premise that for an optical map with consistently undersized or<br />
oversized fragments, <strong>the</strong> correct alignment will <strong>of</strong>ten be among <strong>the</strong> top scoring alignments<br />
even if it does not exceed <strong>the</strong> threshold for significance. Assume that all fragments in a map<br />
share a common estimated scale R. Given a potential alignment, one can estimate R; e.g.<br />
if an alignment consists <strong>of</strong> pairs <strong>of</strong> aligned chunks (µ i , X i ), i = 1, . . ., m, a possible estimate<br />
is ̂R = ∑ X i / ∑ µ i . O<strong>the</strong>r perhaps more robust estimates are also possible. The estimate


