

On the Analysis of Optical Mapping Data - University of Wisconsin ...
On the Analysis of Optical Mapping Data - University of Wisconsin ...
On the Analysis of Optical Mapping Data - University of Wisconsin ...

You also want an ePaper? Increase the reach of your titles
YUMPU automatically turns print PDFs into web optimized ePapers that Google loves.
52<br />
Optimal score<br />
20<br />
10<br />
0<br />
−10<br />
−20<br />
Real<br />
Permuted<br />
10 20 30 40<br />
self−alignment score<br />
10 20 30 40<br />
Counts<br />
1236<br />
1090<br />
954<br />
827<br />
708<br />
599<br />
499<br />
409<br />
327<br />
254<br />
191<br />
136<br />
91<br />
55<br />
28<br />
10<br />
1<br />
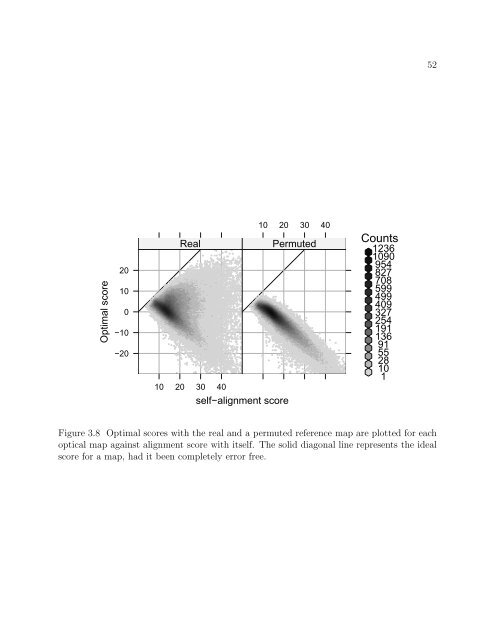
Figure 3.8 Optimal scores with <strong>the</strong> real and a permuted reference map are plotted for each<br />
optical map against alignment score with itself. The solid diagonal line represents <strong>the</strong> ideal<br />
score for a map, had it been completely error free.


