

On the Analysis of Optical Mapping Data - University of Wisconsin ...
On the Analysis of Optical Mapping Data - University of Wisconsin ...
On the Analysis of Optical Mapping Data - University of Wisconsin ...

Create successful ePaper yourself
Turn your PDF publications into a flip-book with our unique Google optimized e-Paper software.
36<br />
0.20<br />
0.15<br />
0.10<br />
0.05<br />
0.00<br />
0.700 − 0.005<br />
10 20 30 40 50 60<br />
0.750 − 0.005 0.800 − 0.005<br />
0.700 − 0.003 0.750 − 0.003<br />
0.800 − 0.003<br />
0.20<br />
P(X = x)<br />
0.15<br />
0.10<br />
0.05<br />
0.00<br />
0.20<br />
0.15<br />
0.10<br />
0.05<br />
0.00<br />
0.700 − 0.001 0.750 − 0.001<br />
0.800 − 0.001<br />
10 20 30 40 50 60<br />
x<br />
10 20 30 40 50 60<br />
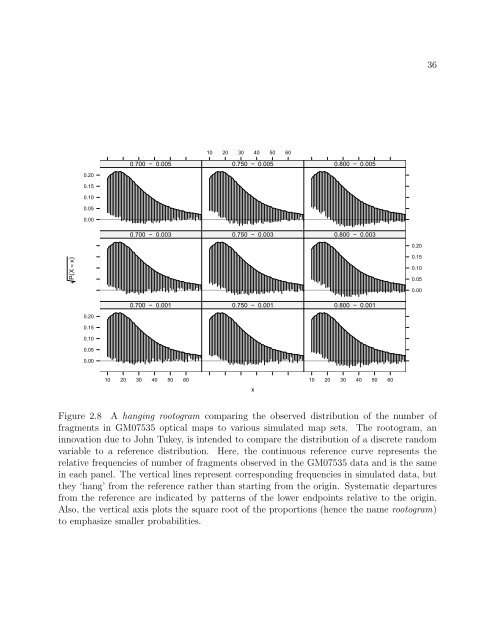
Figure 2.8 A hanging rootogram comparing <strong>the</strong> observed distribution <strong>of</strong> <strong>the</strong> number <strong>of</strong><br />
fragments in GM07535 optical maps to various simulated map sets. The rootogram, an<br />
innovation due to John Tukey, is intended to compare <strong>the</strong> distribution <strong>of</strong> a discrete random<br />
variable to a reference distribution. Here, <strong>the</strong> continuous reference curve represents <strong>the</strong><br />
relative frequencies <strong>of</strong> number <strong>of</strong> fragments observed in <strong>the</strong> GM07535 data and is <strong>the</strong> same<br />
in each panel. The vertical lines represent corresponding frequencies in simulated data, but<br />
<strong>the</strong>y ‘hang’ from <strong>the</strong> reference ra<strong>the</strong>r than starting from <strong>the</strong> origin. Systematic departures<br />
from <strong>the</strong> reference are indicated by patterns <strong>of</strong> <strong>the</strong> lower endpoints relative to <strong>the</strong> origin.<br />
Also, <strong>the</strong> vertical axis plots <strong>the</strong> square root <strong>of</strong> <strong>the</strong> proportions (hence <strong>the</strong> name rootogram)<br />
to emphasize smaller probabilities.


