

On the Analysis of Optical Mapping Data - University of Wisconsin ...
On the Analysis of Optical Mapping Data - University of Wisconsin ...
On the Analysis of Optical Mapping Data - University of Wisconsin ...

You also want an ePaper? Increase the reach of your titles
YUMPU automatically turns print PDFs into web optimized ePapers that Google loves.
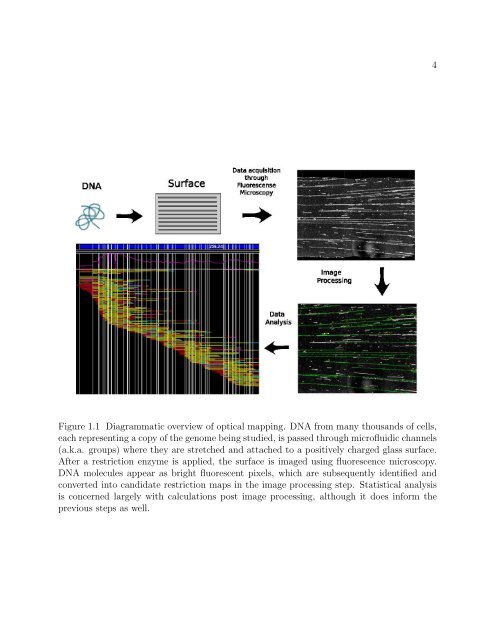
Figure 1.1 Diagrammatic overview <strong>of</strong> optical mapping. DNA from many thousands <strong>of</strong> cells,<br />
each representing a copy <strong>of</strong> <strong>the</strong> genome being studied, is passed through micr<strong>of</strong>luidic channels<br />
(a.k.a. groups) where <strong>the</strong>y are stretched and attached to a positively charged glass surface.<br />
After a restriction enzyme is applied, <strong>the</strong> surface is imaged using fluorescence microscopy.<br />
DNA molecules appear as bright fluorescent pixels, which are subsequently identified and<br />
converted into candidate restriction maps in <strong>the</strong> image processing step. Statistical analysis<br />
is concerned largely with calculations post image processing, although it does inform <strong>the</strong><br />
previous steps as well.<br />
4


