Struggles with Survey Weighting and Regression Modeling paper
Struggles with Survey Weighting and Regression Modeling paper
Struggles with Survey Weighting and Regression Modeling paper

Create successful ePaper yourself
Turn your PDF publications into a flip-book with our unique Google optimized e-Paper software.
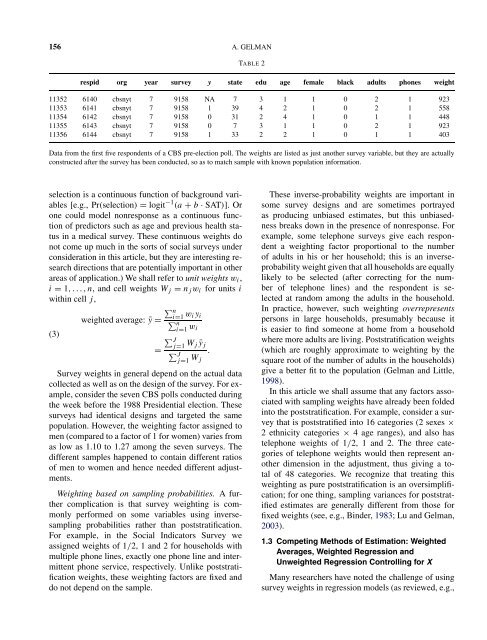
156 A. GELMAN<br />
TABLE 2<br />
respid org year survey y state edu age female black adults phones weight<br />
11352 6140 cbsnyt 7 9158 NA 7 3 1 1 0 2 1 923<br />
11353 6141 cbsnyt 7 9158 1 39 4 2 1 0 2 1 558<br />
11354 6142 cbsnyt 7 9158 0 31 2 4 1 0 1 1 448<br />
11355 6143 cbsnyt 7 9158 0 7 3 1 1 0 2 1 923<br />
11356 6144 cbsnyt 7 9158 1 33 2 2 1 0 1 1 403<br />
Data from the first five respondents of a CBS pre-election poll. The weights are listed as just another survey variable, but they are actually<br />
constructed after the survey has been conducted, so as to match sample <strong>with</strong> known population information.<br />
selection is a continuous function of background variables<br />
[e.g., Pr(selection) = logit −1 (a + b · SAT)]. Or<br />
one could model nonresponse as a continuous function<br />
of predictors such as age <strong>and</strong> previous health status<br />
in a medical survey. These continuous weights do<br />
not come up much in the sorts of social surveys under<br />
consideration in this article, but they are interesting research<br />
directions that are potentially important in other<br />
areas of application.) We shall refer to unit weights w i ,<br />
i = 1,...,n, <strong>and</strong> cell weights W j = n j w i for units i<br />
<strong>with</strong>in cell j,<br />
∑ ni=1<br />
w i y i<br />
weighted average: ȳ = ∑ ni=1<br />
w i<br />
(3)<br />
=<br />
∑ Jj=1<br />
W j ȳ j<br />
∑ Jj=1<br />
W j<br />
.<br />
<strong>Survey</strong> weights in general depend on the actual data<br />
collected as well as on the design of the survey. For example,<br />
consider the seven CBS polls conducted during<br />
the week before the 1988 Presidential election. These<br />
surveys had identical designs <strong>and</strong> targeted the same<br />
population. However, the weighting factor assigned to<br />
men (compared to a factor of 1 for women) varies from<br />
as low as 1.10 to 1.27 among the seven surveys. The<br />
different samples happened to contain different ratios<br />
of men to women <strong>and</strong> hence needed different adjustments.<br />
<strong>Weighting</strong> based on sampling probabilities. Afurther<br />
complication is that survey weighting is commonly<br />
performed on some variables using inversesampling<br />
probabilities rather than poststratification.<br />
For example, in the Social Indicators <strong>Survey</strong> we<br />
assigned weights of 1/2, 1 <strong>and</strong> 2 for households <strong>with</strong><br />
multiple phone lines, exactly one phone line <strong>and</strong> intermittent<br />
phone service, respectively. Unlike poststratification<br />
weights, these weighting factors are fixed <strong>and</strong><br />
do not depend on the sample.<br />
These inverse-probability weights are important in<br />
some survey designs <strong>and</strong> are sometimes portrayed<br />
as producing unbiased estimates, but this unbiasedness<br />
breaks down in the presence of nonresponse. For<br />
example, some telephone surveys give each respondent<br />
a weighting factor proportional to the number<br />
of adults in his or her household; this is an inverseprobability<br />
weight given that all households are equally<br />
likely to be selected (after correcting for the number<br />
of telephone lines) <strong>and</strong> the respondent is selected<br />
at r<strong>and</strong>om among the adults in the household.<br />
In practice, however, such weighting overrepresents<br />
persons in large households, presumably because it<br />
is easier to find someone at home from a household<br />
where more adults are living. Poststratification weights<br />
(which are roughly approximate to weighting by the<br />
square root of the number of adults in the households)<br />
give a better fit to the population (Gelman <strong>and</strong> Little,<br />
1998).<br />
In this article we shall assume that any factors associated<br />
<strong>with</strong> sampling weights have already been folded<br />
into the poststratification. For example, consider a survey<br />
that is poststratified into 16 categories (2 sexes ×<br />
2 ethnicity categories × 4 age ranges), <strong>and</strong> also has<br />
telephone weights of 1/2, 1 <strong>and</strong> 2. The three categories<br />
of telephone weights would then represent another<br />
dimension in the adjustment, thus giving a total<br />
of 48 categories. We recognize that treating this<br />
weighting as pure poststratification is an oversimplification;<br />
for one thing, sampling variances for poststratified<br />
estimates are generally different from those for<br />
fixed weights (see, e.g., Binder, 1983; Lu<strong>and</strong>Gelman,<br />
2003).<br />
1.3 Competing Methods of Estimation: Weighted<br />
Averages, Weighted <strong>Regression</strong> <strong>and</strong><br />
Unweighted <strong>Regression</strong> Controlling for X<br />
Many researchers have noted the challenge of using<br />
survey weights in regression models (as reviewed, e.g.,